Introduction
Goldberg and Costa (Reference Goldberg and Costa1981) developed a concept of cognitive routine/novelty to describe functional hemispheric specialization: the right hemisphere was considered to be involved in exploratory processing of novel cognitive situations, and the left in processes mediated by well-routinized representations and strategies. This hypothesis is supported by a wide range of structural findings. The right hemisphere is characterized by higher concentration of spindle neurons with very long axons (Allman et al., Reference Allman, Tetreault, Hakeem, Manaye, Semendeferi, Erwin and Hof2010) and greater number of interconnected columns, in contrast to the left hemisphere (Hutsler & Galuske, Reference Hutsler and Galuske2003) meaning the prevalence of interregional integration in the right and intraregional integration in the left hemisphere (Goldberg & Costa, Reference Goldberg and Costa1981), which was also supported by the graph analysis results (Iturria-Medina et al., Reference Iturria-Medina, Pérez Fernández, Morris, Canales-Rodríguez, Haroon, García Pentón and Melie-García2010). The novelty-routinization theory also relies on the data from functional neuroimaging studies demonstrating right hemisphere activation as a response to unfamiliar information and left hemisphere activation as the material becomes familiar (e.g., Gold, Berman, Randolph, Goldberg, & Weinberger, Reference Gold, Berman, Randolph, Goldberg and Weinberger1996; Henson, Shallice, & Dolan, Reference Henson, Shallice and Dolan2000; Lai, van Dam, Conant, Binder, & Desai, Reference Lai, van Dam, Conant, Binder and Desai2015; Martin, Wiggs, & Weisberg, Reference Martin, Wiggs and Weisberg1997).
The novelty-routinization approach is closely linked to the other dichotomy introduced by Goldberg, Funk, and Podell (Reference Goldberg, Funk and Podell2012), namely veridical versus non-veridical, or agent-centered, decision-making (DM). Veridical DM can be found in a task with a clearly predetermined response (e.g., “5 + 5 = ?” or “What day of the week will be September 15, 4937?”; Goldberg et al., Reference Goldberg, Funk and Podell2012). However, high degree of uncertainty in our everyday life leads to the demand for autonomous goal-setting closely linked to another type of DM, agent-centered, driven by personal goals and preferences of an individual and associated with freedom of choice (e.g., choosing from a restaurant menu or career decisions; Goldberg et al., Reference Goldberg, Funk and Podell2012).
To investigate agent-centered DM, Goldberg, Harner, Lovell, Podell, and Riggio (Reference Goldberg, Harner, Lovell, Podell and Riggio1994) designed the Cognitive Bias Task (CBT), “capable of quantifying the impact of cognitive context on response selection” (p. 277). The CBT, in contrast to traditional cognitive tasks, is based on a participant’s preference rather than performance accuracy and aimed at the evaluation of cognitive styles but not abilities. In each of 60 CBT trials, a participant is visually presented with a target (a colored simple geometric shape) and two possible choices, one more and the other less similar to the target. Participants are asked to look at the target and then choose one of the two other geometrical shapes which they like best; they are also told that there are no correct or incorrect answers. A target is presumed to provide a cognitive context, and CBT results are based on the calculation of the degree to which the target influences binary choice response selection. The final converted CBT score (cCBTs) ranges from 0 (context-independency [CI], i.e., responses are determined by the subject’s own perceptual preference) to 70 (context-dependency [CD], i.e., responses are target-driven). Notably, the general strategies of choosing pictures either similar to the target or different from it are both target-driven.
Goldberg et al. (Reference Goldberg, Harner, Lovell, Podell and Riggio1994) hypothesized that in the CBT, CD would be associated with the left prefrontal cortex (PFC) functioning and CI with the right PFC functioning in right-handers. However, they revealed sexual dimorphism in CD/CI and underlying functional brain mechanisms of contextual DM. Among healthy right-handed participants, males were more CD than females. Among right-handed males, lateralized PFC injuries influenced the results of the CBT in opposite ways: participants with right frontal lesions made more CD responses and with left frontal lesions made more CI responses. In right-handed females, both left and right frontal injuries resulted in CD responses. The authors concluded that in right-handed males, the left frontal system underlay response selection guided by the current cognitive context, whereas the right was responsible for CI selection. In right-handed females, both frontal systems maintained CI responses.
However, there was only a small number of subsequent studies on contextual DM, mainly carried out on males. Shimoyama et al. (Reference Shimoyama, Aihara, Fukuyama, Hashikawa, Aoyagi, Goldberg and Nakazawa2004) found that during the CBT, males responded in a CD way demonstrating activation in the dorsolateral prefrontal cortex (DLPFC) and middle temporal gyri bilaterally as well as in the left inferior PFC and left fusiform gyrus. Aihara, Aoyagi, Goldberg, and Nakazawa (Reference Aihara, Aoyagi, Goldberg and Nakazawa2003) showed that in males CD increased from 5–7 years to adulthood. Lesion studies on male children (Aoyagi, Aihara, Goldberg, & Nakazawa, Reference Aoyagi, Aihara, Goldberg and Nakazawa2005) and adults (Podell, Lovell, Zimmerman, & Goldberg, Reference Podell, Lovell, Zimmerman and Goldberg1995) demonstrated that right frontal lesions were associated with increased CD and left frontal lesions with increased CI. We found only two studies with female participants. Transcranial magnetic stimulation of the left and right DLPFC in females triggered a shift toward a more CI selection bias (Tulviste, Goldberg, Podell, & Bachmann, Reference Tulviste, Goldberg, Podell and Bachmann2016). In the study by Stratta, Daneluzzo, Bustini, Prosperini, and Rossi (Reference Stratta, Daneluzzo, Bustini, Prosperini and Rossi2000), more females than males produced CI responses. All these results conform to the findings of Goldberg et al. (Reference Goldberg, Harner, Lovell, Podell and Riggio1994).
As we can see, the existing studies on CD/CI have several limitations. First, only two studies included female participants. Second, after the original work by Goldberg et al. (Reference Goldberg, Harner, Lovell, Podell and Riggio1994), only three neuroimaging studies with lesion and activation design, directly mapping CD/CI to brain structure, were conducted. Nowadays, a methodological shift from functional segregation (localizationism) toward functional integration (connectionism) is present in much of the neuroimaging community (Smith, Reference Smith2012; Friston, Reference Friston2011). The last approach is targeted toward exploration of functional relationships between anatomically segregated brain areas (Friston, Reference Friston2011). While the crucial role of the right versus left PFC in CD/CI was described, the contribution of the functional connectivity (FC) of PFC with other brain regions to these cognitive styles was hypothesized (Goldberg, Reference Goldberg2018), but not characterized yet. Taking into account Goldberg’s suggestions (Reference Goldberg2018) that the right hemisphere is involved in novel information processing via long and extensive connections between distant brain regions, whereas the left hemisphere deals with routinized strategies and tasks through dense connections between nearby brain regions and sparse connections between distant brain regions, we hypothesized that CD and CI participants will differ in whole-brain resting-state FC of the DLPFC. To check this, we compared the whole-brain FC of the left DLPFC between groups and then performed the same analysis for the right DLPFC. Secondly, we put forward a more specific hypothesis that the FC of the left DLPFC will be different from the FC of the right DLPFC between groups and performed between-group between-seed comparisons.
A suitable method for our purposes is resting-state fMRI (rsfMRI) which is task-independent and helps to investigate brain functional intrinsic connectivity, or the functional architecture of the brain (Lee, Smyser, & Shimony, Reference Lee, Smyser and Shimony2013). Due to the high interindividual variability of the DLPFC functional localization (Cazalis et al., Reference Cazalis, Valabrègue, Pélégrini-Issac, Asloun, Robbins and Granon2003; Nieto-Castañón & Fedorenko, Reference Nieto-Castañón and Fedorenko2012; Unterrainer et al., Reference Unterrainer, Rahm, Kaller, Ruff, Spreer, Krause and Halsband2004; Yarkoni, Poldrack, Nichols, Van Essen, & Wager, Reference Yarkoni, Poldrack, Nichols, Van Essen and Wager2011), we used arithmetic task to reveal individual seeds in the DLPFC for each participant.
Noteworthy, in our opinion, construct validity of the CBT is questionable as Goldberg et al. (Reference Goldberg, Harner, Lovell, Podell and Riggio1994) mentioned that CD behavior is based on the internal cognitive context (i.e., preexisting and routinized representations) and CI behavior is characterized by the ability to alter the context in response to nonstandard ongoing events. Design of the CBT does not provide an emulation of changing environment requiring CI, as the instructions and stimuli remain the same, whereas CD in the CBT seems not to be related to participant’s routinized knowledge and skills because it is only a perceptual orientation on a given target. On the other hand, the CBT may simulate both novelty and routine: it is based on preference, which is nontypical for cognitive tests, and at the same time similar to a common real-life situation requiring a binary choice. In order to avoid overinterpretations of the CBT results, we address neither changing environment nor reliance on routinized skills, but the degree of participant’s orientation on a target (i.e., current context).
One of the ways to clarify what the CBT measures is to look for associations between CD/CI and related psychological constructs. The CD/CI are potentially related to executive functions (EF) as these cognitive styles are the strategies of executive control in agent-centered DM; both CD/CI and EF rely on the functioning of the PFC; high EF as well as flexible use of CD/CI are both required for complex adaptation to everyday life with countless degrees of freedom (Goldberg, Reference Goldberg2009). The difference is that CD/CI are cognitive styles that cannot be compared in terms of being less or more adaptive (Goldberg, Reference Goldberg2009), while EF are cognitive abilities that can be poor or high (Goldberg et al., Reference Goldberg, Funk and Podell2012). On the one hand, CD/CI can be in a nonlinear relationship with general executive performance, since for successful adaptation a person has to be capable of using both strategies and flexibly shifting between them according to the situation (Goldberg, Reference Goldberg2009) as well as to demonstrate high EF (e.g., Barkley, Reference Barkley2001; Nieto et al., Reference Nieto, Romero, Ros, Zabala, Martínez, Ricarte and Latorre2019). Medium scores of CD/CI and high scores of EF may represent the optimum. On the other hand, linear relationships may exist between the CD/CI and specific EF components. Some EF components, in particular, working memory (WM), may be associated with CD, because “CD behaviors require response selections strongly influenced by specific task representations” (Goldberg et al., Reference Goldberg, Harner, Lovell, Podell and Riggio1994, p. 288), while WM holds online these task representations for guiding response selection according to them. Other EF components, in particular, shifting and response inhibition, may correlate with CI as the last is the ability to inhibit the current context (strategy), which turned out to be irrelevant, and switch to another one (Goldberg et al., Reference Goldberg, Harner, Lovell, Podell and Riggio1994). These two hypotheses were additionally tested in our study.
Therefore, primary aims of this study were to verify that CD and CI participants differ in whole-brain resting-state FC of the right and left DLPFC. Our secondary aims included examination of the role of factors presumably associated with the CD/CI: different aspects of executive performance along with sex and age.
Method
Participants
Research was carried out at the Radiology Department of the Federal Center of Medicine and Rehabilitation in Moscow and approved by the Interuniversity Ethics Committee of Moscow. Forty-six right-handed healthy volunteers (24 females and 22 males) without neurological or psychiatric disorders participated in the study. They were native Russian speakers, aged from 20 to 75 years old (mean age 35.4, SD = 16.9). Handedness was assessed with a modified version of the Annett Hand Preference Questionnaire (Vasserman, Dorofeeva, & Meerson, Reference Vasserman, Dorofeeva and Meerson1997). Prior to the study, all participants were screened for the MRI contraindications and signed written informed consent forms. Independent sample for post hoc analysis included 87 healthy participants (58 females and 29 males) aged from 17 to 46 years old (mean age 27, SD = 5.1) who completed the CBT but did not undergo fMRI (the data were collected through a web-based survey in a social network). These participants signed the informed consent in the electronic form.
Procedure
All participants underwent fMRI, including task-based fMRI (tbfMRI) and rsfMRI, as well as the computerized CBT outside the scanner. All the parameters of the CBT procedure and task were reproduced from the original CBT as described in the article of Goldberg et al. (Reference Goldberg, Harner, Lovell, Podell and Riggio1994). The calculation of the CBT raw and converted scores followed the algorithm described by Goldberg et al. (Reference Goldberg, Harner, Lovell, Podell and Riggio1994).
During the CBT, 60 trials were presented via Python script. In each trial, a target image and two choice images appeared on a screen (Figure 1). The images varied in five characteristics (size [big/small], color [blue/red], shape [circle/square], filling [solid or only outline], and quantity [one or two figures]) and were presented in a quasi-randomized order. The two choice images always differed in the similarity value, and the order of the choice images was balanced between the more and less similar ones. The participants received the following instruction (original instruction by Goldberg et al. [Reference Goldberg, Harner, Lovell, Podell and Riggio1994, p. 278] translated into Russian): “You will see cards with different designs. The designs may vary in several respects. You will see a card at the top and two cards below. Look at the top card and choose one of the two cards below that you like the best. There are no ‘correct’ or ‘incorrect’ responses. Your choice is entirely up to you. Please, try to choose quickly.” The participants read the standard instruction and, in case they had any questions, asked the researcher. The data were visually inspected for repeated button press on the same (top or bottom) image and no potential false performance was detected.
Example of a CBT trial. The participant looks at the top image (target) and then makes a choice between the two images presented below.

To evaluate CD/CI, we calculated the cCBTs (Goldberg et al., Reference Goldberg, Harner, Lovell, Podell and Riggio1994). First, the similarity between the target and each choice image was calculated, ranging from 0 (all five characteristics are different) to 5 (identical). These similarity values were summed across all responses to compute the raw CBT score (80–220), where high and low scores correspond to CD and middle-range scores to CI response bias. The cCBTs was the deviation of the raw CBT score from the scale midpoint and ranged from 0 (CI) to 70 (CD). The cCBTs rather than the raw CBT score was chosen for further analysis because it was “a conceptually better measure of the constructs”, being “insensitive to the direction of deviation from raw-score scale midpoint” (Goldberg et al., Reference Goldberg, Harner, Lovell, Podell and Riggio1994, p. 278); therefore, cCBTs was easier to interpret.
Participants also underwent the following classical neuropsychological tasks for EF assessment: computerized Berg Card Sorting test (modification of Wisconsin Card Sorting test) and Tower of London test (Mueller & Piper, Reference Mueller and Piper2014); Verbal Fluency and Color–Word Interference tests (Delis, Kaplan, & Kramer, Reference Delis, Kaplan and Kramer2001); and Similarities, Digit Span, and Picture Arrangement subtests of the Wechsler Test for adults, adapted for the Russian population (Filimonenko & Timofeev, Reference Filimonenko and Timofeev1995). Nineteen variables from these tasks (Table 1) were checked for associations with cCBTs. EF tasks and fMRI scanning were carried out on the same day, and the CBT was administered within a week before.
Indexes from EF tasks which were checked for associations with cCBTs. They were chosen to assess the most commonly listed EF components, namely inhibition, WM, switching, as well as more complex EF components, such as planning and abstract reasoning

DLPFC identification
The DLPFC was chosen as a seed because it was reported to be involved in agent-centered DM (Goldberg, Reference Goldberg2009; Schmitz & Johnson, Reference Schmitz and Johnson2006) and the key structure for CBT performance (Goldberg et al., Reference Goldberg, Funk and Podell2012; Shimoyama et al., Reference Shimoyama, Aihara, Fukuyama, Hashikawa, Aoyagi, Goldberg and Nakazawa2004). For individual localization of the DLPFC for subsequent resting-state seed-to-voxel analysis, each participant underwent two 7.5-min tbfMRI sessions of functional localizer for the EF-related brain regions. During the main condition of tbfMRI, participants were visually presented with already solved sums (arithmetic operations of addition, subtraction, multiplication, and division with simple and double-digit numbers). The control condition stimuli were digit lines with nonmathematical characters instead of arithmetic signs (see Figure 2).
A: Stimuli for tbfMRI; the main condition is at the bottom and the control condition is at the top. B: Outline of trials and blocks within tbfMRI session.

Participants responded with one of three buttons on the MR-compatible response box, depending on whether the stimulus sum had been solved correctly, incorrectly, or just had not been an arithmetic exercise. This task was organized with a block design: sum and non-sum blocks alternated, each block consisted of five stimuli and lasted 21 s (Pechenkova et al., Reference Pechenkova, Vlasova, Rumshiskaya, Mershina and Sinitsyn2014). The arithmetic task was chosen because mental arithmetic outside the multiplication table globally loads EF not being aimed at a particular EF component (Luria & Tsvetkova, Reference Luria and Tsvetkova1966) and localizes the DLPFC (Fehr, Code, & Herrmann, Reference Fehr, Code and Herrmann2007; Rickard et al., Reference Rickard, Romero, Basso, Wharton, Flitman and Grafman2000).
During rsfMRI scanning, lasting for 12 min, participants were asked to close their eyes, not to fall asleep, and to avoid consistent thinking about one topic during the period of scanning.
Equipment and Imaging Parameters
Images were acquired using a Siemens Magnetom Avanto 1.5-T scanner equipped with a standard Matrix head coil. T2*-weighted functional images (213 for each session of tbfMRI and 203 for rsfMRI) were obtained with the EPI pulse sequence (tbfMRI parameters: TR/TE/FA = 2100 ms/50 ms/90°; 24 slices; matrix size 64 × 64; voxel size 3 × 3 × 3 mm; rsfMRI parameters: TR/TE/FA = 3560 ms/50 ms/90°; 36 slices; matrix size 64 × 64; voxel size 3.6 × 3.6 × 3.6 mm). For each participant, T2*-weighted images were complemented by a T1-weighted anatomical image acquired with MPR sequence (TR/TE/FA = 1900 ms/2.91 ms/15°; 176 sagittal slices; voxel size 1 × 1 × 1 mm) and a field map measured with a standard GRE field mapping sequence (TR/TE1/TE2/FA = 460 ms/4.76 ms/9.52 ms/60°). Stimuli were presented with the Psychtoolbox-3 package for MATLAB; participant responses were recorded with a Current Design fORP 904 response box. The dataset is available online at https://openneuro.org/datasets/ds002422/.
Data Analysis
Neuropsychological data
Analysis of behavioral data was conducted with IBM SPSS Statistics 22. A multiple regression was run to check whether sex, age, and their interaction predicted cCBTs; independent variables were centered to avoid multicollinearity.
According to the cCBTs frequency histogram (see Figure 3), we assumed that the data were generated from a mixture of two distributions with different means, rather than from a single normal population.
Frequency histogram of cCBTs for the whole sample. High scores imply CD response bias and low scores imply CI response bias.

To examine this hypothesis, we firstly applied Hartigans’ Dip Test for Unimodality (Hartigan & Hartigan, Reference Hartigan and Hartigan1985), implemented in the R (version 3.5.2) package diptest, and revealed that the cCBTs distribution was non-unimodal (D = 0.10, p < .001), that is, at least bimodal. Then we performed Gaussian mixture modeling for model-based clustering implemented in the R package mclust (Scrucca, Fop, Murphy, & Raftery, Reference Scrucca, Fop, Murphy and Raftery2016). At first, Box-Cox Transformation was applied to the data (with a lambda of 0.5 as was estimated in the package caret) as one of the proposed subpopulations (cCBTs > 30; n = 22) was not distributed normally (Kolmogorov–Smirnov normality test: D = 0.23, p = .004). After that, unsupervised model-based clustering was performed using the Expectation–Maximization algorithm. Model choice and the optimal number of mixture components were determined based on the Bayesian information criterion (Fraley & Raftery, Reference Fraley and Raftery1998) and the integrated complete-data likelihood criterion (Biernacki, Celeux, & Govaert, Reference Biernacki, Celeux and Govaert2000). Both criteria reached maximum in mixture models with two clusters (scores >30, n = 22; and scores <30, n = 24). Additionally, the selection of mixture components number was performed by formal hypothesis testing, that is by likelihood ratio testing (LRT), with significance estimated by a resampling approach. LRT p-values also clearly indicated the presence of two clusters (1 vs. 2 clusters, p = .001; 2 vs. 3 clusters, p = .12).
As the result of the above analysis, the sample was divided into two groups, CD and CI, for further comparison of DLPFC whole-brain FC between these groups (see Table 2 for descriptive statistics).
Descriptive statistics of cCBTs in CD and CI participants

To test our hypotheses about linear and nonlinear relationships between EF and CD/CI, we employed linear and polynomial (degree 2) regression, with the cCBTs as an independent variable and each EF index as a dependent variable. Statistical threshold was adjusted using Bonferroni correction (19 variables × 2 models = 38; p < .05/38, i.e., p < .0013).
fMRI data
Functional MRI data were preprocessed with SPM12. Structural images underwent reorientation to the anterior/posterior commissure (AC/PC) plane, co-registration with functional images, segmentation into white matter, gray matter, and cerebrospinal fluid, and spatial normalization to the Montreal Neurological Institute (MNI) template. Preprocessing of the functional data included reorientation to the AC/PC plane; slice time correction, realignment, and correction for magnetic field inhomogeneities; spatial normalization into MNI space; and spatial smoothing with an 8-mm full-width half-maximum Gaussian kernel.
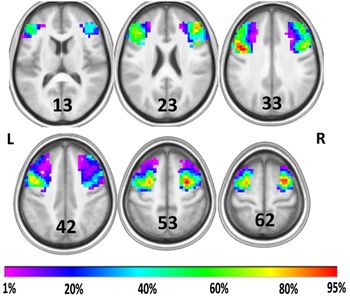
After preprocessing, the tbfMRI data were analyzed via SPM12. A general linear model (GLM) was estimated, and one-sided t-contrasts for the task versus control conditions were computed. Activation from the arithmetic task in each participant was thresholded at p < .001 (uncorrected), cluster size k > 5. Then individual activation maps were binarized and restricted to the left and right middle frontal gyrus. The mask of the middle frontal gyrus was taken from the Harvard-Oxford probabilistic atlas (https://fsl.fmrib.ox.ac.uk/fsl/fslwiki/Atlases) with a threshold of 0%. The obtained individual functional regions of interest (ROIs) of the EF-related portions of DLPFC (Figure 4 and Table 3) were then used as subject-specific seeds in the connectivity analysis of the rsfMRI data. DLPFC sizes were normally distributed (Kolmogorov–Smirnov normality test; D = 0.086, p = .2 for the left and right DLPFC).
Two ROIs (seeds) in the seed-to-voxel analysis: frequency map for the individual masks of the right and left DLPFC obtained with tbfMRI involving EF. Red indicates voxels included in ROI in 95% of participants and purple in 1%. The map is overlaid on averaged and spatially normalized to MNI space anatomy of all 46 participants.

ROI average volume and center of mass

As the size of the left DLPFC was significantly greater than the size of the right DLPFC (t-test for paired samples, t (45) = 4.96, p < .0001), we compared the difference between left and right DLPFC size in CD versus CI participants. No between-group differences were revealed (t-test for independent samples, t (32.237) = 0.259, p = .797); therefore, the seed size would not influence the results. Nevertheless, to take into account any possible residual effects, we also controlled for the effect of seed size on FC by entering the seed size difference as a covariate into a two-way ANCOVA (see below).
The rsfMRI data were further analyzed using Conn v.17b (Whitfield-Gabrieli & Nieto-Castanon, Reference Whitfield-Gabrieli and Nieto-Castanon2012). A seed-based correlation analysis was performed revealing FC between the seeds and other brain regions. RsfMRI data were bandpass-filtered (0.008–0.09 Hz). Identification of outlier scans for scrubbing was performed on the basis of Artifact Detection Tools (ART; with intermediate settings: 97 percentiles of safe scans in a normative sample), and head motion artifacts were corrected using aCompCor (Behzadi, Restom, Liau, & Liu, Reference Behzadi, Restom, Liau and Liu2007); individual motion parameters were included as first-level covariates. Age did not correlate with motion. Using GLM with random effects, we compared whole-brain FC of the left, then right DLPFC between groups with CD and CI response bias in CBT; t-contrasts were calculated (p < .005 on voxel level, false discovery rate [FDR] corrected on cluster level). Since age is a frequent confound in connectivity studies, age along with sex and number of outlier scans were converted to z-scale and included into linear model as covariates. We also checked for interaction effects between sex and CBT performance, and then between age and CBT performance, on DLPFC FC in the whole sample. As a separate analysis was conducted for right and left DLPFC seeds, the whole-brain cluster-level statistical threshold was adjusted using Bonferroni correction (p(FDRc) < .05/2, i.e., p(FDRc) < .025). The next stage of the analysis was the comparison of the whole-brain FC of the left versus the right DLPFC in CD versus CI participants (two-way ANCOVA). The difference between the sizes of left and right DLPFC was entered as an additional covariate into the model.
Results
Comparison of the Whole-Brain FC of the Left and Right DLPFC (Separately) in CD versus CI Participants
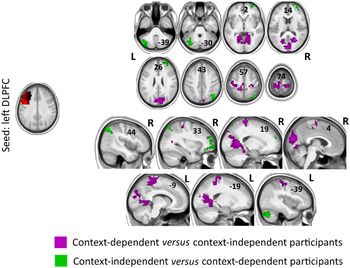
CD participants had stronger positive FC of (1) the left DLPFC with pre-, postcentral, and supplementary motor area regions as well as lingual gyri, cuneal, intra- and supracalcarine cortex, precuneus, and occipital pole bilaterally (Figure 5, violet color); (2) the right DLPFC with postcentral gyrus and precuneus bilaterally (Figure 6, violet color) (Table 4).
These clusters demonstrated stronger positive FC with left DLPFC in CD versus CI participants (violet) and in CI versus CD participants (green; p < .005 on voxel level and p(FDRc) < .025 on cluster level). Components are overlaid on averaged and spatially normalized to MNI space anatomy of all 46 participants.

These clusters demonstrated stronger positive FC with right DLPFC in CD versus CI participants (violet) and in CI versus CD participants (green; p < .005 on voxel level and p(FDRc) < .025 on cluster level). Components are overlaid on averaged and spatially normalized to MNI space anatomy of all 46 participants.

Volumes and coordinates of regional clusters that demonstrated different FC with DLPFC in CD and CI participants

Note: lDLPFC = left DLPFC, rDLPFC = right DLPFC.
CI participants had stronger positive FC of (1) the left DLPFC with left cerebellar hemisphere (crus I and crus II), right dorsolateral, ventrolateral, rostrolateral, and orbitofrontal PFC as well as right angular gyrus and superior lateral occipital cortex (Figure 5, green color); (2) the right DLPFC with the right cerebellum hemisphere (crus I and crus II; Figure 6, green color) (Table 4).
There were no sex–cCBTs or age–cCBTs interaction effects on the DLPFC FC.
Comparison of the Whole-Brain FC of Left versus Right DLPFC in CD versus CI Participants
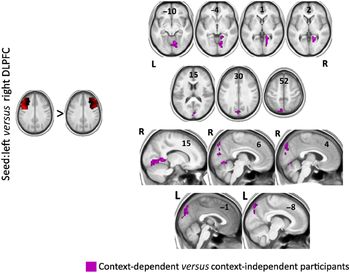
The left DLPFC had stronger positive FC with right lingual gyrus and supracalcarine cortex and bilateral cuneal cortex in CD participants (Figure 7; Table 4).
These clusters demonstrated stronger positive FC with left versus right DLPFC in CD versus CI participants (p < .005 on voxel level and p(FDRc) < .025 on cluster level). Components are overlaid on averaged and spatially normalized to MNI space anatomy of all 46 participants.

Effect sizes, namely beta-values (between-group average differences in Fisher’s transformed correlation coefficients between a seed and a cluster) and Cohen’s d for each cluster, are also reported in Table 4.
Behavioral Data
Multiple regression model with sex, age, their interaction as predictors, and cCBTs as a dependent variable did not fit the data (F (3,42) = 1.244, p = .31, R 2 = .082) and none of the independent variables predicted cCBTs (p = .769 for age, p = .485 for sex, and p = .078 for their interaction). Additionally, we ran post hoc analysis on the independent sample of 87 healthy participants who completed the CBT but did not undergo fMRI: multiple regression model with the same variables also did not fit the data (F (3,83) = 0.666, p = .57, R 2 = .024) and none of the independent variables predicted cCBTs (p = .384 for age, p = .693 for sex, and p = .638 for their interaction).
All linear and polynomial (degree 2) regression models with cCBTs as an independent variable and each EF index as a dependent variable were nonsignificant after correction for multiple comparisons, except the polynomial regression model with productivity in Digit Span test (F (2,43) = 9.528, p = .0004, R 2 = .307; Figure 8). CI was associated with medium WM scores, medium CD/CI with best WM scores, and strong CD with low WM scores.
The scatterplot demonstrating associations between cCBTs and Digit Span test productivity. Polynomial regression model with cCBTs as an independent variable and Digit Span test productivity as a dependent variable fit the data (F (2,43) = 9.528, p = .0004, R 2 = .307).

The revealed relationship between WM and CD/CI was further considered from the perspective of possible associations with FC of the DLPFC. We revealed significant effect of interaction between CD/CI group and WM score on FC of the right versus left DLPFC with the cluster in the right lingual gyrus and inferior lateral occipital cortex. Better WM in CD group was associated with stronger positive FC of the right DLPFC with this cluster, whereas better WM in CI group was associated with stronger positive FC of the left DLPFC with this cluster (Figure 9; Table 4).
Better WM in CD participants was associated with stronger positive FC of the right versus left DLPFC with this cluster, whereas better WM in CI participants was related to stronger positive FC of the left versus right DLPFC with this cluster (p < .005 on voxel level and p(FDRc) < .025 on cluster level). Components are overlaid on averaged and spatially normalized to MNI space anatomy of all 46 participants.

Discussion
This study was aimed at the investigation of brain mechanisms underlying contextual DM operationalized using the CBT. Noteworthy, we describe the first neuroimaging study of contextual DM in healthy participants with a sample which provided sufficient power to detect FC differences between CD and CI participants (the largest sample in previous studies included 12 participants – Shimoyama et al., Reference Shimoyama, Aihara, Fukuyama, Hashikawa, Aoyagi, Goldberg and Nakazawa2004). The main aim of our study was to explore the patterns of DLPFC FC underlying CD/CI. The secondary aims included further investigation of the influence of sex- and age-related factors, along with different aspects of executive performance, on the preference for CD/CI choices. The use of the rsfMRI rather than tbfMRI allowed us to reveal the patterns of FC related to intrinsic cognitive styles rather than instantaneous performance.
According to the CBT performance, the sample split into CD and CI participants. There were three main performance strategies: to choose images mostly similar to a target (CD), mostly different from a target (CD), or both similar and different as the choice relied not on a target but participant’s own preferences (CI). Revealed bimodal distribution in CD/CI scores supported Goldberg’s suggestion about the existence of the two opposite cognitive styles, CD and CI.
Our findings were age- and sex-independent. CD versus CI was associated with stronger positive FC of the left DLPFC with motor (pre-, postcentral regions, and supplementary motor area) and visual (lingual gyri, cuneal, intra- and supracalcarine cortex, precuneus, and occipital pole bilaterally) areas. These results are in agreement with initial sex-unrelated hypothesis of Goldberg et al. (Reference Goldberg, Harner, Lovell, Podell and Riggio1994) that the left DLPFC underlies CD. Through reciprocal connections to visual and motor regions (Tanji & Hoshi, Reference Tanji and Hoshi2008), possibly involved in storing representations linked to current real-life situations, the DLPFC maintains selection and bringing online goal-appropriate internal representations to trigger a behavior influenced by cognitive context (Barbey, Koenigs, & Grafman, Reference Barbey, Koenigs and Grafman2013; Owen, McMillan, Laird, & Bullmore, Reference Owen, McMillan, Laird and Bullmore2005; Szczepanski & Knight, Reference Szczepanski and Knight2014).
The right DLPFC in CD versus CI participants demonstrated stronger positive FC with the same visual and motor regions but less extensive than in the case of the left DLPFC (only postcentral gyrus and precuneus). At first glance, these data may seem contrary to the results of Goldberg et al. (Reference Goldberg, Harner, Lovell, Podell and Riggio1994) who revealed CD to be associated with the left, but not right, frontal lobe lesions. However, Goldberg (Reference Goldberg2009) also developed a gradient approach, according to which the localization of cognitive functions in associative cortex is gradual and continuous. One of the examples is right-lateralized activation as a response to unfamiliar information and left-lateralized activation as the material becomes familiar (e.g., Gold et al., Reference Gold, Berman, Randolph, Goldberg and Weinberger1996; Henson et al., Reference Henson, Shallice and Dolan2000; Lai et al., Reference Lai, van Dam, Conant, Binder and Desai2015; Martin et al., Reference Martin, Wiggs and Weisberg1997). Therefore, it is possible to assume that CD, more associated with the left hemisphere, may gradually turn to CI, more associated with the right hemisphere. Our findings are also consistent with data of Shimoyama et al. (Reference Shimoyama, Aihara, Fukuyama, Hashikawa, Aoyagi, Goldberg and Nakazawa2004) who revealed bilateral DLPFC activation in the CBT in CD males. To conclude, a possible interpretation is the dominance of the left DLPFC in CD, nevertheless, this cognitive style can also be associated with the right DLPFC, but to a lesser degree. This interpretation is also supported by the results of between-group between-seed comparison of the FC in our study: in CD versus CI participants, the left versus the right DLPFC demonstrated stronger positive FC with visual areas (that intersected with previous findings).
CI versus CD was linked to stronger positive FC of the left DLPFC with the left cerebellum (crus I and II), right PFC (dorsolateral, ventrolateral, rostrolateral, and orbitofrontal) as well as right angular gyrus and lateral occipital cortex, and of the right DLPFC with the right cerebellum (crus I and II). The cerebellum was recently reported to be involved in attention, language, social cognition, and EF (Sokolov, Miall, & Ivry, Reference Sokolov, Miall and Ivry2017), namely WM, response inhibition, and multitasking (Bellebaum & Daum, Reference Bellebaum and Daum2007). The cerebellum is functionally connected with the frontoparietal control (or executive) network (Buckner, Krienen, Castellanos, Diaz, & Yeo, Reference Buckner, Krienen, Castellanos, Diaz and Yeo2011; Dosenbach, Fair, Cohen, Schlaggar, & Petersen, Reference Dosenbach, Fair, Cohen, Schlaggar and Petersen2008; Fair et al., Reference Fair, Dosenbach, Church, Cohen, Brahmbhatt, Miezin and Schlaggar2007; Reineberg, Andrews-Hanna, Depue, Friedman, & Banich, Reference Reineberg, Andrews-Hanna, Depue, Friedman and Banich2015) which is characterized by the largest absolute representation in the cerebellum compared to any other network (Marek et al., Reference Marek, Siegel, Gordon, Raut, Gratton, Newbold and Zheng2018). Each cerebellum hemisphere (especially, crus I and crus II) was found to be more functionally connected to contralateral lateralized frontoparietal networks (Habas et al., Reference Habas, Kamdar, Nguyen, Prater, Beckmann, Menon and Greicius2009; Shirer, Ryali, Rykhlevskaia, Menon, & Greicius, Reference Shirer, Ryali, Rykhlevskaia, Menon and Greicius2012). In our study, left and right DLPFC demonstrated positive FC with ipsilateral cerebellar hemispheres that might point to interactions between two lateralized DLPFC-related networks via cerebellum. Furthermore, the left DLPFC showed stronger positive FC with right dorsolateral (BA 9 and 46), ventrolateral (BA 47), and rostrolateral (BA 10) PFC. Rostrolateral PFC is involved in real-world multitasking situations, when there are potential distractions in the environment and multiple instructions to be followed (Gilbert & Burgess, Reference Gilbert and Burgess2008). Burgess, Dumontheil, and Gilbert (Reference Burgess, Dumontheil and Gilbert2007) put forward a “gateway” hypothesis: this region coordinates switching between cognitive processes directed toward current incoming perceptual information and information generated by the individual (e.g., long-term goals). So, this region seems essential and specific for CI behavior when changing environment requires creating novel behavior strategies, or for CBT-specific CI responses when participants switch from incoming perceptual information (two possible choices) to their associations. Ventrolateral and orbitofrontal PFC might be involved in the inhibition of context-driven response, central for CI (Szczepanski & Knight, Reference Szczepanski and Knight2014). Although, according to the results of behavioral data analysis, at this stage we have not found associations between CD/CI and switching and inhibition, neuroimaging results indicate that they might be related to one another and this should be further explored. Angular gyrus is a part of associative temporal-parietal-occipital cortex that is involved in simultaneous processing and storing of complex visuospatial information (Caspers, Amunts, & Zilles, Reference Caspers, Amunts and Zilles2012; Luria, Reference Luria1980); CI participants might use novel strategies instead of target-driven response, namely evoking complex associations from previous experience. Our results are consistent with the findings of Walter and Dassonville (Reference Walter and Dassonville2011) who revealed activation in the frontoparietal network associated with field independence in the Embedded Figures Task (field-independent vs. dependent individuals can easily perceive the embedded part as they are less influenced by the surrounding field); processing speed correlated predominantly with right-lateralized network. CD participants demonstrated no FC between left and right DLPFC, in contrast to CI.
Noteworthy, our main aim was to explore the differences between CD/CI participants in the FC of DLPFC, and the most important finding of our study was that resting-state connectivity of the DLPFC provides a neural correlate for these cognitive styles. The interpretations of how revealed brain regions might contribute to CD or CI through cognitive functions (e.g., EF) are speculative.
Our study was the first attempt to replicate the findings of Goldberg et al. (Reference Goldberg, Harner, Lovell, Podell and Riggio1994) regarding sex differences in CD/CI after Stratta et al. (Reference Stratta, Daneluzzo, Bustini, Prosperini and Rossi2000). Contrary to the results of Goldberg et al. (Reference Goldberg, Harner, Lovell, Podell and Riggio1994), we found no sex differences in the CD/CI and related DLPFC FC. Speculatively, it might be related to sociocultural factors; gender roles could have changed (e.g., blurred) over the last 20 years. Age also did not interact with CD/CI that might occur because our participants were adults with already formed functional frontal systems, in contrast to the study of Aihara et al. (Reference Aihara, Aoyagi, Goldberg and Nakazawa2003) who compared children to adolescents and adults.
For better understanding of the role of CD/CI among other cognitive characteristics, we investigated relationships between CD/CI and EF. Among all tested EF aspects, only Digit Span test productivity (i.e., WM) was associated with CD/CI: CI with medium WM scores, medium CD/CI with best WM scores, and strong CD with low WM scores. This result is contrary to our second hypothesis about positive correlation between WM and CD (Goldberg et al., Reference Goldberg, Harner, Lovell, Podell and Riggio1994). Such correlation would also be expected because WM relies on the strong intrahemispheric connections between frontal and sensory cortices (Goldberg, Reference Goldberg2018), which were associated with CD in our study. These findings partially support our first hypothesis that high EF are combined with medium CD/CI scores, representing the optimum of adaptation: effective WM is associated with use of both strategies. However, this model turned out to concern only one aspect of EF, WM. Although we did not reveal associations between other EF indexes and CD/CI, neuroimaging results point to possible relations between inhibition and shifting, on the one hand, and CD/CI, on the other hand. Relations between different EF components and CD/CI seem to remain an open issue and further studies are required to clarify it.
We obtained a significant effect of interaction between CD/CI group and WM score on FC of the right versus left DLPFC with the cluster in visual areas. This finding overlapped with the regions that demonstrated stronger positive FC with the left DLPFC in CD versus CI participants in general and might be involved in storing of visual representations. Reversely, better WM in CD versus CI individuals was associated with stronger positive FC of the right versus left DLPFC with this cluster in visual regions. Our findings may indicate diverse contribution of the right versus left DLPFC in WM in CD and CI cognitive styles.
To conclude, this study was the first to reveal differences between CD/CI in the DLPFC FC. In CD participants, both left and right DLPFC had stronger positive FC with visual and motor areas possibly involved in storing representations linked to current real-life situations (brain representations of a given target and motor choice); the DLPFC interacts with these regions to provide online holding of representations and trigger a behavior influenced by cognitive context. According to our findings, the left DLPFC can be dominant in CD behavior.
CI was associated with FC of the left DLPFC with a wide range of right-lateralized associative brain regions, possibly involved in the inhibition of the CD response, switching from current incoming perceptual information to information generated by the individual, and creation of original response strategies. CI was also associated with stronger positive FC of the left and right DLPFC with ipsilateral cerebellar hemispheres that might indicate interactions between the lateralized DLPFC-related networks via cerebellum in CI.
Acknowledgments
The authors thank Elena Mershina for her help in study organization, Maria Fomina for data structure formalization, and Mihail Levitchii for automating routine tasks in data preparation for open access.
Financial support
This research did not receive any specific grant from funding agencies in the public, commercial, or not-for-profit sectors.
Ethics of human subject participation
The study was completed in accordance with the Helsinki Declaration. Informed consent was obtained from all individual participants included in the study.
Conflict of Interest
The authors have nothing to disclose.