1. Introduction
A capsule is formed by a liquid drop core enclosed by a thin membrane, which can be engineered with tailored mechanical properties such as strain-softening, strain-hardening and viscoelastic properties (Barthès-Biesel Reference Barthès-Biesel2016). Capsules have emerged as a promising material for encapsulation, transportation and sustained release of substances in various applications such as cosmetics, personal care products, self-healing paints, fire-retardant coatings and pharmaceutical drugs (Kim et al. Reference Kim, Liu, Zhang, Cheng, Yu Wu and Sun2009; Luo & Bai Reference Luo and Bai2019; Bah, Bilal & Wang Reference Bah, Bilal and Wang2020; Sun et al. Reference Sun, Fu, Peng, Jiao, Liu, Du and Zhang2021). They are also used as a simplified model to study complex biological cells such as red blood cells (RBCs) numerically (Zhang, Johnson & Popel Reference Zhang, Johnson and Popel2007; Krüger Reference Krüger2012; Gekle Reference Gekle2016; Bächer et al. Reference Bächer, Kihm, Schrack, Kaestner, Laschke, Wagner and Gekle2018; Shen et al. Reference Shen, Farutin, Fischer, Vlahovska, Harting and Misbah2018).
The viscous component of the membrane is often disregarded when simulating the flow behaviour of RBCs. However, microfluidic experiments have shown that, in such systems, the membrane surface viscosity is an important feature, and the interplay between the viscous and elastic contributions of the membrane is not trivial (Tran-Son-Tay, Sutera & Rao Reference Tran-Son-Tay, Sutera and Rao1984; Tomaiuolo et al. Reference Tomaiuolo, Barra, Preziosi, Cassinese, Rotoli and Guido2011; Tomaiuolo & Guido Reference Tomaiuolo and Guido2011; Braunmüller et al. Reference Braunmüller, Schmid, Sackmann and Franke2012; Prado et al. Reference Prado, Farutin, Misbah and Bureau2015; Tomaiuolo et al. Reference Tomaiuolo, Lanotte, D'Apolito, Cassinese and Guido2016). The mechanical and rheological properties of suspensions of purely elastic capsules have been thoroughly studied analytically (Barthès-Biesel & Rallison Reference Barthès-Biesel and Rallison1981; Barthès-Biesel Reference Barthès-Biesel1980, Reference Barthès-Biesel1991, Reference Barthès-Biesel1993; Barthès-Biesel, Diaz & Dhenin Reference Barthès-Biesel, Diaz and Dhenin2002), experimentally (Chang & Olbricht Reference Chang and Olbricht1993; Walter, Rehage & Leonhard Reference Walter, Rehage and Leonhard2001) and numerically (Pozrikidis Reference Pozrikidis1995; Ramanujan & Pozrikidis Reference Ramanujan and Pozrikidis1998; Diaz, Pelekasis & Barthès-Biesel Reference Diaz, Pelekasis and Barthès-Biesel2000; Dodson & Dimitrakopoulos Reference Dodson and Dimitrakopoulos2009; Clausen & Aidun Reference Clausen and Aidun2010; Bagchi & Kalluri Reference Bagchi and Kalluri2011; Clausen, Reasor & Aidun Reference Clausen, Reasor and Aidun2011; Krüger, Varnik & Raabe Reference Krüger, Varnik and Raabe2011; Pranay, Henríquez-Rivera & Graham Reference Pranay, Henríquez-Rivera and Graham2012; Cordasco & Bagchi Reference Cordasco and Bagchi2013; Karyappa, Deshmukh & Thaokar Reference Karyappa, Deshmukh and Thaokar2014; Krüger, Kaoui & Harting Reference Krüger, Kaoui and Harting2014; Rorai et al. Reference Rorai, Touchard, Zhu and Brandt2015; Alizad Banaei et al. Reference Alizad Banaei, Loiseau, Lashgari and Brandt2017; Kessler, Finken & Seifert Reference Kessler, Finken and Seifert2008; Tran et al. Reference Tran, Le, Leong and Le2020; Wouters et al. Reference Wouters, Aouane, Sega and Harting2020; Aouane, Scagliarini & Harting Reference Aouane, Scagliarini and Harting2021; Bielinski et al. Reference Bielinski, Aouane, Harting and Kaoui2021; Esposito et al. Reference Esposito, Romano, Hulsen, D'Avino and Villone2022). However, only a few studies were dedicated to understanding the effect of the capsules’ membrane viscosity (Barthès-Biesel & Sgaier Reference Barthès-Biesel and Sgaier1985; Diaz, Barthès-Biesel & Pelekasis Reference Diaz, Barthès-Biesel and Pelekasis2001; Yazdani & Bagchi Reference Yazdani and Bagchi2013; Li & Zhang Reference Li and Zhang2019; Guglietta et al. Reference Guglietta, Behr, Biferale, Falcucci and Sbragaglia2020, Reference Guglietta, Behr, Biferale, Falcucci and Sbragaglia2021a; Zhang et al. Reference Zhang, Han, Zhang, Chen, Ding and Shi2020; Guglietta et al. Reference Guglietta, Behr, Falcucci and Sbragaglia2021b; Li & Zhang Reference Li and Zhang2021; Rezghi & Zhang Reference Rezghi and Zhang2022; Rezghi, Li & Zhang Reference Rezghi, Li and Zhang2022).
In their theoretical contribution, Barthès-Biesel & Sgaier (Reference Barthès-Biesel and Sgaier1985) performed perturbative calculations in the small-deformation limit showing that the membrane viscosity reduces the overall deformation. Concerning the loading time, that is, the time required to reach the steady-state deformation, Diaz et al. (Reference Diaz, Barthès-Biesel and Pelekasis2001) were among the first investigating the effect of membrane viscosity on the transient dynamics using numerical simulations: using a boundary integral method they showed that, in an elongational flow, the presence of the membrane viscosity induces an increase in the loading time that is proportional to the membrane viscosity. Yazdani & Bagchi (Reference Yazdani and Bagchi2013) studied the effect of the membrane viscosity on the deformation and the tank-treading frequency of a single viscoelastic capsule numerically, also observing wrinkles appearing on the surface due to the membrane viscosity. Recently, Li & Zhang (Reference Li and Zhang2019, Reference Li and Zhang2020) coupled a finite difference method with the immersed boundary–lattice Boltzmann (IB-LB) method to simulate the effect of the viscosity at the interface. This implementation has been then employed to investigate mainly the dynamics of RBCs, highlighting the key role played by the membrane viscosity on the deformation and the associated characteristic times (Guglietta et al. Reference Guglietta, Behr, Biferale, Falcucci and Sbragaglia2020, Reference Guglietta, Behr, Falcucci and Sbragaglia2021b; Li & Zhang Reference Li and Zhang2021) as well as on the tumbling and tank-treading dynamics (Guglietta et al. Reference Guglietta, Behr, Biferale, Falcucci and Sbragaglia2021a; Rezghi & Zhang Reference Rezghi and Zhang2022).
The works mentioned previously investigate the effect of membrane viscosity on single capsules. However, the understanding of its effect on the suspension of capsules is still missing. To the best of the authors’ knowledge, a parametric study on the effect of membrane viscosity on such systems does not exist yet. Our contribution aims at filling this gap by focusing on generic spherical viscoelastic capsules. We present the results of a numerical investigation of the effect of membrane viscosity on suspensions of (initially spherical) viscoelastic capsules by using our coupled IB-LB implementation.
To study the impact of membrane viscosity, quantified via the Boussinesq number  $Bq$ (see (3.3)), on the deformation
 $D$ and loading time
 $t_{{\tiny L}}$, we conducted simulations using different values of
 $\textit {Bq}$, capillary number
 $\textit {Ca}$ and volume fraction
 $\phi$. We aim to investigate how different values of the membrane viscosity and volume fraction affect the deformation and loading time of viscoelastic capsules.
The remainder of this paper is organised as follows. In § 2 we present a few details on the IB-LB method (§ 2.1) and the viscoelastic membrane model (§ 2.2). In § 3, we provide details on the numerical set-up and introduce the main dimensionless numbers. Section 4 is dedicated to the numerical results: we first show and discuss the deformation and the loading time for a single capsule (§ 4.1) and then for suspensions with different volume fraction (§ 4.2). We finally summarise the main findings and provide some conclusions and future perspectives in § 5.
2. Numerical model
We simulate the dynamics of the capsules and the surrounding fluid using the coupled IB-LB method. In a nutshell, the immersed boundary (IB) method uses a triangulated mesh of Lagrangian points as support to compute forces that are then used to impose the correct space and time-dependent boundary conditions on the fluid, which is simulated using the LB method. The IB-LB method provides a two-way coupling: the boundary surface deforms due to the fluid flow, and the fluid local momentum balance is changed due to the viscoelastic forces exerted by the boundary surface. Boundary surface forces comprise membrane elasticity, membrane viscosity, a volume-conserving regularisation term and a repulsive force to prevent capsules from penetrating each other. Details are reported in the following.
2.1. The IB-LB method
The LB method solves numerically a discretised version of the Boltzmann transport equation for the particle populations  ${n}_i$, representing the probability density function of fluid molecules moving with a discrete velocity
 $\boldsymbol {c}_i$ at position
 $\boldsymbol {x}$ on the lattice and at time
 $t$ (Benzi, Succi & Vergassola Reference Benzi, Succi and Vergassola1992). The solution to the Navier–Stokes equations emerges from the transport equation via the calculation of the moments of the particle distribution and the appropriate Chapman–Enskog analysis (Chapman & Cowling Reference Chapman and Cowling1990).
The evolution of the functions  ${n}_i$ provided by the lattice Boltzmann (LB) equation is
 \begin{equation} {n}_i(\boldsymbol{x}+\boldsymbol{c}_i\Delta t, t+ \Delta t) - {n}_i(\boldsymbol{x}, t) = \varOmega_i + S_i , \end{equation}
where  $\Delta t$ is the discrete time step,
 $\varOmega _i$ represents the collision operator and
 $S_i$ is a source term proportional to the acting external forces
 $\boldsymbol {F}$ (such as membrane forces, see § 2.2) that is implemented following Guo, Zheng & Shi (Reference Guo, Zheng and Shi2002):
 \begin{equation} S_i(\boldsymbol{x},t)=\left(1-\frac{\Delta t}{2\tau}\right)\frac{w_i}{c_s^2}\left[\left(\frac{\boldsymbol{c}_i\boldsymbol{\cdot} \boldsymbol{u}}{c_s^2}+1\right)\boldsymbol{c}_i-\boldsymbol{u}\right]\boldsymbol{\cdot}\boldsymbol{F}, \end{equation}
Here,  $\tau$ is the relaxation time, i.e. the time the functions
 ${n}_i$ take to reach the equilibrium distribution
 ${n}_i^{({\tiny eq})}$ which is given by (Qian & Humières & Lallemand Reference Qian, d'Humières and Lallemand1992)
 \begin{equation} {n}_i^{({\tiny eq})}(\boldsymbol{x},t)= w_i\rho\left(1+\frac{\boldsymbol{u}\boldsymbol{\cdot}\boldsymbol{c}_i}{c_s^2}+\frac{(\boldsymbol{u} \boldsymbol{\cdot}\boldsymbol{c}_i)^2}{2c_s^4}-\frac{\boldsymbol{u}\boldsymbol{\cdot}\boldsymbol{u}}{c_s^2}\right), \end{equation}
with  $c_s=\Delta x/\Delta t\sqrt {3}$ being the speed of sound,
 $\Delta x$ the lattice spacing and
 $w_i$ suitable weights. In the D3Q19 scheme used in this work,
 $w_0=1/3$,
 $w_{1-6}=1/18$,
 $w_{7-18}=1/36$. We implement the Bhatnagar–Gross–Krook collision operator (Qian & Humières & Lallemand Reference Qian, d'Humières and Lallemand1992)
 \begin{equation} \varOmega_i={-}\frac{\Delta t}{\tau}({n}_i(\boldsymbol{x}, t) - {n}_i^{({\tiny eq})}(\boldsymbol{x}, t)). \end{equation}
The Chapman–Enskog analysis provides the bridge between the LB and the Navier–Stokes equations by linking the relaxation time  $\tau$ to the fluid transport coefficients, for example the dynamic viscosity
 \begin{equation} \mu= \rho c_s^2\left(\tau-\frac{\Delta t}{2}\right) . \end{equation}
The functions  ${n}_i$ are then used to compute the hydrodynamic density (
 $\rho$) and velocity (
 $\boldsymbol {u}$) fields of the fluid as
 \begin{equation} \rho(\boldsymbol{x}, t) = \sum_{i} {n}_i(\boldsymbol{x}, t) , \quad\rho\boldsymbol{u}(\boldsymbol{x}, t) = \sum_{i} \boldsymbol{c}_i {n}_i(\boldsymbol{x}, t) + \frac{\boldsymbol{F}\Delta t}{2} . \end{equation}
The coupling between the fluid and the viscoelastic membrane is accounted through the IB method. The membrane is represented by a set of Lagrangian nodes linked to build a three-dimensional (3-D) triangular mesh (see figure 1). The idea is to interpolate the fluid (Eulerian) velocity ( $\boldsymbol {u}$) to compute the nodal (Lagrangian) velocity (
 $\dot {\boldsymbol {r}}$) and to spread the nodal force (
 $\boldsymbol {\varphi }$) to find the force density acting on the fluid (
 $\boldsymbol {F}$). Such interpolations are given by the following equations (Peskin Reference Peskin2002; Krüger et al. Reference Krüger, Kusumaatmaja, Kuzmin, Shardt, Silva and Viggen2017):
 \begin{equation} \boldsymbol{F}(\boldsymbol{x},t) = \sum_i\boldsymbol{\varphi}_i(t)\varDelta(\boldsymbol{r}_i-\boldsymbol{x}) ,\quad \dot{\boldsymbol{r}}_i(t) = \sum_{\boldsymbol{x}} \boldsymbol{u}(\boldsymbol{x},t)\varDelta(\boldsymbol{r}_i-\boldsymbol{x})\Delta x^3, \end{equation}
where  $\varDelta$ is a discretised approximation of a Dirac delta function which can be factorised as the product of three interpolation stencils
 $\varDelta (\boldsymbol {x}) = \phi (x)\phi (y)\phi (z)/\Delta x^3$. In this work, we use the two-point interpolation stencil
 \begin{equation} \phi_2(x) =\begin{cases} 1 - |x| & \mbox{for } 0\leqslant |x|\leqslant 1 ,\\ 0 & \mbox{elsewhere} . \\ \end{cases} \end{equation}
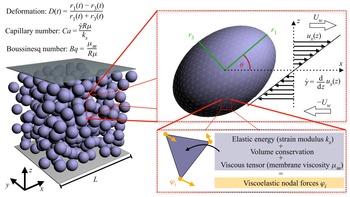
Sketch of the simulations performed in this work. Left side: 3-D cubic domain with  $L^3$ lattice nodes (Eulerian lattice) containing a dense suspension of viscoelastic spherical capsules with initial radius
 $R$. The domain is bound along the
 $z$-axis by two planar walls moving with constant speed
 $U_w$ in opposite directions. In this set-up, we impose a simple shear flow with constant shear rate
 $\dot {\gamma }$. Top-right box: detail of a single capsule deformed under a simple shear flow. The capsules are represented using 3-D triangular meshes with 2420 elements. The Taylor deformation
 $D$ is given by
 $D=(r_1-r_3)/(r_1+r_3)$, where
 $r_1$ and
 $r_3$ are the main semi-axes (green segments). The time evolution of the deformation
 $D(t)$ is used to evaluate the loading time
 $t_{{\tiny L}}$ (see (3.6)). The inclination angle
 $\theta$ is the angle that
 $r_1$ forms with the flow direction (
 $x$-axis). Bottom-right box: on each triangular element, the viscoelastic forces are computed and distributed to the vertices. These forces are coupled to the fluid via the immersed boundary (IB) method and the fluid dynamics is simulated using the lattice Boltzmann (LB) method (see § 2).

2.2. Membrane model
2.2.1. Elastic model
We use the Skalak model to account for the membrane elasticity (Skalak et al. Reference Skalak, Tozeren, Zarda and Chien1973). Here, the elastic free energy is given by
 \begin{equation} W_{{\scriptsize S}} = \sum_j A_j\left[ \frac{k_{{\scriptsize S}}}{12}(I_{1,j}^2+2I_{1,j}-2I_{2,j}) + \frac{k_{\scriptsize \alpha}}{12} I_{2,j}^2\right] , \end{equation}
where  $A_j$ is the area of the
 $j$th triangular element of the mesh,
 $k_{{\scriptsize S}}$ and
 $k_{\scriptsize \alpha }$ are the elastic shear and dilatational moduli (we restrict ourselves to
 $k_{\scriptsize \alpha } = k_{{\scriptsize S}}$), respectively,
 $I_{1,j} = \lambda _{1,j}^2+\lambda _{2,j}^2-2$ and
 $I_{2,j} = \lambda _{1,j}^2\lambda _{2,j}^2-1$ are the strain invariants for the
 $j$th triangular element, with
 $\lambda _{1,j}$ and
 $\lambda _{2,j}$ being the principal stretch ratios of the triangle (Skalak et al. Reference Skalak, Tozeren, Zarda and Chien1973; Krüger et al. Reference Krüger, Kaoui and Harting2014). The free energy
 $W_{{\scriptsize S}}^{(j)}$ computed on the
 $j$th element is used to compute the force on its three vertices: we can write the force acting on the
 $i$th node with coordinates
 $\boldsymbol {x}_i$ as
 \begin{equation} \boldsymbol{\varphi}_i ={-}\frac{\partial W_{{\scriptsize S}}^{(j)}}{\boldsymbol{x}_i} . \end{equation}
2.2.2. Viscous model
The membrane viscosity can be implemented through the incorporation of the viscous stress tensor given by
 \begin{equation} \pmb{\tau}_\nu = \mu_{{\scriptsize s}} \left(2\boldsymbol{e} -\mbox{tr}(\boldsymbol{e})\boldsymbol{P}\right) + \mu_{{\scriptsize d}} \,\mbox{tr}(\boldsymbol{e})\boldsymbol{P}=2\mu_{{\scriptsize m}}\boldsymbol{e}, \end{equation}
where  $\mu _{{\scriptsize s}}$ and
 $\mu _{{\scriptsize d}}$ are the shear and dilatational membrane viscosity, respectively (in order to reduce the number of parameters, we consider
 $\mu _{{\scriptsize s}}=\mu _{{\scriptsize d}}=\mu _{{\scriptsize m}}$, and we only refer to the membrane viscosity
 $\mu _{{\scriptsize m}}$ (Barthès-Biesel & Sgaier Reference Barthès-Biesel and Sgaier1985)),
 $\boldsymbol {P}$ is the projector tensor to the two-dimensional surface, and
 \begin{equation} \boldsymbol{e}
=\tfrac{1}{2}\left\{\boldsymbol{P}\boldsymbol{\cdot}[(\boldsymbol{\nabla}^{\boldsymbol{S}}\boldsymbol{u}^{\boldsymbol{S}})+(\boldsymbol{\nabla}^{\boldsymbol{S}}\boldsymbol{u}^{\boldsymbol{S}})^{{{\dagger}}}]\boldsymbol{\cdot}\boldsymbol{P}\right\}
\end{equation}
is the surface rate of strain. In (2.12), the superscript  $\boldsymbol {S}$ identifies the surface projection of the gradient operator (
 $\boldsymbol {\nabla }^{\boldsymbol {S}}$) and local membrane velocity (
 $\boldsymbol {u}^{\boldsymbol {S}}$) (Li & Zhang Reference Li and Zhang2019). By following Li & Zhang (Reference Li and Zhang2019), we employ the standard linear solid model to compute
 $\pmb {\tau }_\nu$. We evaluate the stress tensor
 $\boldsymbol {\tau }_\nu ^{(j)}$ on each triangular element
 $j$ (i.e. we rotate the triangular element on the
 $xy$-plane), and we then compute the force on its vertices
 $i$ as
 \begin{equation} \boldsymbol{\varphi}_i(x,y) = A_j\boldsymbol{\mathcal{P}}^{(j)}\boldsymbol{\cdot}\boldsymbol{\nabla}N_i , \end{equation}
where  $N_i(x,y)=a_ix+b_iy+c_i$ are the linear shape functions, the tensor
 $\boldsymbol {\mathcal {P}}^{(j)}=[\boldsymbol {\tau }_\nu \boldsymbol {\cdot }(\boldsymbol {\mathcal {F}}^{-1})^{\rm T}]^{(j)}$, with
 $(\boldsymbol {\mathcal {F}}^{-1})^{\rm T}$ being the transpose of the inverse of the deformation gradient tensor
 $\boldsymbol {\mathcal {F}}$ (Krüger Reference Krüger2012; Li & Zhang Reference Li and Zhang2019; Guglietta et al. Reference Guglietta, Behr, Biferale, Falcucci and Sbragaglia2020).
2.2.3. Volume conservation
In addition to the previous two contributions to the nodal force, we also impose the volume conservation by adding another term to the elastic free energy given in (2.9):
 \begin{equation} W_{{\scriptsize V}} = k_{\scriptsize V} \frac{(V-V_0)^2}{2V_0} . \end{equation}
Here  $k_{\scriptsize V}$ is an artificial modulus tuning the strength of the volume conservation and
 $V$ is the total volume of the capsule (the subscript
 $0$ refers to the volume at rest, i.e.
 $V_0=4{\rm \pi} R^3/3$) (Krüger Reference Krüger2012; Aouane et al. Reference Aouane, Scagliarini and Harting2021). The nodal force is then computed in the same way as for the elastic model (2.10).
2.2.4. Capsule–capsule repulsion
Finally, to avoid capsules penetrating each others, we introduce a force
 \begin{equation}
\boldsymbol{\varphi}_{ij} = \begin{cases}
\bar{\epsilon}\biggl[\left(\dfrac{\Delta
x}{d_{ij}}\right)^2-\left(\dfrac{\Delta
x}{\delta_0}\right)^2\biggr] \hat{\boldsymbol{d}}_{ij} &
\mbox{if } d_{ij}<\delta_0,\\[12pt] 0 & \mbox{if }
d_{ij}\geqslant\delta_0 , \end{cases}
\end{equation}
acting on nodes  $i$ and
 $j$ belonging to two different capsules, where
 $d_{ij}$ is the distance between nodes
 $i$ and
 $j$,
 $\hat {\boldsymbol {d}}_{ij}={\boldsymbol {d}_{ij}}/{d_{ij}}$ is the unit vector connecting them,
 $\delta _0$ is the interaction range and
 $\bar {\epsilon }\approx 100/3 k_{{\scriptsize S}}$. The choice of the parameter
 $\bar {\epsilon }$ is as such that the macroscopic behaviour of the suspension is not affected by this additional nodal force contribution (further details were provided by Aouane et al. Reference Aouane, Scagliarini and Harting2021).
2.3. Membrane geometry
The information on the geometry of the capsules is retrieved from the inertia tensor, which is defined by (Ramanujan & Pozrikidis Reference Ramanujan and Pozrikidis1998; Krüger Reference Krüger2012)
 \begin{equation} \mathcal{I}_{\alpha\beta} = \frac{\rho_p}{5}\sum_iA_i (\boldsymbol{r}_i^2\delta_{\alpha\beta}-r_{i\alpha}r_{i\beta})r_{i\gamma}n_{i\gamma} . \end{equation}
Here,  $\rho _p$ is the density of the particle (in our case,
 $\rho _p=1$),
 $\boldsymbol {r}_i$ is a vector pointing form the centre of mass of the capsule to the centroid of face
 $i$. We use
 $A_i$ and
 $\boldsymbol {n}_i$ to denote the area and the unit normal of the face
 $i$, respectively. We now consider the inertia ellipsoid, i.e. the equivalent ellipsoid with the same inertia tensor
 $\boldsymbol {\mathcal {I}}$. The three eigenvalues (
 $\mathcal {I}_1$,
 $\mathcal {I}_2$ and
 $\mathcal {I}_3$) can be used to compute the lengths of the three semi-axes of the ellipsoid with density
 $\rho _p$ and volume
 $V$ (Krüger Reference Krüger2012; Ramanujan & Pozrikidis Reference Ramanujan and Pozrikidis1998):
 $$\begin{gather} r_1 = \sqrt{\frac{5(\mathcal{I}_2+\mathcal{I}_3-\mathcal{I}_1)}{2\rho_p V}}, \end{gather}$$
 $$\begin{gather}r_2 = \sqrt{\frac{5(\mathcal{I}_1+\mathcal{I}_3-\mathcal{I}_2)}{2\rho_p V}} , \end{gather}$$
 $$\begin{gather}r_3 = \sqrt{\frac{5(\mathcal{I}_1+\mathcal{I}_2-\mathcal{I}_3)}{2\rho_p V}} , \end{gather}$$
with  $r_1\geqslant r_2 \geqslant r_3$. By comparing with figure 1,
 $r_1$ and
 $r_3$ are the longest and shortest radii in the shear plane (respectively), whereas
 $r_2$ is the radius directed along the vorticity direction (
 $y$-axis).
Once we know the length of the two main semi-axes  $r_1$ and
 $r_3$, we can evaluate the deformation index
 \begin{equation} D(t) = \frac{r_1(t)-r_3(t)}{r_1(t)+r_3(t)} , \end{equation}
which is equal to zero when the spherical capsule is not deformed (i.e.  $r_1=r_3$).
Finally, the inclination angle  $\theta$ (see figure 1) is the angle that the longest radius
 $r_1$ forms with the flow direction (
 $x$-axis).
3. Simulation set-up and physical parameters
The numerical set-up consists of a cubic Eulerian domain with  $L^3$ lattice nodes, where
 $L=128\,\Delta x$. The domain is bound along the
 $z$-axis by two planar walls at which we impose a constant velocity
 $U_w$ to generate a simple shear flow with constant shear rate
 $\dot {\gamma }$ (see figure 1). The viscoelastic capsules have an initial radius
 $R=8\,\Delta x$, and the corresponding mesh is made of 2420 triangular elements. Each capsule is initialised as a rigid sphere in order to start the simulation with zero stress and deformation of the surface. Furthermore, the distance between the surfaces of the capsules cannot be less than one lattice spacing.
Several dimensionless numbers may play a role in describing the dynamics of the system. First of all, the Reynolds number
 \begin{equation} \textit{Re}=\frac{\dot{\gamma} R^2\rho}{\mu} \end{equation}
gives the balance between inertial and viscous forces. We chose  $\textit {Re}$ small enough (
 $\textit {Re}\sim 10^{-2}$) to neglect inertial effects. The capillary number
 \begin{equation} \textit{Ca} = \frac{\dot{\gamma} R \mu}{k_s} \end{equation}
measures instead the importance of the viscosity of the fluid with respect to the elasticity of the membrane: we chose the range of  $\textit {Ca}$ in order to work as close as possible to the small-deformation regime, avoiding strongly nonlinear effects (
 $\textit {Ca}\in [0.05,1]$). In this paper, we have purposefully chosen to equate the elastic dilatational modulus (
 $k_{\scriptsize \alpha }$) and the elastic shear modulus (
 $k_{{\scriptsize S}}$). This decision has been made to decrease the complexity of parameters within our simulations, aligning with our primary aim of centring the study on the effects of surface viscosity. The dimensionless number accounting for the membrane viscosity
 $\mu _{{\scriptsize m}}$ is the Boussinesq number
 \begin{equation} \textit{Bq} = \frac{\mu_{{\scriptsize m}}}{\mu R} , \end{equation}
which describes the importance of the membrane viscosity with respect to the fluid viscosity (in this work, we consider the range  $\textit {Bq}\in [0,50]$). Note that
 $\mu _{{\scriptsize m}}$ describes the viscosity of a two-dimensional membrane: for this reason, it is measured in [m Pa s], while the fluid viscosity is given in [Pa s]. Finally, for dense suspensions, it is important to define the volume fraction
 \begin{equation} \phi = \frac{\displaystyle\sum\nolimits_iV_i}{L^3} , \end{equation}
which ranges in  $\phi \in [0.001,0.4]$ (i.e. from 1 to 400 capsules). In (3.4),
 $\sum _i V_i$ coincides with the total volume occupied by the viscoelastic spheres. The computational time is normalised with the capillary time as
 \begin{equation} t^* = \frac{R \mu}{k_s} . \end{equation}
Note that, in this work, the viscosity ratio is unity, meaning that the viscosity of the fluid inside the capsules is equivalent to that of the fluid outside. The main quantities mentioned above are also summarised in table 1.
Simulation parameters in lattice units.

We also briefly mention the roles played by the membrane viscosity and the internal fluid viscosity. Indeed, in order to simulate the effect of membrane viscosity, Keller & Skalak (Reference Keller and Skalak1982) were the first to propose an effective viscosity ratio that is the sum of the viscosity ratio  $\lambda$ and a term which accounts for the dissipation due to the membrane viscosity. However, some recent studies showed that while the qualitative effect of both kinds of viscosity is similar, they quantitatively show different behaviours (Guglietta et al. Reference Guglietta, Behr, Biferale, Falcucci and Sbragaglia2021a; Li & Zhang Reference Li and Zhang2021; Matteoli, Nicoud & Mendez Reference Matteoli, Nicoud and Mendez2021; Noguchi & Gompper Reference Noguchi and Gompper2005, Reference Noguchi and Gompper2007). We decided to keep the viscosity ratio
 $\lambda =1$ to focus on the effect of membrane viscosity only and avoid enlarging the already wide space of parameters.
Intending to study and quantify the transient deformation of viscoelastic capsules, we use the solution of a damped oscillator to describe the deformation behaviour as a function of the dimensionless time:
 \begin{equation} D_{{\tiny fit}}\Bigl(
\frac{t}{t^*}\Bigr)=\bar{D}\Bigl[1-\exp\Bigl(-\frac{t}{t^*t_{{\tiny
L}}}\Bigr)\cos{\Bigl(\omega \frac{t}{t^*}\Bigr)}\Bigr],
\end{equation}
where  $\bar {D}$ represents the steady-state value of the deformation,
 $t_{{\tiny L}}$ is the dimensionless loading time (i.e. the time the capsule takes to deform) and
 $\omega$ coincides with the dimensionless frequency of the deformation oscillations. To show how (3.6) fits data from numerical simulations, in figure 2 we report the measured deformation
 $D$ as a function of the dimensionless time
 $t/t^*$ for the single-capsule case. Different colours correspond to different values of
 $\textit {Bq}$, while all data refer to the case with
 $\textit {Ca}=0.2$. Figure 2 shows an excellent agreement between
 $D_{{\tiny fit}}(t)$ (solid lines) and the numerical simulations (circles), confirming that (3.6) is a suitable estimate for the dynamical observables
 $t_{{\tiny L}}$ and
 $\omega$.
Deformation of the single capsule ( $\phi =0.001$) as a function of
 $t/t^*$ for
 $\textit {Ca}=0.2$ and different values of the
 $\textit {Bq}$ (
 $\textit {Bq}=0$, 10, 25 and 50, from lighter to darker colours). The solid lines represent the best fit to (3.6).

Concerning the choice of making time dimensionless, there are mainly two choices: either using the shear rate  $\dot {\gamma }$ or the capillary time
 $t^*$ (Maffettone & Minale Reference Maffettone and Minale1998; Diaz et al. Reference Diaz, Pelekasis and Barthès-Biesel2000; Barthès-Biesel Reference Barthès-Biesel2016). In particular, Barthès-Biesel (Reference Barthès-Biesel2016) considered a capsule with membrane viscosity under simple shear flow, and they observed that the response (loading) time made dimensionless via the intrinsic time decreases with the capillary number. Moreover, Guglietta et al. (Reference Guglietta, Behr, Biferale, Falcucci and Sbragaglia2020, Reference Guglietta, Behr, Falcucci and Sbragaglia2021b) studied the transient dynamics of RBCs under simple shear flow and in order to compare their numerical results against experiments, they reported the characteristic loading and relaxation times (in
 $[{\rm s}]$ on the
 $y$-axis) as functions of the shear rate
 $\dot {\gamma }$ (in
 $[{\rm s}^{-1}]$ on the
 $x$-axis). We therefore decided to take this as an example, and to normalise both
 $x$- and
 $y$-axis with the capillary time
 $t^*$, thus obtaining the dimensionless loading time
 $t_L$ as a function of the capillary number
 $\textit {Ca}$.
4. Results
In this section, we show the numerical results concerning the deformation  $D$ and the loading time
 $t_{{\tiny L}}$ of both a single spherical capsule (§ 4.1) and a suspension of particles (§ 4.2).
4.1. Single capsule
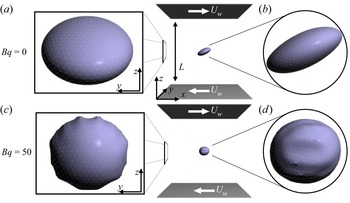
In this section, we report the numerical results for the deformation and loading time of a single capsule ( $\phi =0.001$) under shear flow, which will serve as a reference for the next section, where suspensions of capsules are considered. Figure 3 shows the steady-state configuration of a capsule under shear flow with
 $\textit {Ca}=0.5$, for two values of the
 $\textit {Bq}$ (
 $\textit {Bq}=0$, a,b;
 $\textit {Bq}=50$, c,d). The capsule is initialised in the middle of the channel; white arrows represent the velocity of the walls
 $\boldsymbol {U}_{{\scriptsize w}}$. The left and right parts of figure 3 show side views in the
 $yz$- and
 $xz$-plane, respectively. Figure 3 shows that some wrinkles appear on the surface when
 $\textit {Bq}$ increases. These results agree with what was observed by Yazdani & Bagchi (Reference Yazdani and Bagchi2013). It should be noted that the introduction of a bending energy into the membrane model can potentially inhibit the emergence of these wrinkles, as discussed in detail in Yazdani & Bagchi (Reference Yazdani and Bagchi2013). In the case of a purely elastic capsule (
 $\textit {Bq}=0$), no wrinkles appear if the capillary number is large enough (
 $\textit {Ca}\gtrapprox 0.1$), but some of them do appear when the capillary number is small (
 $\textit {Ca}=0.05$). We emphasise that these wrinkles are not a numerical artefact, as they have also been observed in experiments (Walter et al. Reference Walter, Rehage and Leonhard2001; Unverfehrt, Koleva & Rehage Reference Unverfehrt, Koleva and Rehage2015) and studied analytically (Finken & Seifert Reference Finken and Seifert2006).
Steady-state configurations for a single capsule ( $\phi =0.001$) under shear flow with
 $\textit {Ca}=0.5$. (a,b) Single capsule configuration with
 $\textit {Bq}=0$. (c,d) Single capsule configuration with
 $\textit {Bq}=50$. (a,c) Side view in the
 $yz$-plane. (b,d) Side view in the
 $xz$-plane.

In figure 4(a), we show the steady-state value of the deformation  $\bar {D}$ as a function of the capillary number
 $\textit {Ca}$ for different values of
 $\textit {Bq}$ (the darker the colour, the higher the value of
 $\textit {Bq}$). We also report results from Aouane et al. (Reference Aouane, Scagliarini and Harting2021) (black crosses), as a benchmark of our implementation, which corresponds to a case without membrane viscosity.
Data corresponding to the single-capsule case ( $\phi =0.001$) for different values of the
 $\textit {Bq}$ (
 $\textit {Bq}=0$, 10, 25 and 50, from lighter to darker colours). (a) Steady-state deformation
 $\bar {D}$ as a function of the capillary number
 $\textit {Ca}$, where black crosses represent data from Aouane et al. (Reference Aouane, Scagliarini and Harting2021). (b) Inclination angle
 $\theta$ as a function of the capillary number
 $\textit {Ca}$. (c) Loading time
 $t_{{\tiny L}}$ as a function of the capillary number
 $\textit {Ca}$. (d) Frequency
 $\omega$ as a function of the capillary number
 $\textit {Ca}$.

Figure 4(a) shows that the effect of increasing  $\textit {Bq}$ is to decrease the deformation, a trend that has been previously observed in other works (Yazdani & Bagchi Reference Yazdani and Bagchi2013; Li & Zhang Reference Li and Zhang2019; Guglietta et al. Reference Guglietta, Behr, Biferale, Falcucci and Sbragaglia2020, Reference Guglietta, Behr, Falcucci and Sbragaglia2021b). This can be explained by an energetic argument: for a fixed value of the elastic modulus
 $k_{{\scriptsize S}}$ and a given intensity of the shear rate
 $\dot {\gamma }$ (i.e. for the same value of the capillary number
 $\textit {Ca}$), the energy injected into the system is the same. However, the simple shear flow can be split into two contributions, accounting for the rotation and the elongation of the capsule, respectively:
 \begin{equation} \boldsymbol{\nabla}\boldsymbol{u} = \left(\begin{matrix} 0 & \dot{\gamma} \\ 0 & 0 \end{matrix}\right)= \left(\begin{matrix} 0 & \dfrac{\dot{\gamma}}{2} \\[10pt] \dfrac{\dot{\gamma}}{2} & 0 \end{matrix}\right) + \left(\begin{matrix} 0 & \dfrac{\dot{\gamma}}{2} \\[10pt] -\dfrac{\dot{\gamma}}{2} & 0 \end{matrix}\right). \end{equation}
This means that the energy injected by the applied shear flow not only contributes to the deformation of the capsules but also to their rotation. Therefore, increasing the value of the membrane viscosity leads to an increase in the dissipative effects on the surface due to viscous friction, which in turn reduces the energy available for deformation. If one deforms the capsule without using a flow but via external forces acting directly on the membrane (such as the typical stretching experiment performed on RBCs by using optical tweezers (Suresh et al. Reference Suresh, Spatz, Mills, Micoulet, Dao, Lim, Beil and Seufferlein2005)), the dependence of the steady-state value of the deformation on the membrane viscosity clearly disappears (Guglietta et al. Reference Guglietta, Behr, Biferale, Falcucci and Sbragaglia2020, Reference Guglietta, Behr, Falcucci and Sbragaglia2021b). In addition, in an elongational flow, where the rotation of the membrane is suppressed, the steady-state value of the deformation does not depend on the value of  $\textit {Bq}$ (Guglietta et al. Reference Guglietta, Behr, Falcucci and Sbragaglia2021b).
The steady-state values of the inclination angle  $\theta$ are reported in figure 4(b). As expected, in the absence of membrane viscosity (
 $\textit {Bq}=0$), the inclination angle
 $\theta$ diminishes as a function of the capillary number, which is in good agreement with the results of Aouane et al. (Reference Aouane, Scagliarini and Harting2021). Upon introducing membrane viscosity, the inclination angle decreases, and intriguingly, exhibits a non-monotonic behaviour when
 $\textit {Bq}=50$.
Figure 4(c) shows that the loading time  $t_{{\tiny L}}$ depends on both
 $\textit {Ca}$ and
 $\textit {Bq}$. In particular, on the one hand, it decreases when
 $\textit {Ca}$ increases, and seems to converge to a constant value. On the other hand, the increase of
 $t_{{\tiny L}}$ when the membrane viscosity increases is expected because of the viscous dissipation at the interface. The loading time
 $t_{{\tiny L}}$ depends on
 $\textit {Bq}$ even when we apply an elongational flow or perform a stretching experiment (Guglietta et al. Reference Guglietta, Behr, Falcucci and Sbragaglia2021b). This behaviour is opposite to that of the steady-state deformation value, which does not show such a dependence when only the membrane deformation is present.
Figure 4(d) depicts the frequency of the deformation oscillations  $\omega$. It does not show a strong dependence on the membrane viscosity but only on the capillary number
 $\textit {Ca}$. This means that this characteristic time simply scales with the characteristic time of the flow,
 $\dot {\gamma }^{-1}$. The results for
 $t_{{\tiny L}}$ and
 $\omega$ are in qualitative agreement with results for a single RBC in simple shear flow (Guglietta et al. Reference Guglietta, Behr, Falcucci and Sbragaglia2021b).
In the literature, oscillations of the deformation have already been observed (Yazdani & Bagchi Reference Yazdani and Bagchi2013; Li & Zhang Reference Li and Zhang2019) and also analytically predicted (Barthès-Biesel & Sgaier Reference Barthès-Biesel and Sgaier1985). It is worth noticing that also droplets under simple shear flow exhibit such oscillations (Gounley et al. Reference Gounley, Boedec, Jaeger and Leonetti2016), meaning that they are not strictly related to the kind of the interface energy nor the presence of wrinkles, since in that case surface tension acts and prevents any wrinkle appearing at the interface. Indeed, as explained by Gounley et al. (Reference Gounley, Boedec, Jaeger and Leonetti2016), these oscillations appear when the flow time scale and the relaxation time scale differ significantly.
We also looked at the time evolution of the  $xz$-component of the particle stress
 $\varSigma ^p_{xz}$ given by the sum of the elastic and viscous contribution (
 $\varSigma ^e_{xz}$ and
 $\varSigma ^\nu _{xz}$, respectively), with the idea of bridging the micro- and macro-rheology by relating the loading time
 $t_{{\tiny L}}$ to the characteristic time that the stress takes to reach the steady-state value (see figure 5). When there is no membrane viscosity (
 $\textit {Bq}=0$), the particle stress is completely given by the elastic contribution; when
 $\textit {Bq}>0$, it is mainly dominated by the viscous contribution. Since
 $\varSigma ^\nu _{xz}$ depends on the velocity gradient on the surface (see (2.11)), it suddenly increases as soon as the shear flow starts, thus reducing the characteristic time of
 $\varSigma ^p_{xz}$ almost to zero. This behaviour goes in the opposite direction with respect to what we observe for the loading time
 $t_{{\tiny L}}$, which is related to the deformation.
Time evolution of the  $xz$-components of the particle stress
 $\varSigma ^p_{xz}$ for a single capsule, for
 $Bq=0$ (orange lines) and
 $Bq=50$ (black lines). Dotted and dash-dotted lines represent the
 $xz$-component of the elastic (
 $\varSigma ^e_{xz}$) and viscous (
 $\varSigma ^v_{xz}$) contributions of the stress, respectively; solid lines represent the particle stress
 $\varSigma ^p_{xz} =(\varSigma ^e+\varSigma ^v)_{xz}$.

Since the deformation as defined in (2.20) only contains information about the main axes in the shear plane, it does not provide a complete description of how the capsule is deforming in 3-D space. Therefore, we examined the three main radii  $r_1$,
 $r_2$ and
 $r_3$ separately (figure 6(a–c), respectively). The radii are normalised by the initial radius
 $R$, which is the capsule's radius at rest. In all three cases, the variation in the length of the radii
 $r_i$ (
 $i=1,2,3$) relative to their values at rest decrease as the membrane viscosity increases (as expected based on the measurements of the deformation). However, the most significant variation is seen in
 $r_1$ and
 $r_3$ (i.e. in the shear plane), whereas
 $r_2$ changes only slightly when
 $\textit {Bq}=0$ and is almost unchanged for
 $\textit {Bq}=50$.
Three main radii of the single capsule ( $\phi =0.001$) as a function of
 $\textit {Ca}$, for different values of
 $\textit {Bq}$ (
 $\textit {Bq}=0$, 10, 25 and 50, from lighter to darker colours),
normalised to the capsule radius at rest,
 $R$.

4.2. Suspensions
We consider the same numerical set-up as before, but now we increase the number of capsules  $N$ up to 400, corresponding to an increase of the volume fraction
 $\phi$ up to 0.4. We introduce the capsule-averaged quantities represented by
 \begin{equation} \langle A \rangle = \frac{1}{N}\sum_i A_i , \end{equation}
where the sum runs over the number of particles  $N$ and
 $A_i$ is a general observable measured for the
 $i$th capsule (such as the steady-state value of the deformation
 $\bar {D}$, the loading time
 $t_{{\tiny L}}$ and the radius
 $r_i$). The data reported in this section are provided with error bars, which are calculated from the standard deviation normalised with
 $\sqrt {N}$.
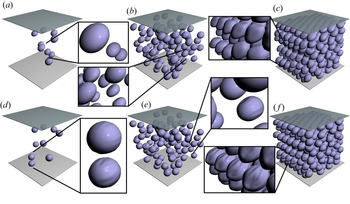
Figure 7 shows some steady-state configurations for three different values of  $\phi$ (columns) and two values of
 $\textit {Bq}$ (rows). Data refer to
 $\textit {Ca}=0.1$. It is interesting to observe that wrinkles do not appear on the surface when
 $\textit {Bq}=0$, whereas they are visible for
 $\textit {Bq}=50$. However, in the latter case, the volume fraction seems to play a role: indeed, while the cases with
 $\phi =0.01$ and
 $\phi =0.1$ show just a few particles with small wrinkles (panels (d,e), respectively), the most-dense case (panel f) shows more pronounced wrinkles on more particles.
Snapshots of the suspensions. The configurations shown correspond to  $\textit {Ca}=0.1$ and: (a)
 $\phi =0.01$,
 $Bq=0$; (b)
 $\phi =0.1$,
 $Bq=0$; (c)
 $\phi =0.04$,
 $Bq=0$; (d)
 $\phi =0.01$,
 $Bq=50$; (e)
 $\phi =0.1$,
 $Bq=50$;(f)
 $\phi =0.4$,
 $Bq=50$.

We want to study the transient dynamics of the system and compare results for different values of the volume fraction  $\phi$. To make the comparison as fair as possible, we initialise the system without membrane pre-stress also for the dense case, since that is the case for the dilute suspensions. To reach high volume fractions (
 $\phi >0.1$) without deforming the capsules, we initialised the system in an fcc crystal configuration (see figure 7c,f).
Before analysing the same quantities studied in the single-particle case, we investigate the rheological properties of the suspension. We consider the  $xz$-component of the stress of the capsule
 $\varSigma _{xz}^p$ and its elastic and viscous components (
 $\varSigma _{xz}^e$ and
 $\varSigma _{xz}^\nu$, respectively). In figure 8, we report the relative viscosity
 $\mu _{{\scriptsize r}} ={\mu _s}/{\mu } =1 + {\varSigma _{xz}^p}/{\dot {\gamma }\mu }$, where
 $\mu _s$ is the effective viscosity of the suspension. For very dilute suspensions, (
 $\phi = 0.01$) the relative viscosity
 $\mu _{{\scriptsize r}}\approx 1$. Upon increasing the volume fraction
 $\phi$, we observe an expected increase in
 $\mu _{{\scriptsize r}}$. In figure 8(a), we report the
 $\mu _{{\scriptsize r}}$ as a function of the capillary number
 $\textit {Ca}$, for different values of
 $\textit {Bq}$. For the sake of clarity, we report only data for
 $\phi =0.1$ and
 $\phi =0.4$. In both cases, we observe an increase of the relative viscosity with
 $\textit {Bq}$. To better appreciate this dependency in the
 $\phi =0.1$ case, this is magnified in the inset, showing that the shear-thinning behaviour is present regardless of the value of
 $\textit {Bq}$, but is more pronounced for
 $\textit {Bq}=50$. In figure 8(b), we report
 $\mu _{{\scriptsize r}}$ as a function of the volume fraction
 $\phi$ for different values of
 $\textit {Bq}$. Again, to improve the readability of the plot, we selected data for the highest value of capillary number only,
 $\textit {Ca}=1$. We also report the theoretical predictions of
 $\mu _{{\scriptsize r}}(\phi )$ according to Einstein (Reference Einstein1906) (
 $\mu _{{\scriptsize r}}=1+\frac {5}{2}\phi$, solid black line) and Batchelor & Green (Reference Batchelor and Green1972) (
 $\mu _{{\scriptsize r}}=1+\frac {5}{2}\phi +5.2\phi ^2$, dashed black line), which hold for suspensions of hard spheres in the dilute and semi-dilute approximations, respectively. It is worth noting that the cases with small values of
 $\textit {Bq}$ differ from the prediction computed by Batchelor & Green (Reference Batchelor and Green1972), but still show a quadratic behaviour, whereas the data for high values of
 $\textit {Bq}$ are closer to values predicted by the theory for hard spheres. The reason may be that a high membrane viscosity reduces the deformation of the capsule, making them a better approximation of hard spheres, at least from a geometrical point of view. The change in relative viscosity calls for a redefinition of the capillary number. When
 $\phi$ increases, the viscosity of the suspension increases too (as shown in figure 8). Therefore, we introduce the effective capillary number
 $\textit {Ca}_{{\scriptsize eff}}$, which accounts for the viscosity of the suspension
 $\mu _s$:
 \begin{equation} \textit{Ca}_{{\scriptsize eff}} = \frac{\dot{\gamma} R \mu_s}{k_s}= \textit{Ca}\, \mu_{{\scriptsize r}} . \end{equation}
(a) Plot of  $\mu _r$ as a function of
 $\textit {Ca}$ for different values of
 $\textit {Bq}$ and
 $\phi =0.1$ and
 $0.4$. The inset shows magnified region around the
 $\phi =0.1$ data. (b) Plot of
 $\mu _r$ as a function of
 $\phi$ for different values of
 $\textit {Bq}$ and
 $\textit {Ca}=1$. The solid and dashed lines are the theoretical predictions of Einstein (Reference Einstein1906) and Batchelor & Green (Reference Batchelor and Green1972), respectively.

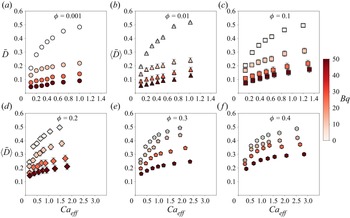
In figure 9, the capsule-averaged steady-state deformation is reported as a function of the  $\textit {Ca}_{{\scriptsize eff}}$ for different values of
 $\textit {Bq}$ and
 $\phi$. The data for the single capsule (
 $\phi =0.001$) are also reported for comparison (figure 9a). As already observed for elastic capsules in the absence of membrane viscosity, our data shows that the capsule-averaged steady-state deformation
 $\langle \bar {D}\rangle$ slightly increases with increasing
 $\phi$ (Aouane et al. Reference Aouane, Scagliarini and Harting2021). It is interesting to compare panels (a) and (f), which are the two extreme cases we simulated (i.e.
 $\phi =0.001$ and
 $0.4$, respectively). We observe that in absence of membrane viscosity (
 $\textit {Bq}=0$),
 $\langle \bar {D}\rangle (\phi =0.4)$ is about 5–10 % higher than
 $\langle \bar {D}\rangle (\phi =0.001)$, whereas when
 $\textit {Bq}=50$, there is an increase of about 250 %. This suggests a weaker effect of the membrane viscosity in reducing the deformation for higher values of
 $\phi$. This general trend can be observed in figure 9 for all the reported values of
 $\phi$. We note that
 $\langle \bar {D}\rangle$ increases when
 $\phi$ increases (from panel a to panel f) at
 $\textit {Bq}=50$, but this difference in
 $\langle \bar {D}\rangle$ shrinks when
 $\textit {Bq}$ is smaller.
Capsule-averaged steady-state deformation  $\langle \bar {D}\rangle$ (see (3.6)) as a function of
 $\textit {Ca}_{{\scriptsize eff}}$ for different values of
 $\phi$ (a,
 $\phi = 0.001$; b,
 $\phi = 0.01$; c,
 $\phi = 0.1$; d,
 $\phi = 0.2$; e,
 $\phi = 0.3$; f,
 $\phi = 0.4$) and
 $\textit {Bq}$ (
 $\textit {Bq}=0$, 10, 25 and 50, from lighter to darker colours).

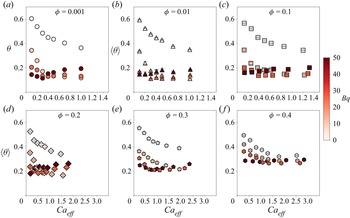
The values of the inclination angle  $\theta$ as a function of
 $\textit {Ca}_{{\scriptsize eff}}$ are reported in figure 10. For volume fraction up to
 $\phi =0.3$, the results are very similar to the single-capsule case, with a slight increase for
 $\textit {Bq}\ne 0$. However, in the most-dense case simulated, the inclination angle is slightly reduced (with respect to the single-capsule case) in the absence of membrane viscosity, while it is increased in the other cases. It is interesting to note the collapse of
 $\theta$ for high values the effective capillary number,
 $\textit {Ca}_{{\scriptsize eff}}>1.5$.
Capsule-averaged steady-state inclination angle  $\langle \bar {\theta }\rangle$ as a function of
 $\textit {Ca}_{{\scriptsize eff}}$ for different values of
 $\phi$ (a,
 $\phi = 0.001$; b,
 $\phi = 0.01$; c,
 $\phi = 0.1$; d,
 $\phi = 0.2$; e,
 $\phi = 0.3$; f,
 $\phi = 0.4$) and
 $\textit {Bq}$ (
 $\textit {Bq}=0$, 10, 25 and 50, from lighter to darker colours).

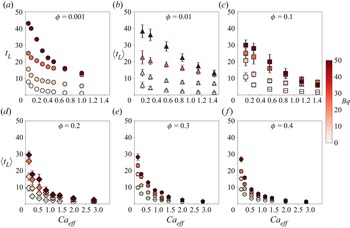
Regarding the capsule-averaged loading time  $\langle t _{{\tiny L}}\rangle$, depicted in figure 11, we observe again that the volume fraction
 $\phi$ mitigates the effect of the presence of the membrane viscosity, especially at increasing values of the capillary number. In fact, the apparent increase of
 $\langle t _{{\tiny L}}\rangle$ with
 $\textit {Bq}$ for
 $\phi \leqslant 0.01$ (panels a–c) is not present for higher values of
 $\phi$ (panels d–f). Furthermore, it is worth noting that
 $\langle t _{{\tiny L}}\rangle$ shows a slight dependence on the volume fraction
 $\phi$ for
 $\textit {Bq}=0$, and the
 $\phi =0.001$ and
 $\phi =0.4$ data superpose almost perfectly. The dependence of
 $\langle t _{{\tiny L}}\rangle$ on
 $\phi$ and
 $\textit {Bq}$ is even more evident for small values of the capillary number
 $\textit {Ca}$ (close to the linear response), i.e. when focusing on the intrinsic properties of the membrane: for the volume fraction
 $\phi \geqslant 0.1$,
 $\langle t _{{\tiny L}}\rangle$ still shows a dependence on
 $\textit {Bq}$, but if the capillary number
 $\textit {Ca}$ increases, the data tend to collapse on the same curve. This means that, for suspensions with a concentration
 $\phi \geqslant 0.1$ and for high values of the effective capillary number
 $\textit {Ca}_{{\scriptsize eff}}$, the effect of membrane viscosity almost disappears. The origin of the reduction of the effect of membrane viscosity with volume fraction increase can be traced to the viscous tensor defined in (2.11): while the elastic contribution depends only on the geometry (i.e. the deformation) of the capsule, the viscous tensor depends only on the surface velocity gradient
 $\boldsymbol {\nabla }^{\boldsymbol {S}}\boldsymbol {u}^{\boldsymbol {S}}$. Therefore, when the volume fraction
 $\phi$ increases, the strain tensor
 $\boldsymbol {e}$ (see (2.12)) decreases, and the effect of the membrane viscosity becomes smaller. In figure 12, we report the ratio
 $\varSigma ^v_{xz}/\varSigma ^p_{xz}$ as a function of the capillary number
 $\textit {Ca}$ for two values of volume fraction (
 $\phi =0.1$ and
 $\phi =0.4$) and for two values of
 $\textit {Bq}$ (
 $\textit {Bq}=25$ and
 $\textit {Bq}=50$). We observe a reduction of the contribution given by
 $\varSigma ^v_{xz}$ when the volume fraction increases, while for dilute suspensions the ratio
 $\varSigma ^v_{xz}/\varSigma ^p_{xz}$ is close to 1. This suggests that, when the volume fraction increases, the viscous dissipation reduces and the energy left contributes to the elastic deformation.
Capsule-averaged loading time  $\langle t _{{\tiny L}}\rangle$ (see (3.6)) as a function of
 $\textit {Ca}_{{\scriptsize eff}}$ for different values of
 $\phi$ (a,
 $\phi = 0.001$; b,
 $\phi = 0.01$; c,
 $\phi = 0.1$; d,
 $\phi = 0.2$; e,
 $\phi = 0.3$; f,
 $\phi = 0.4$) and
 $\textit {Bq}$ (
 $\textit {Bq}=0$, 10, 25 and 50, from lighter to darker colours).

Steady-state values of the ratio of the viscous contribution of the particle stress ( $\varSigma ^v_{xz}$) to the total stress of the particle (
 $\varSigma ^p_{xz}=(\varSigma ^v+\varSigma ^e)_{xz}$) for
 $\textit {Bq}=25$ and
 $\textit {Bq}=50$.

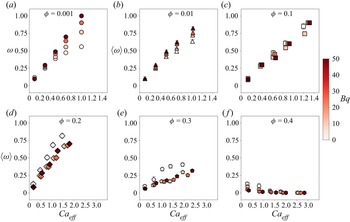
Concerning the capsule-averaged frequency of the oscillations  $\omega$, we observe that there is a weak dependence on
 $\textit {Bq}$ for volume fractions up to
 $\phi =0.1$ (see figure 13a–c); however, for
 $\phi >0.1$ (figure 13d–f), the oscillations of the deformation disappear, and therefore
 $\omega$ goes to zero at large
 $\textit {Ca}_{{\scriptsize eff}}$. This may be due to the collisions (i.e. strong capsule–capsule interactions) that do not allow the deformation of the capsules to oscillate freely. We also looked at the deformation of some capsules for the most-dense case simulated (
 $\phi =0.4$) and we observed that the deformation shows small and noisy fluctuations around the average: again, these oscillations can be attributed to the capsule–capsule collisions. By looking at the deformation for some capsules in the suspensions, we also checked that the behaviour of the capsule-averaged deformation well reflects that of the single capsules, meaning (3.6) is still good at estimating
 $t_{{\tiny L}}$ and
 $\omega$. To further confirm the goodness of the fitting procedure, the reader can look at the error bars reported in figures 9–11.
Capsule-averaged frequency  $\langle \omega \rangle$ (see (3.6)) as a function of
 $\textit {Ca}_{{\scriptsize eff}}$ for different values of
 $\phi$ (a,
 $\phi = 0.001$; b,
 $\phi = 0.01$; c,
 $\phi = 0.1$; d,
 $\phi = 0.2$; e,
 $\phi = 0.3$; f,
 $\phi = 0.4$) and
 $\textit {Bq}$ (
 $\textit {Bq}=0$, 10, 25 and 50, from lighter to darker colours).

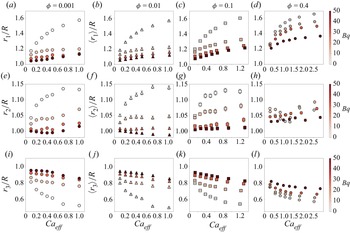
As presented in the previous section for the single capsule, in figure 14 we show the capsule-averaged values of the normalised radii  $\langle r_1\rangle /R$,
 $\langle r_2\rangle /R$ and
 $\langle r_3\rangle /R$ (a–d, e–h and i–l, respectively). We observe that, at a given value of the volume fraction, the membrane viscosity clearly reduces the deformation of the three radii. The effect of the volume fraction becomes important for
 $\phi >0.1$, that is, when capsules start to interact with each other. Even when the volume fraction increases, most of the deformation occurs in the shear plane (i.e.
 $r_2$ is less affected than
 $r_1$ and
 $r_3$). The effect of the volume fraction becomes prominent for
 $\phi >0.1$: indeed, for all the values of
 $\textit {Bq}$ we have simulated, when
 $\phi =0.4$ the radii
 $r_1$ and
 $r_3$ (d and l) are different if compared with the cases
 $\phi \leqslant 0.1$. This might be due to the strong capsule–capsule interaction when
 $\phi =0.4$, confirming again that the effect of membrane viscosity reduces for high values of the volume fraction. Concerning the deformation in the vorticity direction,
 $r_2$, it is
 ${\sim }10\,\%$ for
 $\textit {Bq}=0$ and
 ${\lesssim }5\,\%$ for
 $\textit {Bq}>0$. While
 $r_2$ shows a clear hierarchy in
 $\textit {Bq}$ for
 $\phi <0.4$, a more complex behaviour appears when
 $\phi =0.4$. However, we are facing very small deformations (less than
 $5\,\%$), which means that the length of
 $r_2$ changes by about
 $0.4\Delta x$. We conclude that the deformation in the vorticity direction is in general small, especially when we increase the volume fraction. To provide a more quantitative and precise investigation for the behaviour of
 $r_2$, one should perform simulations with larger capsules (and therefore with a more resolved mesh); however, such a detailed study on the deformation in the vorticity direction goes beyond the scope of this work.
The capsule-averaged lengths of the three main radii of the capsule  $\langle r_1\rangle$ (a–d),
 $\langle r_2\rangle$ (e–h) and
 $\langle r_3\rangle$ (i–l), normalised with the radius of the spherical capsule at rest,
 $R$, as functions of
 $\textit {Ca}_{{\scriptsize eff}}$ for different values of
 $\phi$ (a,e,i,
 $\phi = 0.001$; b,f,j,
 $\phi = 0.01$; c,g,k,
 $\phi = 0.1$; d,h,l,
 $\phi = 0.4$) and
 $\textit {Bq}$ (
 $\textit {Bq}=0$, 10, 25 and 50, from lighter to darker colours).

5. Conclusions
In this study, we have performed a parametric investigation of the impact of membrane viscosity on the transient dynamics of suspensions of viscoelastic spherical capsules for different values of the volume fraction  $\phi$. To achieve this, we have performed numerical simulations using the IB-LB method. Our results indicate that the effect of membrane viscosity, as measured by the dimensionless Boussinesq number
 $\textit {Bq}$, strongly impacts the dynamics of a single capsule. However, this effect is diminished as the volume fraction
 $\phi$ increases. The comparison between the single-capsule case (
 $\phi =0.001$) and the most-dense case simulated (
 $\phi =0.4$) revealed that although the capsule-averaged deformation
 $\langle \bar {D}\rangle$ is greatly affected by the presence of membrane viscosity, the capsule-averaged loading time
 $t_{{\tiny L}}$ does not show a strong dependence on
 $\textit {Bq}$ when
 $\phi =0.4$. We can therefore conclude that, for the flow conditions simulated in this work (i.e.
 $\textit {Re}\sim 0.01$ and
 $\textit {Ca}\in [0.05,1]$, as outlined in table 1), the membrane viscosity does not significantly affect the characteristic time when the volume fraction is high enough, but it still has a substantial impact on the deformation.
In the future it will be valuable to investigate the dynamics of both dilute and dense suspensions flowing through small channels. The interaction between membrane viscosity and confinement is yet to be studied in this context. In addition, it would be of interest to study the effect of membrane viscosity on different geometries and membrane models, with a focus on RBCs as an example.
Funding
This work has received financial support from the Deutsche Forschungsgemeinschaft (DFG, German Research Foundation) – Project-ID 431791331 – SFB 1452 ‘Catalysis at liquid interfaces’ and research unit FOR2688 ‘Instabilities, Bifurcations and Migration in Pulsatile Flows’ (Project-ID 417989464). This work was supported by the Italian Ministry of University and Research (MUR) under the FARE programme, project ‘Smart-HEART’. The authors gratefully acknowledge the Gauss Centre for Supercomputing e.V. (www.gauss-centre.eu) for funding this project by providing computing time through the John von Neumann Institute for Computing (NIC) on the GCS Supercomputer JUWELS (Jülich Supercomputing Centre 2019) at Jülich Supercomputing Centre (JSC).
Declaration of interests
The authors report no conflict of interest.