1. Introduction
This paper addresses the question of how deforestation is influenced by the economic growth of municipalities located in one of the richest, most complex and important ecosystems for the functioning of the planet. The economic literature indicates that intensive agricultural activities in the use of natural resources play a significant role in deforestation. This phenomenon prompts various discussions about the advancement of agricultural frontiers in developing countries, such as Brazil. In this context, it is questioned whether the hypothesis of sustainable equilibrium specifically applies to agricultural activities (Danfeng, Dawson and Baoguo, Reference Danfeng, Dawson and Baoguo2006; Ibáñez et al., Reference Ibáñez, Martínez and Schnabel2007; Garnett, Reference Garnett2009; Taheripour and Tyner, Reference Taheripour and Tyner2013; Caro et al., Reference Caro, Davis, Bastianoni and Caldeira2014; Slade, Reference Slade2018; Marques et al., Reference Marques, Teixeira, Sousa, Morais, Teixeira and Domingos2020; Hong et al., Reference Hong, Burney, Pongratz, Nabel, Mueller, Jackson and Davis2021).
Since the formalisation of the environmental approach of the Kuznets hypothesis (Grossman and Krueger, Reference Grossman and Krueger1991), the idea of a turning point in the relationship between growth and deforestation has been empirically tested in various economies. The results vary depending on the economy studied and the method employed for hypothesis testing. For example, a minimum point was identified by Hill and Magnani Reference Hill and Magnani(2002), while Shafik (Reference Shafik1994), Holtz-Eakin and Selden (Reference Holtz-Eakin and Selden1995), Al-Mulali et al. (Reference Al-Mulali and Ozturk2015) and Nasir et al. Reference Nasir, Huynh and Tram(2019) observed a positive linear relationship. On the other hand, Roberts and Grimes Reference Roberts and Grimes(1997) found mixed and inconclusive results for this relationship.
Additionally, Sirag et al. Reference Sirag, Matemilola, Law and Bany-Ariffin(2018) suggested a further assumption for the relationship proposed in the environmental hypothesis of Kuznets. According to this assumption, in addition to the potential existence of a turning point, there could be a level of economic growth capable of causing a break in how growth impacts deforestation. If this assumption is validated, then the EKC would transition from a continuous linear relationship to a discontinuous nonlinear relationship.
Based on these considerations, the main objective of this study is to test the null hypothesis that there are no significant differences in the relationship between economic growth and deforestation as the productivity of agriculture and livestock increases. For this purpose, we direct the study to a portion of Brazilian territory known as the Legal Amazon.Footnote 1 We use this territory as the subject of the study because the Legal Amazon contains the vast majority of Brazil’s environmental preservation areas and is the location where most governmental efforts to develop activities to contain deforestation are concentrated, while the region experiences an expansion of agricultural activities.
This investigation contributes to exploring the interaction between economic growth and deforestation from a distinctive theoretical perspective and pinpoints the growth phases during which enhancements in production prompt significant environmental transformations. Additionally, it extends the discussion concerning growth-environment relationships for emerging economic sectors in the Brazilian Amazon.
The results indicated that the null hypothesis of the study, as well as the “inverted U” functional form proposed in the EKC, should be rejected for the agriculture and livestock of the Brazilian Legal Amazon, since the relationship between growth and deforestation obtained in the research was negative. In other words, we conclude that the growth of agricultural activities in the Legal Amazon can occursimultaneously as the levels of deforestation decrease.
In addition to this introduction, in the second section, we present the methodology, explaining the area studied, the data and the estimation strategy used in the EKC. In the third section, we discuss the results obtained, and finally, we describe the conclusions.
2. Methodology
2.1. Study area
This work is specifically directed to the region known as the Brazilian Legal Amazon. According to IBGE (2022a), this territory encompasses approximately 5.2 million square kilometres, covering the entire area of the Legal Amazon, along with 20 per cent of the Cerrado Biome area and part of the Pantanal Mato-Grossense. The territorial extension of the Brazilian Legal Amazon represents about 61 per cent of Brazil’s territory. In total, the Brazilian Legal Amazon comprises 52 municipalities in the state of Rondônia, 22 in Acre, 62 in Amazonas, 15 in Roraima, 144 in Pará, 16 in Amapá, 139 in Tocantins, 181 in Maranhão and 141 in Mato Grosso. Figure 1 illustrates the geographic distribution of the municipalities that make up the Legal Amazon within Brazilian territory.
Territorial delimitation of the study area.

We selected the Brazilian Legal Amazon as our study area because it is a key location where the majority of Brazil’s environmental planning actions are implemented. Additionally, this region is frequently chosen as the subject of research focusing on economic and environmental issues, as evidenced by studies conducted by Caetano et al. (Reference Caetano, Gherardi and Yoneyama2011), Mendes et al. (Reference Mendes, Cassandro and Junior2012), Assunção et al. (Reference Assunção, Gandour, Rocha and Rocha2020), Stabile et al. (Reference Stabile, Guimarães, Silva, Ribeiro, Macedo, Coe, Pinto, Moutinho and Alencar2020) and Do Prado et al. Reference Do Prado, Tarik, Miyajima, Magalhães, Domingues and Carvalho(2020).
2.2. Data
The data used in this study span from 2005 to 2018 and comprise an unbalanced panel of dataFootnote 2 for 733 municipalities within the Brazilian Legal Amazon. The period was chosen based on the availability of data for the variables constituting the database. However, the number of municipalities included is less than the total in the Brazilian Legal Amazon due to missing data on certain key variables, meaning the database only covers those municipalities where information is available for all necessary variables to estimate the EKC.
To measure deforestation, we calculate the ratio of the annual increase in deforestation (in square kilometres) to the total territorial area of each municipality.Footnote 3 This information is sourced from INPE (2022). To represent economic growth, we use the per capita Gross Domestic Product (GDP) for each municipality, provided annually by IBGE (2022e).
The matrix of control variables includes data on the demographic density of the municipalities, sourced from IBGE (2022b), along with information on the average price of key agricultural activities conducted in each municipality. The rationale for incorporating agricultural prices into the matrix is based on the hypothesis by Assunção et al. Reference Assunção, Gandour, Rocha and Rocha(2020), which suggests that price fluctuations in these activities directly impact the economic growth of the Legal Amazon. To mitigate endogeneity issues arising from the causality between prices and growth, this study employs the price estimation strategy outlined by Assunção, Gandour and Rocha Reference Assunção, Gandour and Rocha(2015). This strategy posits that prices in other regions are closely correlated with those in the Legal Amazon, yet prices outside the region of interest remain completely exogenous to local market indicators. Consequently, Assunção, Gandour and Rocha Reference Assunção, Gandour and Rocha(2015) suggests that an accurate and exogenous estimate of agricultural prices for the target area can be derived from the prices in other markets, weighted by the contribution of specific activities to agriculture and/or livestock in general.
Given the available information on planted areas and the representativeness of production in the municipalities comprising the sample, it was decided to include the prices of corn, cassava and rice in the control matrix.Footnote 4 To illustrate the estimation of exogenous agricultural prices, consider j as the index for the j − th activity and i as the index for the i − th municipality. Let Pf represent the price practised outside the Legal Amazon, P the estimated exogenous price and A the proportion of the j − th planted area relative to the total planted area of a specific municipality; then:
 \begin{equation}
P_i = Pf_{j,i}*A_{j,i}
\end{equation}
Regarding the prices of activities related to livestock, the control matrix includes information on the price of milk and the price of fat cattle. Let R represent the cattle herd and V denote the number of cows milked; the estimated exogenous price for fat cattle is then calculated as follows:
 \begin{equation}
P_i = Pf_{j,i}*\left[\frac{R_{j,i} - V_{i,j}}{R_{j,i}}\right]
\end{equation}
And the estimated exogenous price of milk is calculated as follows:
 \begin{equation}
P_i = Pf_{j,i}*\left[\frac{V_{i,j}}{R_{j,i}}\right]
\end{equation}
We estimate prices separately for each year included in the sample. Following the methodology of Assunção, Gandour and Rocha Reference Assunção, Gandour and Rocha(2015), we use price data from the state of ParanáFootnote 5 to represent the prices of products practised outside the Legal Amazon. For this purpose, we utilise the historical price series from the Center for Advanced Studies in Applied Economics at the University of São Paulo (CEPEA/USP, 2022). The data on planted areas were sourced from IBGE (2022c), and information on the cattle herd and the number of milked cows was obtained from IBGE (2022d).
Prices serve as an incentive for producers to increase their production levels, thereby affecting deforestation in the region. It is important to note that if there is a reduction in the planted area within the Legal Amazon, then for the estimated prices to rise, the prices outside the Legal Amazon must not decrease by a greater magnitude than the increase in the area planted in the study area. The same principle applies to livestock: if the internal proportion of the herd designated for milk production (or beef cattle) decreases, then estimated prices will only increase if the prices practised outside the Legal Amazon do not fall in a proportion greater than the changes in domestic prices.
To control for the effects resulting from government interventions on the environment, the matrix of control variables includes data on the number of environmental fines, the number of environmental infraction notices and the number of environmental embargoes. This information was sourced from the Brazilian Institute for the Environment and Renewable Natural Resources (IBAMA, 2022). All monetary values have been adjusted to December 2020 levels using the Broad Consumer Price Index (IPCA).
Assunção et al. Reference Assunção, Gandour, Rocha and Rocha(2020) showed that rural credit can impact deforestation and environmental degradation in the Brazilian Legal Amazon. To control for effects arising from this variable, the control matrix includes information on the amount of rural credit allocated to producers in the municipalities comprising the sample for each hectare of planted area. Additionally, Piguet Reference Piguet(2010) and Stef and Ben Reference Stef and Ben(2020) suggested that climate change directly affects environmental degradation. Consequently, the matrix of control variables incorporates values for average annual temperature, average annual precipitation, the deviation of the average annual temperature from the period’s average and the deviation of the average annual precipitation from the period’s average. Climatic variable data were sourced from the research of Camarillo-Naranjo et al. Reference Camarillo-Naranjo, Alvarez-Francoso, Limones-Rodriguez, Pita-Lopez and Aguilar-Alba(2019).
We aim to investigate whether production gains in municipalities experiencing higher growth patterns lead to significant changes in the deforestation of the Legal Amazon. For this hypothesis, it is prudent to consider that the EKC exhibits a threshold where the relationship between economic growth and deforestation becomes discontinuous. Identifying this threshold could aid in the strategic planning of production and environmental preservation within the study area.
To enhance the relevance of our results, we conducted three separate estimates, each utilising a different threshold variable: GDP per capita, land productivity in agriculture and dairy farming productivity. For agriculture, land productivity is measured by the ratio of total production value to planted area in each municipality. In the case of livestock, we assess dairy productivity by the ratio of total milk production (in litres) to the number of cattle in each municipality. We utilised data from IBGE (2022c) for calculating land productivity and from IBGE (2022d) for dairy productivity.
2.3. EKC estimation
To estimate the EKC, we initially employ the functional form defined by Ozcan Reference Ozcan(2013). This model posits that the deforestation in the i − th municipality during the t − th period 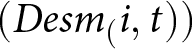 $(Desm_(i,t))$ is influenced by the deforestation that occurred in the previous period. Specifically, it suggests:
 \begin{equation}
log(Desm_{i,t}) = \beta log(Desm_{i, t-1}) + \theta_1 log(Pib_{i,t}) + \theta_2 log(Pib_{i,t})^2 +\theta_3 + \gamma X_{i,t} + \varepsilon_{i,t}
\end{equation}
where X is the array of control variables. In this case,  $log(Desm_(i,t-1))$ is considered to be endogenous in the model, while the other components of equation 4 are considered exogenous. To consider the threshold in the EKC and resolve any problems associated with endogeneity in the estimation of equation 4, we use the specification of a dynamic panel with threshold proposed by Kremer et al. Reference Kremer, Alexande and Nautz(2013). This procedure consists of estimating the EKC according to the following specification:
 \begin{equation}
\begin{aligned}
log(Desm_{i,t}) &= \beta log(Desm_{i, t-1}) + \tau_1 log(Pib_{i,t}) I(log(TH_{i,t}) \leq \lambda) +\\
&\tau_2 log(Pib_{i,t}) I(log(TH_{i,t}) \gt \lambda) +
\gamma X_{i,t} + \varepsilon_{i,t}
\end{aligned}
\end{equation}
Where TH is the threshold variable, which in this study includes the productivity of land in the agricultural sector and the productivity of dairy farming; λ represents the threshold; β, τ and γ are the estimated model parameters; and ɛ is the error term of the estimate. This functional form allows us to identify the point at which the threshold variable causes the EKC to reach an inflection point and the relationship between growth and deforestation to start changing direction. It is important to note that in the threshold estimates, a set of variables that are both dependent and independent of the threshold is considered. In this study, GDP per capita is the variable that depends on the threshold, enabling the exploration of the relationship between growth and deforestation both before and after the threshold is reached, despite the threshold variable not directly representing economic growth.
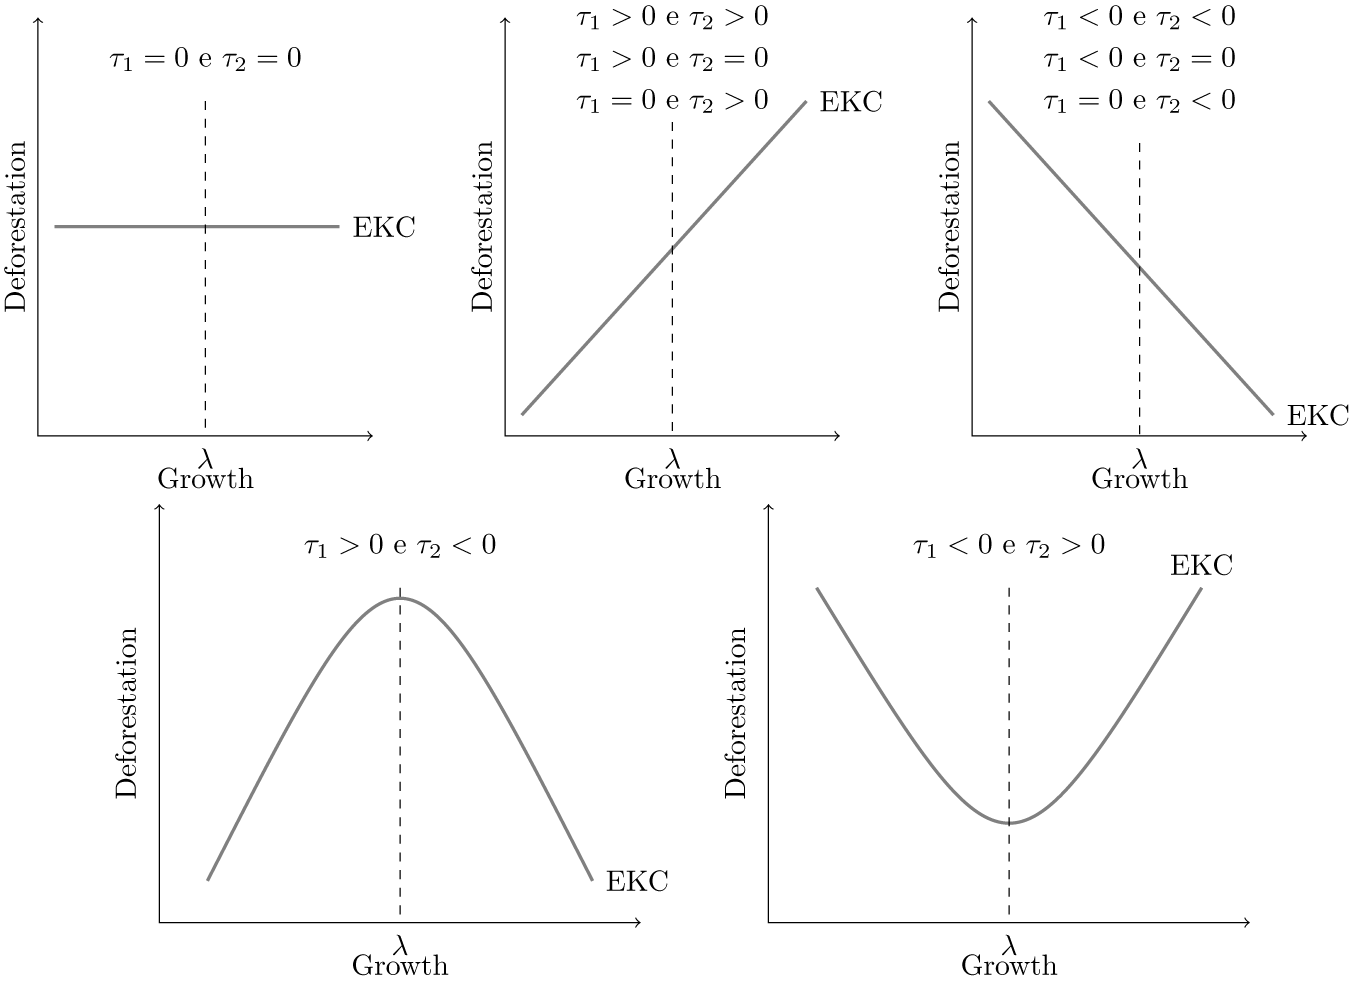
To test the null hypothesis that there is no discontinuity in the relationship between economic growth and deforestation in the Brazilian Legal Amazon, it is posited that a single threshold accurately represents the abrupt changes in the responses of deforestation to changes in economic growth. This assumption suggests that, if present, there is a single threshold across the entire span of the EKC. Based on this assumption, nine specific scenarios can occur, each represented in figure 2.
Possible formats for EKC with threshold.

It is important to emphasise that a conventional estimate of a second-order polynomial equation could accurately represent the relationship between growth and deforestation in the Legal Amazon. However, the nonlinear approach offers the advantage of testing the hypothesis concerning the EKC while it facilitates the examination of whether municipalities in more advanced stages of growth can achieve additional production gains without abrupt changes in deforestation levels. In essence, the nonlinear approach enables the estimation of the EKC and the verification of whether the resulting curve from the estimate is continuous.
It is also important to emphasise that this technique captures the non-linearity of the EKC more effectively than the conventional quadratic approach (Ozcan, Reference Ozcan2013; Sirag et al., Reference Sirag, Matemilola, Law and Bany-Ariffin2018). Additionally, the threshold dynamics panel we employ allows us to precisely identify the turning point of the EKC.
To address the issues associated with fixed effects, we employed the direct orthogonal deviation transformation technique proposed by Arellano and Bover Reference Arellano and Bover(1995). Essentially, this method involves eliminating the serial correlation in the transformed error terms by subtracting the mean of all future observations. The direct orthogonal deviation transformation technique is formulated as follows:
 \begin{equation}
\varepsilon_{i t}^{*}=\sqrt{\frac{T-t}{T-t+1}}\left[\varepsilon_{i t}-\frac{1}{T-t}\left(\varepsilon_{i(t+1)}+\cdots+\varepsilon_{i T}\right)\right]
\end{equation}
In this equation,  $\varepsilon_{i t}$ represents the transformed error vector, and T denotes the number of periods. The advantage of using this transformation is that it allows the correlation between the residuals to remain zero over time.
The procedure for estimating the EKC and the estimation threshold follows a methodology similar to that employed by Kremer et al. Reference Kremer, Alexande and Nautz(2013) and Sirag et al. Reference Sirag, Matemilola, Law and Bany-Ariffin(2018). Initially, the endogenous components of equation 6 are regressed using the instruments contained in the matrix  $X_{i,t}$ through the Generalised Method of Moments. Subsequently, the predicted values are substituted into the EKC equation, and the threshold λ is calculated using an Ordinary Least Squares estimate, determined by minimising the sum of squared residuals. The statistical significance of the threshold is assessed using a likelihood ratio test with a 95 per cent confidence interval, as suggested by Hansen Reference Hansen(1999) and Caner and Hansen Reference Caner and Hansen(2004).
3. Results
Before conducting the estimations, it is crucial to comprehend the fundamental characteristics of the data. Table 1 presents the descriptive statistics of the variables employed in estimating the EKC. The dataset comprises 8,781 observations, constituting an unbalanced panel featuring 760 municipalities and spanning 14 years from 2005 to 2018. The results reveal that, on average, each municipality in the sample possesses a population density of around 13.31 inhabitants per square kilometre and a GDP per capita of approximately R$ 16,864.80 per inhabitant. Additionally, it can be observed that the average deforestation increase for each municipality is about 13.04 square kilometres between 2005 and 2018.
Descriptive statistics of variables

Source: Prepared by the authors.
Notes: We calculate exogenous prices according to Assunção, Gandour and Rocha Reference Assunção, Gandour and Rocha(2015). The number of observations for all the variables is 8,781.
The descriptive statistics also reveal that the estimated mean price of corn in the Legal Amazon during the study period was roughly R$ 9.04 per 60 kg sack, while the price of a 60 kg sack of rice averaged approximately R$ 9.04. The calculated average price per arroba of live cattle stood at approximately R$ 144.68, whereas the mean price per litre of milk was about R$ 0.08. In terms of productivity metrics, the findings show that, on average, each milked cow yielded around 0.70 litres of milk over the study period, while land productivity amounted to roughly R$ 3,964.30 per cultivated hectare.
Climate-related statistics depict that the mean temperature in the Brazilian Legal Amazon between 2005 and 2018 hovered around 27.17 oC, with a variation from the period’s mean of about 0.76 oC. As for precipitation, the descriptive statistics indicate an average rainfall volume of approximately 1849.44 mm in the Legal Amazon throughout the studied period, with a divergence from the historical mean of about 14.65 mm. These results underscore that climate fluctuations in the study region are more closely associated with temperature change, as the precipitation volume shows minimal variability over the years.
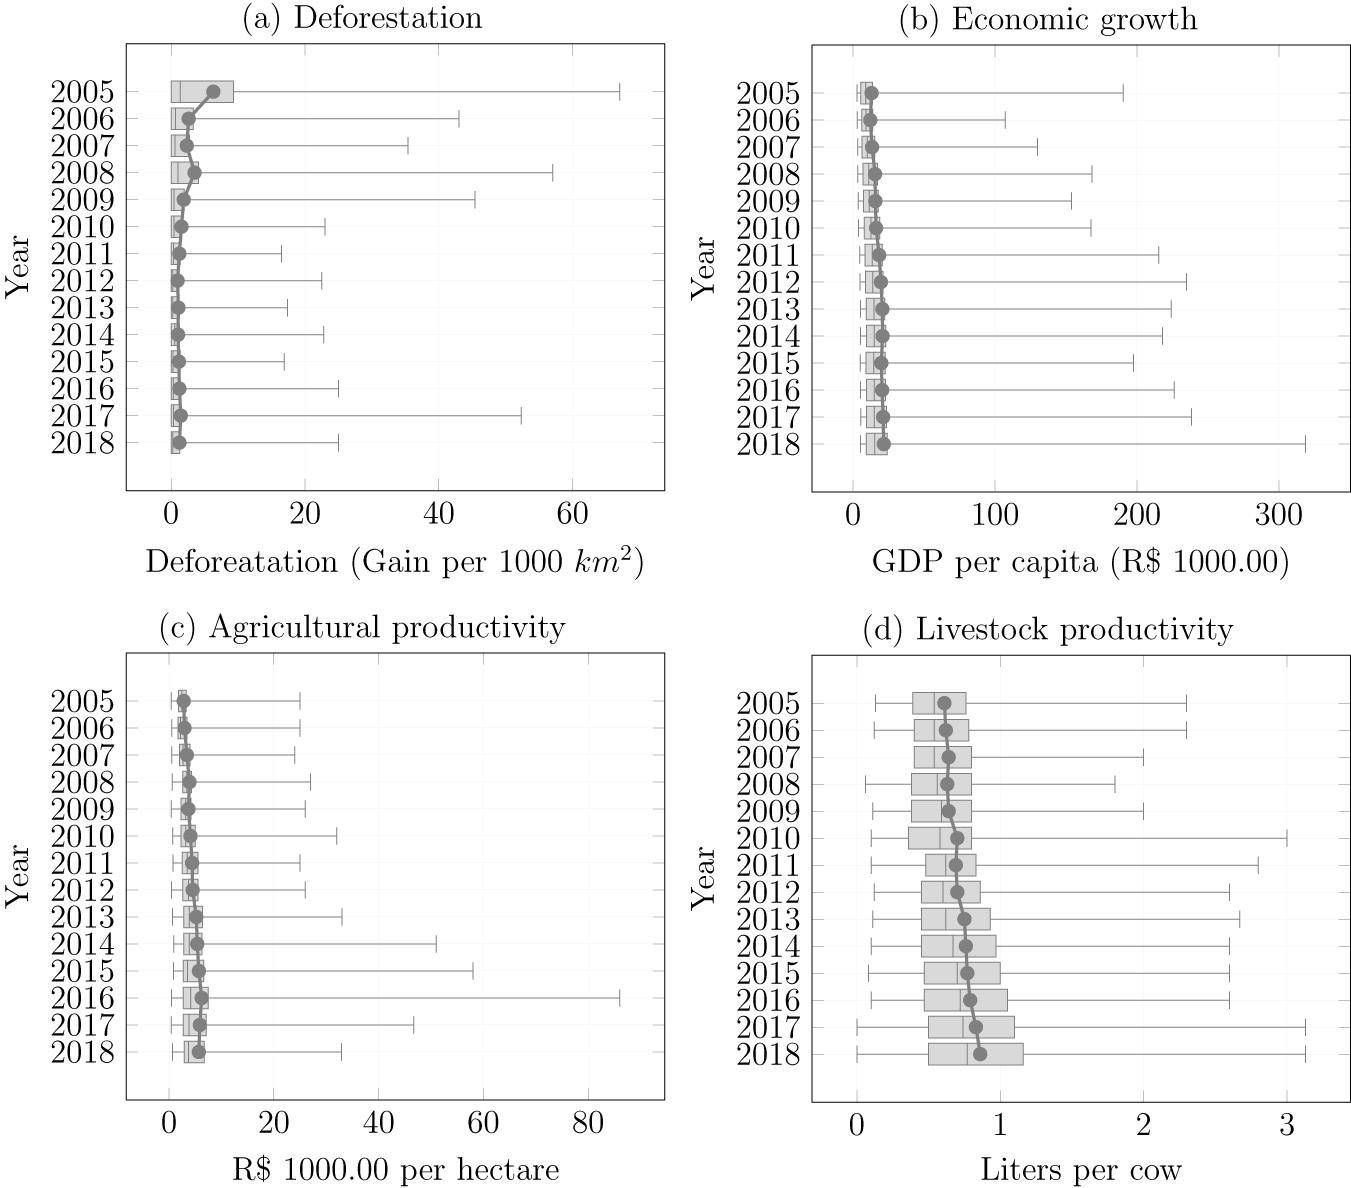
In order to enhance our comprehension of the primary data underlying this analysis, figure 3 illustrates the variability in data pertaining to deforestation (panel (a)) and economic growth (panels (b)–(d)). It is noteworthy that in each year encompassed within the analysis, the mean value of this data (depicted by the green line) closely approximates the minimum values for each variable. This outcome indicates that when comparing all municipalities within the Legal Amazon, the majority of them exhibit a limited degree of economic growth while, concurrently, most of these municipalities register relatively low levels of deforestation.
Summary of growth and deforestation in the Legal Amazon.

However, it is important to note that certain municipalities are experiencing significantly higher levels of growth compared to the Legal Amazon’s average. Consequently, there is a potential for deforestation in these municipalities to respond to growth-related changes in a manner distinct from what is observed in areas with relatively lower economic growth. Moreover, given that these municipalities have already reached an advanced stage of growth, achieving further production gains may necessitate a sudden shift in deforestation.
Table 2 presents the outcomes of EKC estimations employing a threshold approach, as proposed by Kremer et al. Reference Kremer, Alexande and Nautz(2013). We conducted three distinct estimations, each utilising a different threshold variable: GDP per capita, land productivity and dairy cattle productivity. The findings allow us to conclude that while each estimation defines a specific threshold beyond which the relationship between economic growth and deforestation undergoes a change, the overall directional trend of this relationship remains consistent both above and below the threshold.
Results of the estimates

Source: Prepared by the authors based on research results.
Note: Standard deviation in parentheses.
In simpler terms, during the initial stages of growth in the Legal Amazon, it is conceivable that deforestation levels may decrease, even as economic growth continues to accrue. Once a certain threshold of growth (or agricultural productivity) is reached, the sensitivity of deforestation in response to changes in growth levels does shift; however, the fundamental relationship between growth and deforestation remains negative. Hence, the EKC retains a negative slope throughout its entire range, with the only variation occurring in the degree of slope before and after the threshold point.
The analysis of the time lag in deforestation reveals a persistent trend over time. This indicates that increases in deforestation in previous periods invariably lead to a corresponding rise in the present period. In other words, deforestation tends to persist in municipalities with a history of substantial deforestation. This suggests that in areas with a historical pattern of increasing deforestation, transitioning from conventional production methods to ‘clean production’ methods offers limited scalability benefits. Consequently, it may still be more economically viable for producers to prioritise higher levels of production, even at the expense of increased deforestation, rather than entering the market for environmentally sustainable products.
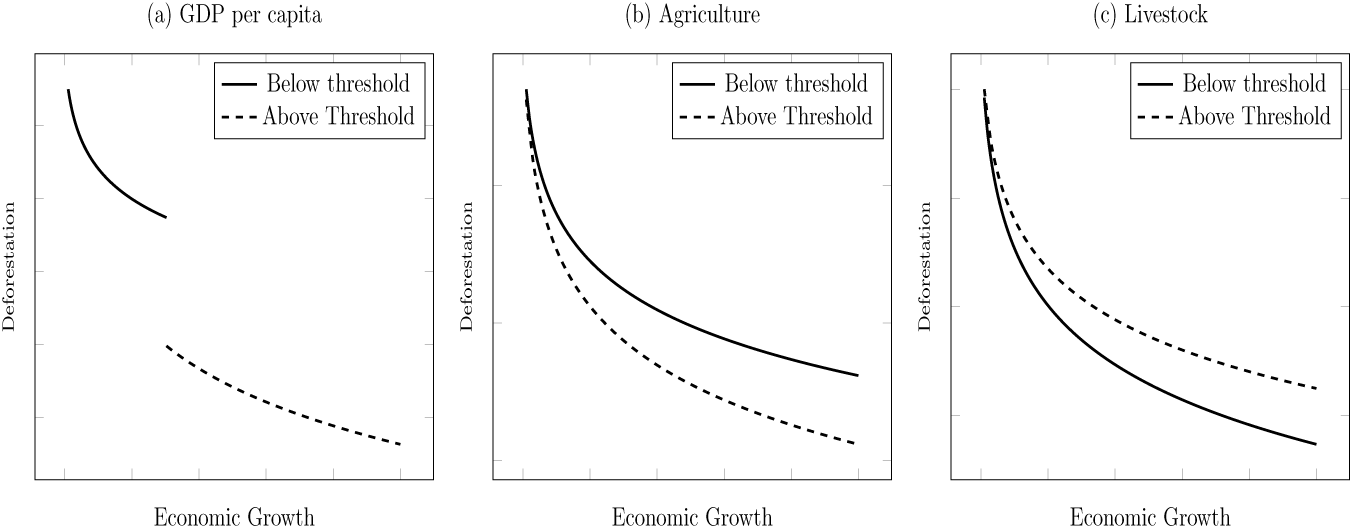
Despite these findings, the coefficients τ 1 and τ 2 reveal that the Brazilian Legal Amazon exhibits an EKC with a negative slope. This suggests that, even though deforestation persists over time, producers can achieve greater productivity gains with decreasing rates of deforestation.Footnote 6 Consequently, the relationship between economic growth and deforestation in the Brazilian Legal Amazon is inverse, with only the sensitivity of growth to deforestation differing among municipalities situated above and below the thresholds considered in the estimations. Figure 4 provides a detailed representation of the EKC based on the results presented in table 2.
Representation of the EKC estimate.

Panel (a) displays the EKC representation based on the estimation employing GDP per capita as the threshold variable. The findings reveal that in municipalities where GDP per capita is below the threshold value (R$ 8,131.14 per inhabitant), the EKC exhibits a less steep slope compared to municipalities with GDP per capita exceeding the threshold. This outcome suggests that in advanced stages of economic growth,Footnote 7 significant reductions in deforestation can be accomplished, provided economic agents accept positive rates of economic growth. Furthermore, this result also indicates that municipalities with higher growth levels are more sensitive to deforestation in relation to economic growth, implying that even with higher levels of growth, substantial reductions in deforestation can still be attained. Similar trends are observed when land productivity serves as the threshold variable. However, these patterns do not hold true for cases where the threshold variable is dairy farming productivity.
Regarding land productivity, municipalities that yield more than R$ 3,501.35 per hectare exhibit a steeper EKC, indicating a greater susceptibility to deforestation in response to economic growth, compared to municipalities with productivity below this threshold. Nevertheless, this characteristic does not persist when the threshold variable is dairy farming productivity. In this case, the difference in the EKC slope before and after the threshold is smaller. When the analysis is conducted using GDP per capita and land productivity as threshold variables, the results suggest that economic growth can be simultaneously achieved while effectively reducing deforestation in municipalities with high-growth levels and land productivity. However, when the analysis is approached from the perspective of dairy productivity, the results indicate a more pronounced negative response of deforestation to growth gains in municipalities with low productivity.
Please note that the negative slope of the EKC, associated with the logarithmic specification of the estimated equation, enables us to observe that as economic growth increases, the disparity in the sensitivity of deforestation concerning growth widens between municipalities situated above and below the threshold. It becomes evident that as economic growth escalates, there is a smoothing effect in the trajectory of the EKC, both for municipalities with growth rates below the threshold and for those with GDP per capita above the threshold. This outcome indicates that within the Brazilian Legal Amazon, deforestation exhibits a stronger response to economic growth during the initial stages of municipal growth and in municipalities with low levels of growth and agricultural productivity. Consequently, these findings may suggest that any potential intervention aimed at altering deforestation levels in the Brazilian Legal Amazon should prioritise changes in the economic growth of municipalities characterised by low growth rates or limited agricultural sector productivity.
It is crucial to emphasise that the parameters obtained in the EKC estimation should not be interpreted causally. The purpose of the estimation is solely to determine the sign of the relationship between economic growth and deforestation based on the estimated threshold. When applying this definition to the representation depicted in figure 4, it is inappropriate to assert that any potential alteration or intervention in economic growth within the Legal Amazon will yield a corresponding change in deforestation equivalent to the slope of the EKC. The estimated coefficients and the structure of the EKC can only suggest that, in a general sense, there is a possibility of reductions in deforestation in the Brazilian Legal Amazon, even when municipalities experience positive economic growth.
These results also provide insights into the sustainability of development patterns in the Legal Amazon. Since the relationship between economic growth and deforestation is negative, there are statistical indications that municipalities in the study area are progressing within an environmentally sustainable framework. This suggests that local economies can concurrently achieve continual gains in production and environmental preservation.
For the sake of comparison, table 3 displays the outcomes of EKC estimations using a quadratic polynomial functional form in a fixed effects estimator. It is worth noting that for general economic growth and dairy farming, the EKC’s slope remains negative, while this slope is zero for agriculture. However, it is important to recognise that the conventional estimate does not facilitate the identification of potential discontinuity points in the curve, hindering the precise pinpointing of instances where increasing growth gains might lead to abrupt alterations in the region’s deforestation.
Standard EKC estimate

Source: Prepared by the authors based on research results.
Note: Standard deviation in parentheses.
Despite the theoretical proposition by Grossman and Krueger Reference Grossman and Krueger(1991) suggesting an “inverted U” relationship between economic growth and deforestation, this configuration is not consistently confirmed in empirical studies aimed at testing the EKC hypothesis. For instance, Marrero Reference Marrero(2010) examined the EKC hypothesis for a selection of European countries and found that, within this specific group of countries, the connection between economic growth and deforestation is null. Consequently, this allowed the aforementioned author to reject the “inverted U” hypothesis put forth by Grossman and Krueger Reference Grossman and Krueger(1991). Other studies have also yielded conclusions contradictory to the “inverted U” shape, as demonstrated in Bölük and Mert (Reference Bölük and Mert2014), Lapinskienė, Tvaronavičienė and Vaitkus (Reference Lapinskienė, Tvaronavičienė and Vaitkus2014) and Abid Reference Abid(2017). In light of these observations, although the estimations conducted in this study do not establish the existence of an “inverted U” relationship between economic growth and deforestation in the Brazilian Legal Amazon, this outcome aligns with the patterns observed in other studies examining the same theory.
It is essential to emphasise that consensus on the EKC format within the Legal Amazon remains elusive. Divergent results emerge from studies employing different methodologies or analysing distinct time periods concerning the EKC’s shape. For instance, Araujo et al. Reference Araujo, Bonjean, Combes, Motel and Reis(2009) identified a consistently positive relationship between growth and deforestation, while Oliveira et al. Reference Oliveira, Almeida, Freguglia and Barreto(2011) concluded that economic growth and deforestation in the Brazilian Legal Amazon follow an “inverted U” pattern. Consequently, the results presented here contribute to the ongoing debate regarding the impact of growth on deforestation in the Brazilian Legal Amazon. The economic literature in this area still requires further discussions, emphasising the need for cautious interpretation of the conclusions drawn from the EKC estimations in this research.
It is also noteworthy that the literature typically treats the relationship between growth and deforestation in the Brazilian Legal Amazon as linear and homogeneous. This approach restricts the comparability of the findings from this study with the existing literature. Furthermore, agriculture’s role in deforestation is typically subjected to a set of control variables in studies aiming to estimate the EKC for the Brazilian Legal Amazon. Consequently, the discussion of the results concerning the current literature remains constrained, primarily due to the limited number of studies focused on estimating the EKC within this specific region and the methodological approach adopted in this work.
The primary reason for the consistently negative pattern observed in the EKC within this study may be attributed to the theoretical framework proposed by Grossman and Krueger Reference Grossman and Krueger(1991) and the stages of environmental consciousness among producers and consumers in the Brazilian Legal Amazon. In its fundamental definition, the EKC theory posits that the relationship between economic growth and deforestation can be dissected into two effects: the scale effect and the composition effect. The scale effect arises from the tendency, especially in the early stages of growth, for economies to pursue greater growth increments through scale returns. This involves increased resource utilisation and inputs, consequently leading to heightened deforestation. On the other hand, the composition effect pertains to the phase of growth where economies have comparative advantages over similar counterparts, enabling them to adopt sustainable growth practices with a stronger emphasis on environmental education and natural resource conservation.
In this context, beyond a certain threshold of growth, the composition effect tends to surpass the scale effect, resulting in the characteristic “inverted U” shape of the EKC. Consequently, the consistently negative relationship revealed in the estimations of this research offers evidence that, within the Brazilian Legal Amazon, even in municipalities characterised by low growth levels, the composition effect tends to prevail over the scale effect. This indicates that adopting clean production practices and pursuing sustainable growth can be so efficient that they allow for increased economic growth while simultaneously reducing deforestation.
4. Concluding remarks
This study aimed to assess the null hypothesis of EKC continuity in the Brazilian Legal Amazon concerning levels of agricultural productivity. To achieve this goal, we utilised an unbalanced panel dataset spanning from 2005 to 2018, encompassing data from 733 municipalities. To fulfil our research objectives, we employed a nonlinear estimation approach, calculating a productivity threshold that delineated the points at which the relationship between economic growth and deforestation changed in the stages before and after this threshold.
Our findings led to the rejection of the null hypothesis, signifying significant disparities in the relationship between economic growth and deforestation contingent on agricultural productivity levels and the economic growth pattern within Legal Amazon municipalities. Moreover, the results indicated that the relationship between growth and deforestation in the Brazilian Legal Amazon follows a consistently negative trend. This implies that, irrespective of the level of economic growth, further growth gains can be attained even in scenarios with reduced levels of deforestation.
Despite the uniformity of the relationship across different threshold variables, our results suggest that the slope of the EKC may vary depending on productivity levels when the threshold is derived from land and dairy farming productivity. To summarise, when dairy farming productivity serves as the threshold variable, the EKC exhibits a steeper slope in municipalities with higher productivity levels. Conversely, when land productivity is the threshold variable, the EKC slope is more pronounced in municipalities with lower productivity levels. These outcomes imply that an economic growth shock can have more significant impacts on deforestation in municipalities specialising in dairy farming and less in agriculture within the Brazilian Legal Amazon.
In conclusion, our findings demonstrate that when the EKC theory is tested using a nonlinear functional form in the Brazilian Legal Amazon, the “inverted U” hypothesis is not supported, resulting in a consistently negative monotonic EKC relationship. This conclusion contributes to the ongoing discussion in the literature on how growth influences deforestation while expanding the discourse on the environmental consequences of economic growth in the Legal Amazon. Future research endeavours may further contribute to this area by examining the hypothesis of the existence of multiple thresholds within the EKC.
Competing interests
The authors declare none.