


Introduction
Melt duration, melt rate and snow accumulation are key variables of interest to the hydrologist predicting the snow-melt freshet; to the climatologist, snow-covered area and melt rates are important feedbacks to atmospheric and oceanic systems. Melt duration controls infiltration of melt-water to frozen soil, snow ecology, runoff pathways and stream-flow dynamics. Snow-covered area controls areal albedo, surface temperature and aerodynamic roughness. Snow accumulation, normally expressed as snow water equivalent (SWE), exerts an important control on catchment water balance and spring freshet magnitude and timing. While notable progress has been made in describing the detailed physics of snow processes that control accumulation and ablation, the operation of these processes over areas of complex landscapes, at scales which differ from those for which the processes have been described, presents questions that have only been addressed more recently. Critical questions involve the role of spatial variability and covariability of snow accumulation and ablation in aggregated responses from catchments and atmospheric surface-layer domains. How snow processes vary with each other and with landscape features and how this influences the larger-scale behaviour of surface hydrology and atmospheric boundary-layer systems remains poorly understood. In particular, there remains great uncertainty in upscaled application of snow-process descriptions that were developed for a point or assumed uniform plane.
It is now recognized that the spatial variability of snow accumulation and melt are important features of nival systems. For instance, the frequency distribution of pre-melt SWE, S0, has important implications for techniques to calculate areal snow-cover depletion, melt rates and mass balance of snowpacks (Reference ListonListon, 1999; Reference Luce, Tarboton and CooleyLuce and others, 1999). The development of a pre-melt frequency distribution of SWE at small scales is due to redistribution of snow by either interception or blowing snow and to spatial variation in over-winter snow ablation. At larger scales typical of a mountain headwater catchment and over large elevation gradients, differences in snowfall can also contribute to the variability in SWE.
Within snow-accumulation-based landscape classes, the log-normal distribution has been found to adequately fit the frequency distribution of pre-melt SWE (Reference Donald, Soulis, Kouwen and PietroniroDonald and others, 1995; Reference ShookShook, 1995; Reference PomeroyPomeroy and others, 1998; Reference Faria, Pomeroy and EsseryFaria and others, 2000). The log-normal distribution can be described in terms of the mean SWE, S, and a coefficient of variation (standard deviation/mean) Cs where the SWE at some point is controlled by the point’s frequency factor, K, calculated from the rank of the observation (e.g. Reference Faria, Pomeroy and EsseryFaria and others, 2000), where

Reference PomeroyPomeroy and others (1998) and equations (5–7) in Reference Essery and PomeroyEssery and Pomeroy (2004) further describe the log-normal distribution and its link to the coefficient of variation. Late-winter Cs values for Canadian landscape classes have been proposed from extensive surveys by Reference PomeroyPomeroy and others (1998).
Melt energy is naturally variable over a landscape; when applied to snow it results in melt rates, M, with a spatial distribution that influences snow-cover depletion (SCD), areal melt rates and regional snow mass balance (Reference Faria, Pomeroy and EsseryFaria and others, 2000; Reference Pomeroy, Hanson and FariaPomeroy and others, 2001). The spatial distributions of melt rate discussed here are for time intervals where melt over the interval is not limited by remaining snow mass, and therefore relate to melt energy rather than SWE. Reference Pomeroy, Hanson and FariaPomeroy and others (2001) found at small scales in a northern boreal forest that melt rate (before complete ablation) was log-normally distributed, and Reference Faria, Pomeroy and EsseryFaria and others (2000) found in a southern boreal forest that melt rate was linearly associated via a covariance with pre-melt SWE.
Covariance between two “independent” variables over space can introduce deviations from reality into “upscaled” representations based on products of areal means. For instance, the covariance between snow depth and density over a field caused a bias in calculating S of 45 mm for deep prairie snowpacks (Reference Shook and GrayShook and Gray, 1994). The effect of covariance between melt rate, M, and SWE, S, on the duration of melt, T, can be described as
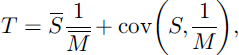
where covariance is found from observations as

and n is the number of observations. When the covariance is known, representations such as melt duration can be calculated using areal means S and M using Equation (2). A covariance implies a statistical association between SWE and melt rate; when known (e.g. linear correlation), this can be used to correct estimates of M and SCD using M̄, S̄, Cs and the relationship between M and S (e.g. Reference Faria, Pomeroy and EsseryFaria and others, 2000). Reference Faria, Pomeroy and EsseryFaria and others (2000) and Reference Pomeroy, Hanson and FariaPomeroy and others (2001) used linear relationships between SWE and melt rate to adjust calculations of snowmelt and SCD. The effects of correlation on SCD are discussed in detail by Reference Essery and PomeroyEssery and Pomeroy (2004).
It is the purpose of this paper to present observations of the variability of pre-melt and melt-period SWE and the associated variability of melt rate as determined by observations of SWE at small, medium and catchment scales. These scales are defined as:
-
1 small scale: length scales less than a few hundred metres over uniform vegetation and topography, having uni-modal frequency distributions of S
-
2 medium scale: length scales of 100–2000m of similar landscape class, but with sub-units of differing aspect and slope and/or vegetation height and density
-
3 catchment scale: length scales typically >10 km, with multiple elevation bands, slopes and aspects and multiple vegetation types corresponding to a range of landscape classes.
The effect of covariance between observed S and M at the catchment scale is then assessed against SCD observations. The reader is advised to consult the companion paper (Reference Essery and PomeroyEssery and Pomeroy (2004)) for the theoretical background and modelling implications of the variability and association of SWE and melt rate.
Study Site, Observations and Methods
Snow-depth and -density surveys were conducted during the snow season (usually October–May) on a monthly basis at Wolf Creek research basin (60°36′ N, 134°57′W), south-east of Whitehorse, Yukon Territory, Canada. Wolf Creek research basin occupies 185 km2 in the headwater region of the Yukon River (Fig. 1). The primary vegetation zones are:
Digital elevation map of Wolf Creek catchment, with regular snow-survey locations (Buckbrush = shrub tundra) and Granger sub-catchment marked. The Granger sub-catchment is magnified to show location of snow-survey transect and slopes.

-
1. boreal forest: white spruce, lodgepole pine and aspen trees, 10–18m tall; 22% of catchment; 700–1200ma.s.l.
-
2. shrub tundra: willow, sparse white spruce, dwarf birch, grass, 0.4–3m tall; 58% of catchment; 1200–1500ma.s.l.
-
3. alpine tundra: willow, dwarf birch, grass, lichen, rock, 0.01 –0.3m tall; 20% of catchment; 1500–2250ma.s.l.
The catchment is mountainous with elevations of 700– 2250 ma.s.l. Winter snowfall has recently ranged from 150 to 180 mm; snow cover develops in October and melts from all but the highest drifts on north-facing slopes by mid-June. Winter wind speeds are near 1ms–1 in the forest zone, doubled in the shrub tundra zone and quadrupled in the alpine tundra zone. Winter temperatures typically range from −10°C to −30°C, with extremes below −40°C and above 0°C; in April, daily means normally exceed 0°C. Snow accumulation in the catchment is subject to substantial redistribution and sublimation by canopy interception in the boreal forest and blowing snow in the alpine tundra, with slight redistribution in the shrub tundra (Reference Pomeroy, Hedstrom and ParviainenPomeroy and others, 1999).
Snow surveys were of two types. Small-scale 25-point depth and density surveys were undertaken by the Yukon Water Resources Branch along random-direction, permanent snow courses (130m) at level sites in dense-spruce-forest, tall-shrub-tundra and sparse-alpine-tundra environments, all near permanent meteorological stations in the Wolf Creek catchment. Fine-resolution (1m increment) measurements along these snow courses had the same mean and variance as the regular surveys (Reference Pomeroy, Gray, Hedstrom and JanowiczPomeroy and others, 2002). During field campaigns, longer and finer-resolution snow surveys were taken at the Wolf Creek sites and along a 660 m transect crossing the Granger sub-catchment ofWolf Creek (shrub tundra, alpine tundra) from north face, across valley bottom to south face (Fig. 1). At the meteorological stations, snow depth was continuously recorded using Campbell Scientific UDG01 ultrasonic snow-depth sensors, and density recorded manually during operational snow surveys.
SWE (mm) was calculated as depth times density, and melt rate (expressed as mm of equivalent water phase change per time interval) was found from the change in snow mass (ablation) by assuming that redistribution and surface sublimation were negligible. These assumptions were not completely met, as surface sublimation measured using eddy correlation techniques over shrub tundra averaged 0.25 mmd–1 during late melt. Melt rate was compared to SWE for distributions of SWE by assuming that SWE rank (largest to smallest) did not change during melt (Reference Faria, Pomeroy and EsseryFaria and others, 2000).
Variability of SWE
Reference Pomeroy, Hanson and FariaPomeroy and others (2001) observed that a log-normal distribution fitted the Wolf Creek boreal-forest pre-melt SWE observations, and that during melt the fit was progressively disturbed by the effects of spatially variable melt rate on remaining SWE. The spatial distribution of melt varied over time and was found to be not associated with the spatial distribution of SWE. Figure 2 shows progressive SWE observations from March to May 1999 from the 660 m long tundra transect along the north and south faces and valley bottom of Granger sub-catchment. The two slopes and valley bottom of this transect have quite distinctive initial snow-accumulation and melt energetics (Reference Pomeroy, Toth, Granger, Hedstrom and EsseryPomeroy and others, 2003). In Figure 2, SWE observations during melt are plotted against the rank-based frequency factor, K, of the pre-melt SWE distribution from the whole transect. An example of Equation (1), describing a theoretical log-normal distribution, is given as the solid line in Figure 2. The match of pre-melt observations with the log-normal distribution is not as good as that found by other studies in homogeneous landscape classes (e.g. Reference Faria, Pomeroy and EsseryFaria and others, 2000). Stratification of observations by slope-based sub-units within the landscape class is generally necessary to develop unimodal distributions where snow is redistributed by wind (Reference Essery, Li and PomeroyEssery and others, 1999). During much of the melt period, the shallower snow (<300mmSWE) underwent progressive ablation, but the deepest snows (>500mmSWE) either accumulated further or melted slowly. Thus, as in other environments, while the pre-melt distribution of SWE in shrub and alpine tundra can be approximated by a log-normal distribution, variable melt energy progressively disturbs the distribution of SWE during ablation. Further analysis of melt along this transect is now stratified by slope-based sub-units of landscape class to provide for a more unimodal frequency distribution and to avoid simultaneous accumulation and ablation of tails of an initial distribution of SWE during the “melt” period.
SWE (S) during melt, υs frequency factor K of premelt S for various sampling dates (lateMarch = pre-melt) along a north–south complex tundra transect at Granger sub-catchment, 1999. Solid line denotes a theoretical log-normally distributed S.
To explore the development of SWE distributions in the various landscape classes of Wolf Creek catchment, the regular over-winter snow surveys were analyzed for the period 1993–99. The pre-melt standard deviation of SWE, σ0, is an important component of proposed SCD curves (Reference Essery and PomeroyEssery and Pomeroy (2004), equation (7)), and the landscape-class stratified surveys showed two types of development of σ over the winter. Windswept tundra, including alpine tundra and the 20° steep north- and south-face slopes of the Granger sub-catchment, showed a strong correlation coefficient, r, between σ and S over the winter (r = 0.89 for alpine tundra) and a linear relationship giving Cs = 0.48 (Fig. 3a). Sheltered sites including the Granger valley bottom, a broad shrub tundra valley and the boreal forest showed a weaker correlation between σ and S̄ (r = 0.71 for shrub tundra, 0.76 for forest) and a smaller overall Cs = 0.27 (Fig. 3b). These relationships suggest that by stratifying sites into those that are wind-blown (subject to blowing snow) and sheltered (restricted redistribution by wind), the pre-melt standard deviation can be consistently predicted from the mean SWE, and hence the coefficient of variation can be found.
Winter (December–April) average SWE, S̄, and standard deviation for landscape-class-based snow surveys, 1993–99. (a) Windswept landscape classes including alpine tundra, and the complex 20° north- and south-face tundra slopes in Granger sub-catchment. Linear relationship between standard deviation and S is shown for the alpine landscape class only. (b) Sheltered landscape classes including shrub tundra, valley bottom tundra (Granger) and boreal-forest sites. Linear relationships between standard deviation and S are shown for the shrub tundra and boreal-forest landscape classes only.
The strong association between mean SWE and standard deviation was not evident during melt. Figure 4 shows that σ during melt held relatively constant or even increased slightly during most of the melt period for boreal-forest, complex-shrub and alpine-tundra landscape classes. The progression of σ values from σ0 onwards tends from right to left for each landscape sequence in Figure 4. Only at the end of melt (leftmost points in each sequence) as S̄ declines to values below σ0 does σ begin to decline as well. This suggests that mid-winter melting will not decrease the established variability of SWE and that repeated accumulation and ablation events, particularly in windswept locations, could increase the variability. When landscape classes are combined as in the long transect shown in Figure 2, then concurrent accumulation and ablation at respectively deeper and shallower SWE extremes of the distribution during a “melt” sequence can result in a broadening of the distribution of SWE during snow-cover depletion.
Change in standard deviation with S̄ during melt, Granger-complex tundra (north face, south face, valley bottom), boreal-forest and alpine-tundra landscape classes, 1999.
Association between SWE and Melt Rate
Small scale
The small-scale association between initial SWE and melt rate was explored using fine-resolution (1m sampling distance) measurements from the Granger long transect. Figure 5 shows melt rate from 19 April to 16 May 1999, plotted against pre-melt SWE (17 March). Points where snow completely ablated over an interval were not included in the analysis, as their melt rate cannot be precisely determined. The association is influenced by landscape class, here governed by exposed vegetation height and slope exposure. The approximately 100m wide valley bottom has the strongest correlation coefficient (r = -0.95) and the tallest exposed shrub height (approximately 1.5 m). Aweaker correlation (r = -0.63) exists for the approximately 300m long south-facing sparse shrub tundra where shrubs are exposed from 0 to 0.5 m. No association between melt rate and initial SWE developed over the approximately 200 m long north face. This face was dominated by a snowdrift that buried most vegetation. Reference ShookShook (1995) found in open prairie environments with minimal vegetation that there was no identifiable small-scale association between SWE and melt rate. It is possible that heating of exposed shrub stems by absorption of solar radiation and delivery of this energy to melt by either sensible heat or longwave radiation has influenced the small-scale melt pattern. The strong negative correlation may be a general property of tall-shrub landscapes in environments where incoming shortwave radiation is large during melt. Shrub tundra has distinctive regimes of accumulation and melt (Reference Liston, McFadden, Sturm and PielkeListon and others, 2002). A negative correlation between S and M has important implications for SCD and can significantly reduce the snow-covered area during the early part of the melt sequence as described by Reference Pomeroy, Hanson and FariaPomeroy and others (2001) and Reference Essery and PomeroyEssery and Pomeroy (2004).
Association between melt rate and average pre-melt SWE, 19 April–16 May 1999, for valley bottom, south face and north-facing 20° tundra slopes, Granger sub-catchment. Best-fit linear relationships shown where a trend is evident.
Medium scale
The association between mean pre-melt SWE, S0, and mean melt rate,  from slope-based sub-units of tundra landscapes for medium scales was initially explored by Reference Pomeroy, Toth, Granger, Hedstrom and EsseryPomeroy and others (2003) and is further examined in Figure 6. These landscape classes have length scales of 100– 2000 m and lie adjacent to each other along the Granger long transect at similar elevations but with differing aspects and vegetation heights. The correlation coefficient, r, between and S0 at this medium scale is -0.86 and is consistent from March to May, suggesting a strong negative association. The sign and magnitude of r are due to local slope geometry and meteorology, specifically to a large drift forming from southerly winds on the north-facing slope where insolation is lowest. Reference Pomeroy, Toth, Granger, Hedstrom and EsseryPomeroy and others (2003) pointed out that other topographic orientations and blowing-snow regimes might develop quite different associations between and S0 at this scale. Therefore, the negative r values at medium scales (>500m) over Granger complex tundra are anticipated to be neither consistent over time nor transferable with confidence to other catchment slope geometries and microclimates without a better understanding of causal factors. Medium-scale values of r could be affected by a change in the blowing-snow regime (change in wind direction, wind speed, snowfall) or the degree of cloudiness or turbulent transfer during melt. It is suggested that physically based distributed snow-redistribution and melt models run at subgrid scales might be used to diagnose the stability and magnitude of these medium-scale correlations and to specify scaling corrections for larger-scale representations.
Association between landscape-class melt rate and average pre-melt SWE in complex tundra landscapes, Granger sub-catchment (<5 km2), 1999. The two linear relationships between pre-melt SWE and melt rate shown are similar enough that coefficients and constants could be averaged.
Catchment scale
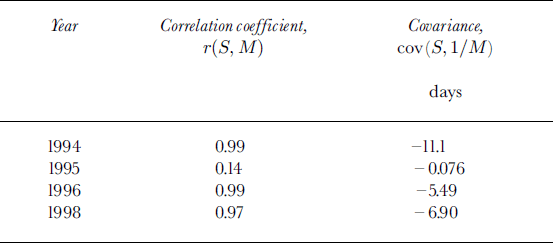
The catchment scale (>10 km space, multiple elevation, multiple vegetation) association between landscape-class mean melt rate and pre-melt SWE from across Wolf Creek basin is shown in Figure 7 for boreal forest, shrub tundra and alpine tundra from 1994 to 1998 .Melt duration was determined from the start and completion of melt as measured by ultrasonic snow-depth gauges. The association between  and S0 was positive, linear and strong, except for 1995 when no association developed. The correlation coefficient between and S0 and covariance between the inverse of and S0 are shown in Table 1. The covariance shown is the change in melt duration due to the association between variables (Equation (2)), and results in a substantial shortening of the catchment-scale melt duration from that indicated by the mean melt rate and pre-melt mean SWE without correction. Catchment-scale depletion accelerated by 6–11 days (except for 1995) from melt durations that ranged from 15 to >30 days. As shown in theoretical analysis by Reference Pomeroy, Hanson and FariaPomeroy and others (2001) and Reference Essery and PomeroyEssery and Pomeroy (2004), the correlations and linear relationships found for three out of the four years have important effects in initially decelerating and later accelerating the SCD sequence and in increasing the catchment-scalemelt rate over a condition where melt rate was uniform with respect to snow accumulation.
Association between landscape-class melt rate and average pre-melt SWE for varied landscape classes, Wolf Creek catchment (185 km2), 1994–98. Linear relationships are shown where they were evident. The years 1994 and 1996 have sufficiently similar trends that the coefficients and constants could be averaged.
Spatial statistics association between catchment scale and pre-melt  from observations in boreal forest, shrub tundra and alpine tundra, Wolf Creek research basin
The likely reasons for a positive correlation at the catchment scale are the variability in the type of snow redistribution processes and the variability in melt rate in subarctic mountain environments. Reference Pomeroy, Hedstrom and ParviainenPomeroy and others (1999) found over four seasons that snowfall (measured and corrected for wind-induced undercatch at each meteorological station) did not vary significantly or consistently with elevation in Wolf Creek and that all landscape types received approximately the same seasonal snowfall. However, they did find large differences in snow redistribution with landscape type. In the boreal forest, 38–45% of seasonal snowfall was found to sublimate from intercepted snow. In alpine tundra, 39–79% of snowfall was removed by blowing-snow transport and sublimation. Shrub tundra contained many snowdrifts which gained 191% of seasonal snowfall from blowing snow, while non-drift areas of shrub tundra lost 17–46% of snowfall to blowing-snow transport and sublimation. The results of Reference Pomeroy, Hedstrom and ParviainenPomeroy and others (1999) suggest that snow accumulation will normally be highest in the shrub tundra and lower in boreal forest and alpine tundra. Melt rate over a catchment scale is influenced by differences in elevation (up to 1500 m), mesoscale meteorology and vegetation cover. The boreal-forest snowmelt rate would be diminished notably from that in an open area (Reference HardyHardy and others, 1997) due to the extinction of shortwave radiation by the evergreen canopy. The alpine-area snowmelt rate would be reduced by adiabatic cooling at elevation. Exposed shrubs might increase the melt rate in shrub tundra through reduced albedo and enhanced aerodynamic roughness.
Implications for snow depletion at various scales
The negative correlations between SWE and melt rate found at small and medium scales and the positive correlations found at catchment scales have important implications for areal representations of melt and SCD that are more fully explored by Reference Essery and PomeroyEssery and Pomeroy (2004). What is important to emphasize here is that the scale of land units used in areal melt calculations affects the size and magnitude of errors in melt duration due to covariance and the deviation of SCD curves from the case of uniform melt rate that is currently assumed in most models. The catchment-scale associations can be compensated for by tiled, grouped response unit (GRU), areas of similar attributes (ASA) or hydrological response unit (HRU) modelling techniques where the modelling units correspond to landscape types that are relevant to the differing snow-accumulation processes and melt rate as discussed above. Of course to compensate, such models will likely need to address snow redistribution, interception, sub-canopy melt and vegetation-elevation band meteorology. It might be possible to compensate for medium-scale associations between SWE and melt rate due to blowing snow and slope/aspect variations in melt energy by running subgrid distributed models to diagnose the degree of local correction needed in both melt-duration and SCD curves. It is likely that these will be specific to catchment geometries and possibly weather patterns, but the interannual stability of such corrections is currently unknown. At small scales, the association between SWE and melt rate reported here for exposed shrub vegetation and previously reported by Reference Faria, Pomeroy and EsseryFaria and others (2000) for low-density boreal forest might be intrinsic to the vegetation type, and standard corrections could be developed and employed in melt and SCD calculations much as coefficients of variation for these landscape types are currently employed in tiled models (Reference PomeroyPomeroy and others, 1998).
Discussion and Conclusion
The results here suggest that a log-normal frequency distribution may be used to describe the pre-melt spatial distribution of SWE in complex tundra terrain, but that complex tundra terrain should ideally be stratified by slope class. At all sites, the fit of observed SWE to the initial log-normal distribution degraded progressively during melt. This is ascribed to spatially variable melt rate applied to the snow cover. The spatial variability of SWE resulted in linear relationships between winter σ and S̄ for landscape classes ranging from boreal forest to alpine tundra. These landscape-class relationships can be characterized by two regimes: windswept tundra where Cs = 0.48, and sheltered tundra and forest where Cs = 0.27. All windswept tundra sites had been subject to wind redistribution of snow by blowing snow. During melt, however, there was little association between σ and S̄ for a landscape class; as S̄ declined during the melt period, σ rose slightly and then at the end of melt declined with S. This suggests that repeated melt– accumulation sequences would not decrease the variability of SWE with respect to a monotonic accumulation–melt sequence, and would actually increase it if wind redistribution of snow occurred during accumulation periods.
At small scales (<100m) a negative association between SWE and melt rate developed at sites where shrubs were exposed above the snow, the degree of correlation being highest for sheltered locations with tall shrubs. There was no small-scale association between melt rate and SWE in the boreal forest or for deeper drifted snow over short vegetation in the tundra. A negative correlation developed between slope meanmelt rate and pre-meltmean SWE from adjacent slopes at a medium scale (>500m, <2000m) in complex tundra terrain. This correlation was likely due to the geometric configuration of the east–west-oriented valley and to the primary blowing-snow transport direction being from the south, placing a large snowdrift on the low-insolation, north-facing slope. The sign and magnitude of correlation coefficients due to these effects will depend on slope geometry, aspect and mesoscale meteorology. At the catchment scale (>10 km, <200 km) the correlation between landscape-class mean melt rate and pre-melt SWE reverses to a positive one, which was strong in three years out of four. A related negative covariance between 1/M̄ and S0 resulted in estimates of catchment mean melt duration that were shorter by up to 11days than estimates using only catchment mean melt rate and pre-melt SWE to estimate duration. Theoretical analyses presented by Reference Essery and PomeroyEssery and Pomeroy (2004) suggest that such a positive association between melt rate and SWE results in an initial deceleration (SCA > 0.5) and later acceleration (SCA < 0.5) in the decline of snow-covered area (SCA) with a monotonic melt sequence.
From these results it is clear that the spatial variability and covariability of both SWE and melt rate are scale- and landscape-class-specific and need to be considered in a landscape-stratified manner at the appropriate scale when snow depletion is described and the snowmelt duration predicted. Interpretations, extrapolations and models of scaling relationships involving snow accumulation and melt rate should refer to the occurrence and distribution of the snow processes responsible for spatial variability and association between variables.
Acknowledgements
The authors acknowledge the field assistance of many personnel from the Canadian Department of Indian Affairs and Northern Development (DIAND) Water Resources, Environment Canada and collaborating institutions, with special thanks to N. Hedstrom, G. Ford and D. Bayne. Wolf Creek research basin is operated by Yukon Environment, Water Resources Branch under the management of R. Janowicz. Funding was provided by the DIAND Arctic Environmental Strategy, Mackenzie GEWEX (Global Energy and Water Cycle Experiment) Study (Natural Sciences and Engineering Research Council, Environment Canada), the U.K. Natural Environment Research Council, the Canadian Foundation for Climate and Atmospheric Sciences and GAPP, U.S.A. The comments of two anonymous referees were helpful in improving this paper.



