I. INTRODUCTION
Chemical order–disorder alloys have been long used as a powerful means for both probing the defect production process in irradiated materialsReference Siegel1–Reference Kirk, Blewitt and Scott5 and monitoring the kinetic response of systems driven from equilibrium.Reference Zee and Wilkes6–Reference Wei, Lee, Averback and Flynn8 Cu3Au is particularly useful for such studies since disorder can be measured by diffraction methods or electrical resistivity, and the critical order–disorder transition temperature T C is conveniently located at ∼390 °C. This means that defect production studies can be carried out in real time using ion or neutron irradiation, and the kinetic response of the alloy can be measured in both the ordered and disorder states.Reference Lee, Averback and Flynn9 While numerous studies have been conducted on irradiated Cu3Au and other order–disorder alloys, the present work focuses on the effect of irradiation close to the order–disorder phase transition, where the introduction of even small increments of free energy can possibly have large consequences in the state of the alloy. Such a study has not been performed previously since in most order–disorder alloys, the critical temperature is too high. For example, T C in Ni3Al is 1373 °C, but at this high temperature, recovery is extremely rapid so that it is not possible to drive the alloy significantly away from its equilibrium state, even using the most intense irradiation sources. Systems with too low T C, on the other hand, simply cannot be thermally ordered. While Cu3Au is thus well suited for this study, diffusion in Cu3Au is, nevertheless, quite rapid at T C, and therefore to prevent significant relaxation of the state of order during measurement, measurement times are limited to ∼1 s.Reference Wei, Lee, Averback and Flynn8
The change of the long-range order parameter S in order–disorder alloys at high temperatures is typically expressed as
 $${{{\rm{d}}S} \over {{\rm{d}}t}} = {\left( {{{{\rm{d}}S} \over {{\rm{d}}t}}} \right)_{{\rm{irr}}}} + {\left( {{{{\rm{d}}S} \over {{\rm{d}}t}}} \right)_{{\rm{thermal}}}}\quad .$$
The first term on the right in Eq. (1) refers to the chemical disorder introduced into the lattice during defect production processes, lasting a few picoseconds, while the second term refers to the relaxation of order toward equilibrium by thermally activated diffusion processes. The disordering term can be written as
 $${\left( {{{{\rm{d}}S} \over {{\rm{d}}t}}} \right)_{{\rm{irr}}}} = - \kappa \varepsilon S\quad ,$$
where κ is the irradiation flux, usually measured in displacements per atom (dpa) per second, and ε is the disordering rate per dpa—or roughly the number of antisite defects produced per dpa. Past measurements of this term for Cu3Au at low temperature yield ε ∼ 20 antisite defects per dpa,Reference Zee and Wilkes6,Reference Lee10 but this is discussed in more detail below. The second term can be written within the Bragg–Williams (BW) approximation asReference Bragg and Williams11–Reference Dienes13
 $${\left( {{{{\rm{d}}S} \over {{\rm{d}}t}}} \right)_{{\rm{thermal}}}} = \upsilon \exp \left( { - {U \!\left/{\vphantom{U {kT}}}\right.{kT}}} \right)\left\{ {{X_{\rm{A}}}{X_{\rm{B}}}{{\left( {1 - S} \right)}^2} - \exp \left( { - {V \!\left/{\vphantom{V {kT}}}\right.{kT}}} \right)\left[ {S + {X_{\rm{A}}}{X_{\rm{B}}}{{\left( {1 - S} \right)}^2}} \right]} \right\}\quad ,$$
where υ is the frequency factor for atomic exchanges, k is the Boltzmann constant, U is the energy for an atomic exchange, V is the ordering energy, and X i is the molar fraction of alloy component i = A or B. Irradiation affects this recovery term through the frequency factor since υ depends on the concentrations of point defects. The present experiment measures initial disordering rates,  ${\left. {{{{\rm{d}}S} / {{\rm{d}}t}}} \right|_0}$ as a function of temperature using 500 keV Ne+ irradiation. In the limit that t → 0, such measurements yield, in principle, the temperature dependence of ε directly. In this work, we show (i) using in situ electron diffraction that
 ${\left. {{{{\rm{d}}S} / {{\rm{d}}t}}} \right|_0}$ increases rapidly with temperature just below T C, increasing a factor of ∼10 between 250 and 370 °C and (ii) by molecular dynamics (MD) simulation that ε depends only weakly on temperature. We attribute this apparent discrepancy to a third contribution to
 ${\left. {{{{\rm{d}}S} / {{\rm{d}}t}}} \right|_0}$ arising from point defect fluxes.
Before presenting the results of the current work, we mention that previous research attempted similar measurements using electrical resistivity measurements on molecular beam epitaxy grown thin films. The main results of that work, which can be found in the Ph.D. thesis of Lee,Reference Lee10 are summarized in the Supplementary Material. These results, however, were not conclusive since the resistivity measurements in that work did not reproduce X-ray measurements for the equilibrium state of order as a function of temperature in the interesting temperature regime near T C, thus providing the motivation for these new experiments using electron diffraction. The low temperature resistivity data, however, agree well with both equilibrium order and the new electron diffraction results, and we will use this more complete set of resistivity data in discussing some of our results.
II. METHODS
The composition of our Cu3Au alloy was measured using a Shimadzu EDX-7000 (Shimadzu Corporation, Kyoto, Japan) energy dispersive X-ray fluorescence spectrometer, and the average Cu:Au ratio was found to be 2.96 ± 0.1. Specimen preparation began with electrical discharge machining to cut Cu3Au into approximately 3 mm diameter, 0.3 mm thick disks. These disks were annealed in an Ar–H (5%) atmosphere at 800 °C for 1 h to increase the average grain size of the finished transmission electron microscopy (TEM) foils. The alloy disks were then chemically ordered by cooling from 400 to 385 °C over 240 h under the same atmosphere. This slow descent in temperature across T C was used to maximize the size of antiphase domains in the finished TEM foils. The annealed disks were subsequently thinned using standard TEM specimen preparation; see Supplementary Material for details.
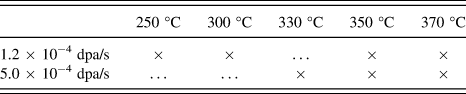
Foil specimens were irradiated at the IVEM-Tandem facility located at Argonne National Laboratory using a 500 keV Ne+ beam projected into the in situ Hitachi 9000 TEM (Hitachi High-Technologies Corporation, Tokyo, Japan).14 Ion fluxes were varied from 3.0 × 10¹¹ ions/(cm2 s) to 1.3 × 10¹² ions/(cm2 s). SRIMReference Ziegler15 damage calculations showed that these ion fluxes correspond to average dose rates of 1.2 × 10⁻⁴ dpa/s and 5.0 × 10⁻⁴ dpa/s, respectively. The local dose rate increases slowly across the specimen thickness, varying about ±20% from the average dose rate. The foils were heated to temperatures ranging from 250 to 370 °C (i.e., 64–94% of T C) using a Model 652 double-tilt, heating stage from Gatan (Gatan, Inc., Pleasanton, CA) with an accuracy of ±5 °C. Irradiation conditions for the foils are summarized in Table I.
Summary of irradiation temperatures and fluxes.

Diffraction analysis was carried out using a variation of the powder X-ray method developed by Wilchinsky.Reference Wilchinsky16 Here, the long-range order parameter is calculated from the relative, integral intensities of fundamental, I f, and superlattice, I s, reflections using
 $${S^2} = {{{{\left( {{{{I_{\rm{s}}}} \over {{I_{\rm{f}}}}}} \right)}_S}} / {{{\left( {{{{I_{\rm{s}}}} \over {{I_{\rm{f}}}}}} \right)}_{S = 1}}}}\quad ,$$
where the denominator represents the same reflections measured at near perfect long-range order. (This normalization accounts for differences in absorption effects in different samples.) While kinematic scattering theory is used for X-ray diffraction and is the basis for the intensity-structure factor-order parameter relationship underlying Eq. (4), electron diffraction intensities typically require dynamical scattering theory. We avoided this complication by tilting the samples out of a strongly diffracting condition, weakening the excitation of the reflections used for I f and I s and creating essentially kinematic conditions. It was vital, however, that the excitation errors of these reflections remain equal, as diffracted intensity falls off with increasing distance between Bragg position and Ewald sphere.
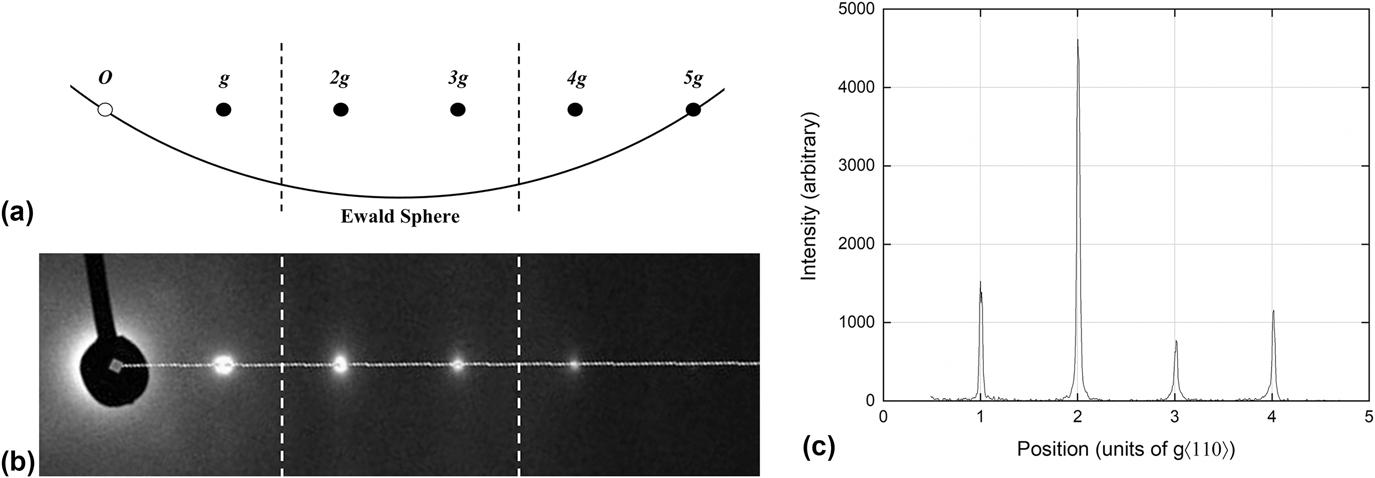
Measurements of long-range order were conducted using the diffracted intensities of reflections from the 110 family: 220 (“2g”) for the fundamental I f and 330 (“3g”) for the superlattice I s. The foils were aligned, as described above, by tilting the sample to form a systematic row of 110 reflections, followed by tilting the electron beam until the 2g and 3g excitation errors were equal [see Fig. 1(a)]. Periodic checks of the alignment were performed during irradiation using the position of the 2g Kikuchi bands [see Fig. 1(b)] and by comparison to a saved beam-tilt condition exciting the transmitted beam and 2g reflection. Diffractograms and intensity profiles along the systematic row [see Fig. 1(c)] were recorded before, during, and after each irradiation at a rate of 15 frames per second. Data analysis is described in the Supplementary Material.
Diagrams of the 110 systematic row during alignment and measurement. (a) Schematic relationship between the row and the Ewald sphere. The locations of the ±2 g Kikuchi bands have been marked by vertical, dashed lines. (b) Region of a recorded diffractogram with vertical, dashed lines marking the corresponding locations of the ±2 g Kikuchi bands and the horizontal, dashed line indicating the line profile location. (c) Profile of diffracted intensity along the 110 systematic row.

III. RESULTS
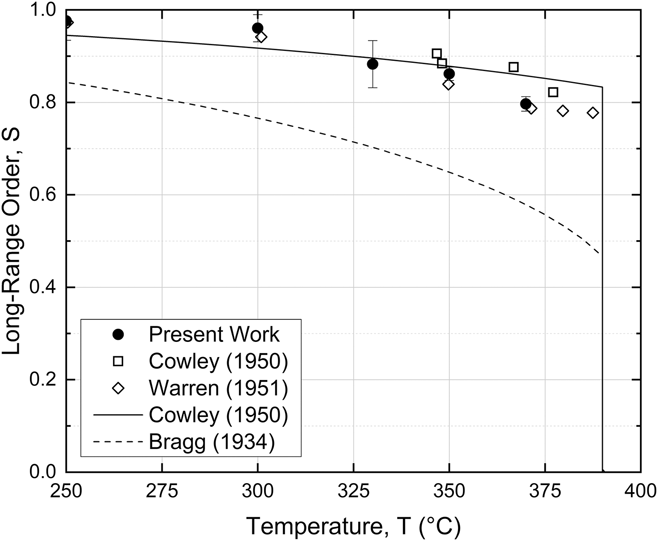
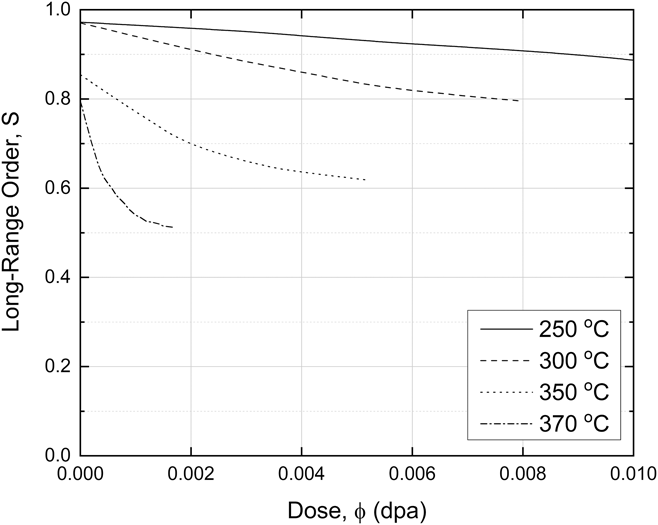
Long-range order measurements on our foil specimens under equilibrium conditions are shown in Fig. 2. The consistency of these data with previously reported measurements using X-ray diffractionReference Cowley17,Reference Keating and Warren18 and with the Cowley model for thermal order in Cu3AuReference Cowley19 lends support for the reliability of the method used here. The effect of irradiation on long-range order is shown as a function of dose ϕ in Fig. 3 for a dose rate of 1.2 × 10⁻⁴ dpa/s. At the lowest temperature, 250 °C, the specimen slowly disorders, but it does not reach a steady state at the end of the irradiation, ∼0.015 dpa. As the temperature is increased, however, the initial decrease in S becomes noticeably more rapid, and at the highest temperatures, a saturation level of disorder is approached by ∼0.002 dpa. Note that the saturation value of S, ∼0.5, is far smaller than its equilibrium value at T C, ∼0.8. At the completion of the irradiations, the ion beam was switched off and the recovery of S was monitored. These data are provided in the Supplementary Material, and for irradiations at 350 and 370 °C, see Fig. S5. At these two temperatures, the relaxation time is ∼102 s. This value agrees very well with those measured, more precisely, using pulsed irradiations and electrical resistivity measurement.Reference Wei, Lee, Averback and Flynn8 This relaxation time therefore explains the saturation of S at 370 °C after a dose of ∼0.001 dpa, which accumulates after some tens of seconds (i.e., dS/dt = κεS − ΔS/τ, where ΔS = S − S eq). This is significant because it demonstrates that the recovery of disorder during these irradiation experiments, at least the higher temperature data, is primarily due to equilibrium vacancies (i.e., we may neglect recovery arising from the excess point defects for these irradiation conditions). This will be discussed in more detail below.
Long-range order S at thermal equilibrium as a function of temperature. Electron diffraction measurements from the present work are presented alongside X-ray diffraction data from CowleyReference Cowley17 and WarrenReference Keating and Warren18 as well as the oft cited approximations of CowleyReference Cowley19 and BraggReference Bragg and Williams11,Reference Williams12 (“Bragg–Williams”) for comparison.

Evolution of long-range order S with increasing dose ϕ for several irradiation temperatures. Irradiation at 250 °C does not lead to a steady state of order within the duration of the experiment, ∼0.015 dpa, while such states are reached for all other irradiation temperatures.

We next turn to the primary finding of this study, which concerns the initial disordering rates  ${\left. {{{{\rm{d}}S} / {{\rm{d}}t}}} \right|_0}$. As t → 0, Eq. (1) illustrates that S → S eq and that the ordering term vanishes. Thus
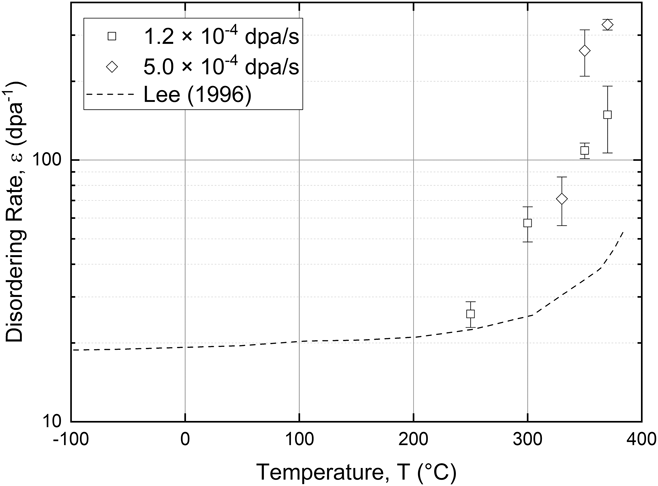
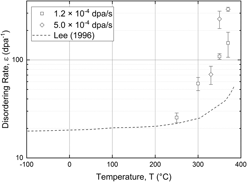
 $\left( {{{\left. {{{{\rm{d}}S} / {{\rm{d}}t}}} \right|}_0}} \right){\left( {\kappa {S_{{\rm{eq}}}}} \right)^{ - 1}} \to \varepsilon$, and the disordering per dpa can be measured directly from the initial slopes of disordering curves, such as those in Fig. 3. (We validate this simplification for irradiation at 370 °C, the highest temperature investigated, by comparing the measurement period of S, 0.07 s, with the rate of recovery of disorder. As noted above, the relaxation time for recovery after irradiation at 370 °C is ∼102 s, and hence recovery will be negligible during the first few seconds of irradiation.) The disordering rates ε are plotted as a function of temperature in Fig. 4; the dashed line in this figure represents the disordering rates deduced from the resistivity data of Lee.Reference Lee10 While the electron diffraction data suggest some sensitivity to the irradiation flux above 330 °C, confirmation of any trend would require testing at more fluxes and would contradict observations from the resistivity data, see Fig. S3. Those measurements, performed at many irradiation fluxes, showed no sensitivity in the disordering per dpa to flux, only to irradiation temperature. The resistivity data in Fig. 4, moreover, show that
 ${\left. {{{{\rm{d}}S} / {{\rm{d}}t}}} \right|_0}$ is nearly independent of temperature between −80 and 250 °C, while both the resistivity and the new diffraction data show that it increases rapidly as temperatures approach T C. We emphasize that the resistivity data are only suspect above 250 °C, where they do not agree with X-ray diffraction data in determining the equilibrium state of order. The rapid increase in the high temperature disordering is quite unexpected since the defect production and atomic mixing processes in metals are generally assumed to be insensitive to temperature. MD simulation indeed show that the effect of temperature on Frenkel pair production is very small, increasing ∼25% in Fe between 100 and 900 K,Reference Gao, Bacon, Flewitt and Lewis20 while ion beam mixing in Cu increases only a factor of ∼2 between 223 and 423 °C.Reference Hsieh, Diaz de la Rubia, Averback and Benedek21 This latter work, moreover, overestimates the temperature dependence because the interatomic potential used underestimates the melting temperature of Cu by ∼200 °C.
Initial disordering rate ε as a function of irradiation temperature for 500 keV Ne+. Diffraction measurements for low and high irradiation flux are presented as separate points, while the dashed line shows electrical resistivity-based measurements by Lee.Reference Lee10 Note the rapid increase in ε for all data sets at temperatures approach T C (393 °C) as well as the insensitivity of the diffraction data to the irradiation flux.

IV. DISCUSSION
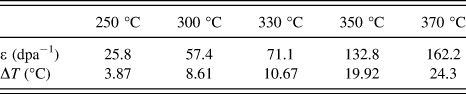
Considering the departure of the experimental results from our current understanding of ion beam mixing and disordering, we begin discussion of our results by exploring possible experimental artifacts. As shown above, the electron diffraction data agree well with X-ray measurements for the equilibrium state of order, and thus, unlike the resistivity measurements, we discount possible systematic errors in the measurement of disorder. A second potential error concerns ion beam heating of the sample, a common problem in ion irradiation experiments. A rise in temperature when the beam is switched on, for example, would itself cause a decrease in S, see Fig. 2, and yield, incorrectly, an enhanced disordering rate. We discount this possibility for several reasons: (i) Under irradiation at 370 °C, S saturates far below the lowest value of S eq, which is reached at T C (see Figs. 3 and 2, respectively), illustrating that beam heating cannot be the principle driving force for disorder. (ii) The increasing beam heating required to produce the measured disordering rates, listed in Table II, is inconsistent with the weak temperature dependence of S eq or with the small, ∼30%, decrease in the thermal conductivity of Cu3Au between 260 and 370 °C. (iii) Calculations of the steady state beam heating, see the Supplementary Material, show that beam heating of our foil specimens is less than the systematic error of the heating stage (±5 °C) and thus negligible.
Beam heating ΔT required to reproduce disordering rates ε from temperature alone.

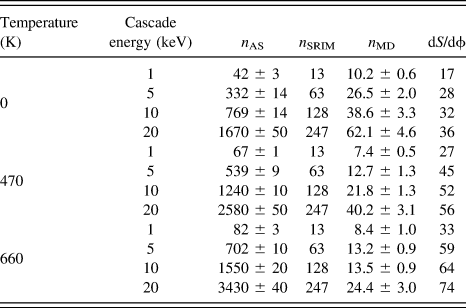
We next confirm our expectation that the disordering process within cascades is indeed insensitive to temperature by calculating the disordering rates in Cu3Au at 0, 470, and 660 K using MD simulations. Computational details for these simulations can be found in the Supplementary Material and in Ref. Reference Nordlund, Ghaly and Averback22. Results for the creation of antisite defects on the Au sublattice, n AS, are reported in Table III for several cascade energies, and they show that the disordering from cascade mixing increases weakly with temperature, less than ∼30% between 197 and 387 °C. Table III also lists values of dS/dϕ = (dS/dt)/κ for the different cascade energies; we convert antisite defect production in Cu3Au to disordering rates using dS/dϕ = n AS/(X CuX Aun SRIM) = 16n AS/(3n SRIM). The value of n AS comes from the MD results in Table III, while n SRIM is the number of Frenkel pairs obtained using SRIM for consistency with the dpa calculation used in the analysis of the experiments. For completeness, however, we include both n SRIM and the number of Frenkel pairs obtained using MD, n MD, in Table III. Averaging the disordering rates over the primary recoil spectrum and assuming that subcascades occur for energies greater than 20 keV, we obtained a primary recoil spectrum-averaged disordering rate of 〈dS/dϕ〉pka ∼ 40 at 200 °C, in reasonable agreement with the experiments. These simulations are thus significant, as they indicate that the low temperature disordering rates are reasonably explained by cascade mixing, while the high temperature disordering rates must arise from some additional mechanism.
Summary of MD simulations on disordering in Cu3Au, including: antisite production n AS, defect production n MD (with SRIM results n SRIM for comparison), and disordering rate dS/dϕ.

In considering possible mechanisms for the enhanced disordering near T C, we first dispense those focused on recovery. The electrical resistivity data shown in Fig. 4 illustrate that  ${\left. {{{{\rm{d}}S} / {{\rm{d}}t}}} \right|_0}$ is nearly independent of temperature between 80 K, where no recovery is possible, and 250 °C. This suggests that little recovery takes place during the time of the measurements over the entire temperature range. Indeed, at 80 K, only interstitial atoms are mobile, and the large size difference between Au and Cu atoms prevents the formation of mixed dumbbell interstitials and hence any accompanying contribution to ordering in Cu3Au.Reference Brinkman, Dixon and Meechan23 Above 50 °C, vacancies are mobile, and those excess vacancies introduced during disordering could possibly assist in reordering. The result that
 ${\left. {{{{\rm{d}}S} / {{\rm{d}}\phi }}} \right|_0}$ remains nearly independent of temperature up to 250 °C, however, contradicts this hypothesis, and we thus exclude the possibility that the high temperature disordering rates are associated with some recovery process that is a decreasing function of temperature. Stated more simply: if the unusual temperature dependence was controlled by recovery mechanisms, then the disordering rate at 80 K should be the largest.
Since the production of antisite defects in cascades does not explain the observed increase of  ${\left. {{{{\rm{d}}S} / {{\rm{d}}\phi }}} \right|_0}$ with temperature, we explore how vacancies produced within the cascade might possibly underlie this finding. We first point out that although recovery processes are slow on the time scale of the experiments, vacancies, themselves, are highly mobile above 250 °C. At 250 °C, for example, the vacancy diffusivity in Cu3Au is ∼105 nm2/s.Reference Lee, Flynn and Averback24 This implies that the lifetimes of excess vacancies within the TEM foils are ∼10−2 s, and thus their effect on order in these experiments can only be inferred and not monitored in real time. It also illustrates why we attributed recovery of order in samples irradiated at 370 °C to equilibrium vacancies as the time constant for recovery was some tens of seconds, far too long for the point defect supersaturation to remain. We now consider the opposite possibility that disorder is in fact created by vacancy diffusion. Specifically, we consider a mechanism akin to radiation-induced segregation, whereby fluxes of point defects couple to solute atoms in solution and drag them to point defect sinks. Here, we consider whether vacancy fluxes can couple to S, a nonconserved order parameter, to create nonequilibrium disorder. The two important aspects are (i) how much free energy is available to drive the system away from equilibrium and (ii) how defect fluxes couple to the system of order (i.e., the transport mechanism).
The introduction of irradiation damage to an ordered alloy adds free energy by producing both local chemical disorder and point defects. For 500 keV Ne+ irradiation of Cu3Au, the point defects are created in energetic displacement cascades and not randomly (as for electron irradiation), such that the excess free energy from vacancies is given by
 $$\Delta {F_{\rm{v}}} = {n_{{\rm{mv}}}}kT\ln \left( {{{C_{{\rm{cas}}}^{\rm{v}} + C_{{\rm{eq}}}^{\rm{v}}\left( T \right)} \over {C_{{\rm{eq}}}^{\rm{v}}\left( T \right)}}} \right)\quad ,$$
where n mv is the number of mobile vacancies introduced by the cascade,  $C_{{\rm{cas}}}^{\rm{v}}$ is the supersaturation of vacancies within the cascade, and
 $C_{{\rm{eq}}}^{\rm{v}}$ is the equilibrium concentration of vacancies at temperature T. For simplicity, we approximate the vacancy distribution within the cascade as Gaussian, i.e.,
 $C_{{\rm{cas}}}^{\rm{v}} = {n_{{\rm{mv}}}}{\left( {4\pi \tau } \right)^{{{ - 3} / 2}}}\exp \left( {{{ - {r^2}} / {4\tau }}} \right)$, where τ = D vt, and D v and t are the vacancy diffusivity and time, respectively. Free energy becomes available to create antisite defects as vacancies diffuse outward from the cascades according to
 $$\Delta {F_{\rm{v}}}\left( T \right) = kT{D_{\rm{v}}}\int {{\rm{d}}t\int {{\rm{d}}{\bi{r}}{{{{\left[ {\nabla {C_{\rm{v}}}\left( {{\bi{r}},t} \right)} \right]}^2}} \over {{C_{\rm{v}}}\left( {{\bi{r}},t} \right)}}} } \quad .$$
The initial radius of the cascade, rcas, is estimated by noting that the characteristic cascade energy, denoted as T 1/2, is ∼8 keV for 500 keV Ne+ bombardment of Cu3Au (i.e., half of the Frenkel pairs are produced in cascades with recoil energies >8 keV, and half from recoils <8 keV; see Ref. Reference Averback, Benedek and Merkle25 for details). From our MD simulations (see the Supplementary Material, Fig. S7), we find r cas ∼ 3 nm for 8 keV cascades. We use n mv ∼ 0.15n SRIM (see Ref. Reference Wei, Lang, Flynn and Averback26 for details); for 8 keV cascades, n SRIM ∼ 100. Because excess vacancies and interstitials produced in cascades at 370 °C are lost predominantly at the specimen surface, the maximum radius of diffusion is roughly half the foil thickness, r exp ∼ 125 nm. To determine whether this excess free energy is sufficient for the creation of the observed disorder, we next quantify the opposing energetic penalty for creating disorder, ΔF S.
The free energy cost of local disorder can be approximated by an expansion of the free energy with respect to S. Here, we use Cowley’s model for thermal order in Cu3AuReference Cowley19:
 $${{\partial {F_{{\rm{mix}}}}} \over {\partial S}}\left( {S,T} \right) = \log \left[ {{{\left( {1 + 3{S^2}} \right)\left( {3 + {S^2}} \right)} \over {3{{\left( {1 - {S^2}} \right)}^2}}}} \right] - {{16{T_{\rm{C}}}} \over {3T}}{S^2}\quad .$$
The selection of Cowley’s model over, for example, the BW approximation is 2-fold. First, the equilibrium measurements of long-range order presented here are in better agreement with Cowley’s model than BW (Fig. 2). Second, the free energy well surrounding the equilibrium order S eq is deeper in Cowley’s model than in BW. This larger curvature ultimately leads to a more conservative estimation of ΔF S. Using a second order expansion, the change in free energy for initial deviations from S eq can be written as
 $$\Delta {F_{\rm{S}}}\left( {\Delta S,T} \right) = \alpha {n_0}kT{\left( {\Delta S} \right)^2}\quad ,$$
where
 $$\alpha = {{{S_{{\rm{eq}}}}} \over {16}}\left[ {{9 \over {1 + 3S_{{\rm{eq}}}^2}} + {3 \over {3 + S_{{\rm{eq}}}^2}} + {6 \over {1 - S_{{\rm{eq}}}^2}} - 16{{{T_{\rm{C}}}} \over T}} \right]\quad ,$$
n 0 is the atomic density of Cu3Au, ΔS is the local deviation from equilibrium order, and ΔF S is in terms of energy per volume.
Combining these expressions for ΔF v and ΔF S, the incremental disordering can be calculated for a given r and τ in terms of the local order parameter
 $$\Delta S\left( {{\bi{r}},\tau } \right) = {\left[ {{1 \over {\alpha {n_0}}}{{{{\left( {\nabla C} \right)}^2}} \over C}{\rm{d}}\tau } \right]^{{1 / 2}}}\quad ,$$
or—more conveniently—in terms of antisite defects
 $$\Delta {n_{{\rm{AS}}}}\left( {{\bi{r}},\tau } \right) = {3 \over {16}}{\left[ {{{{n_0}} \over \alpha }{{{{\left( {\nabla C} \right)}^2}} \over C}{\rm{d}}\tau } \right]^{{1 / 2}}}{\rm{d}}V\quad .$$
The total n AS per cascade is thus obtained by integrating Eq. (11) across r and τ.
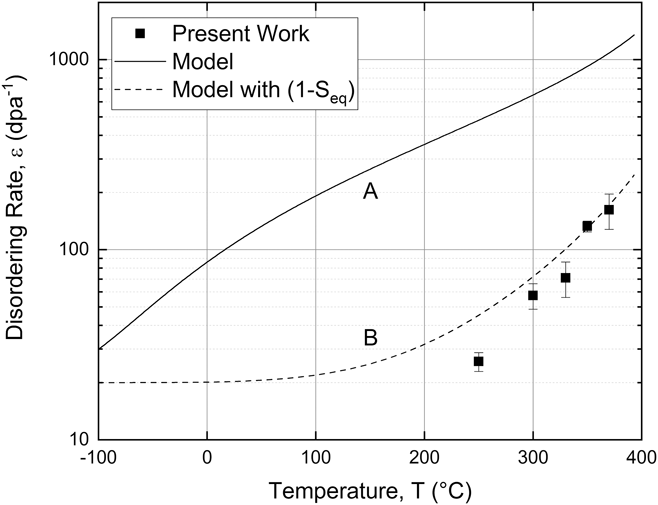
Once n AS is known, disordering rates for comparison to experiment can be calculated simply using  $\varepsilon = {{\left( {{{\left. {{{{\rm{d}}S} / {{\rm{d}}\phi }}} \right|}_0}} \right)} / {{S_{{\rm{eq}}}}}} = {{16{n_{{\rm{AS}}}}} / {\left( {3{n_{{\rm{SRIM}}}}{S_{{\rm{eq}}}}} \right)}}$. These calculated ε are at least 5 times larger than those found experimentally for temperatures above 200 °C, see curve A in Fig. 5, and demonstrate that sufficient free energy is generated by vacancy fluxes to account for the observed disordering. The temperature dependence for the calculated ε, however, is too weak to explain the experimental trend (a factor 2 increase versus 6). We reconcile this difference by considering how defect fluxes couple to create antisite defects, namely that vacancies must diffuse on the Au sublattice of Cu3Au. This process is roughly proportional to the degree of disorder,Reference Lee, Averback and Flynn9 and a correction of (1 − S eq) is thus applied to the calculated disordering rates. Accounting last for the (nearly) temperature independent creation of antisite defects in the cascades, ε ∼ 20, leads to remarkably good agreement between the model and our experimental measurements, see curve B in Fig. 5. While the close agreement is probably somewhat fortuitous, given the level of the model, it does provide strong support for our conclusion that vacancy fluxes can couple with the nonconserved order parameter and that this coupling can lead to a rapid increase in disordering rates as T C is approached during ion irradiation. We do not believe that experimental evidence for such coupling has been reported previously, but past theoretical studies have found that atom fluxes driven by gradients in the chemical potential can indeed influence chemical order.Reference Andersen and Mouritsen27–Reference Bellon and Martin29
Disordering rates ε as a function of irradiation temperature for the present work and as calculated from the free energy of outward vacancy diffusion from cascades. Curve A is calculated using ε = 16n AS/(3n SRIMS eq), where nAS is the antisite defect production per cascade from integration of Eq. (11), n SRIM is the Frenkel pair production per cascade from SRIM,Reference Ziegler15 and S eq is the thermal equilibrium, long-range order parameter at temperature T. Curve B is the product of curve A and the degree of disorder (1 − S eq), to account for the effect of Au sublattice diffusion on the temperature dependence of ε.

V. CONCLUSIONS
This study has reported on the initial rates of irradiation-induced chemical disordering in Cu3Au as a function of temperature. It was demonstrated that the disordering rate increases rapidly with temperature as the order–disorder temperature is approached. MD simulation indicates that this finding is not a consequence of the temperature dependence of ion beam mixing in the cascades. A simple model based on a coupling between vacancy fluxes and long-range order was proposed, and—given the approximate nature of the model—it provides good agreement with the experiments. The study is also notable for demonstrating that in situ electron diffraction measurements on ion-irradiated, ordered alloys provide a powerful means to probe the kinetics of order–disorder behavior at elevated temperatures.
Supplementary Material
To view supplementary material for this article, please visit https://doi.org/10.1557/jmr.2018.308.
ACKNOWLEDGMENTS
One of the authors (RSA) wishes to acknowledge that many of the ideas found in the interpretation of this work derived from a collaboration between a Ph.D. student (Y.S. Lee), who could not be located during the writing of this manuscript, and his advisors, Prof. C.P. Flynn (now deceased) and RSA; these critical contributions are found in Ref. Reference Lee10. Another of the authors (CRL) wishes to acknowledge R. McAuliffe and Prof. D. Shoemaker at the University of Illinois at Urbana-Champaign (UIUC) for their assistance with sample heat treatments and A. Long at UIUC for stimulating conversations regarding image and data analysis. The present work was carried out with support from the U.S. Department of Energy (DOE), Office of Science, Office of Basic Energy Sciences under Contract No. DEFG02-05ER46217. Sample preparation and initial characterization were carried out in part in the Frederick Seitz Materials Research Laboratory Central Research Facilities, UIUC, with additional preparation work at the Center for Nanoscale Materials, an Office of Science user facility, supported by the DOE, Office of Science, Office of Basic Energy Sciences, under Contract No. DE-AC02-06CH11357. The in situ electron microscopy during ion irradiation was accomplished at Argonne National Laboratory at the IVEM-Tandem Facility, a DOE Facility funded by the DOE Office of Nuclear Energy, operated under Contract No. DE-AC02-06CH11357 by UChicago Argonne, LLC. Grants of computer time from the CSC - IT Center in Espoo, Finland, are gratefully acknowledged.