The 1940s was a period of rapid wage convergence between Black and white workers in the United States. The ratio of Black to white weekly wages rose by 24 percent between 1940 and 1950, accounting for 37 percent of the overall racial wage convergence from 1940–1980 (Margo Reference Margo1995). A potential cause of this convergence was the expansion of public health programs. Footnote 1 Cohorts entering the labor market in this period had been exposed as children to public health interventions, such as malaria and hookworm eradication programs, and the provision of clean water and sewerage services, which may have raised their human capital and (future) income. This paper explores the role of malaria eradication in explaining the Black-white wage convergence.
Previous literature has linked health interventions in the United States to rising white male productivity (Bleakley Reference Bleakley2007). However, data limitations have largely prevented earlier work from studying the impact of these interventions on Blacks. Footnote 2 Public health provision is singular among human development programs for two reasons. First, unlike education policies such as mandatory schooling laws, the network effects of certain diseases mean that efforts to eradicate them have to be broadly applied across both majority and minority groups to be effective. Footnote 3 Second, diseases such as malaria usually disproportionately affect minority groups, as they have limited access to quality health care and live in worse housing conditions, on average. Minorities may therefore asymmetrically benefit from the targeted eradication of these diseases.
We study what impact malaria eradication programs had on the Black-white wage convergence seen in the 1940s. Up until the late 1800s, malaria remained a serious health problem in the United States. In 1890, around 21 deaths per 1,000 nationwide were a result of malaria, and most cases were concentrated in the South. Beginning in 1920, the United States launched a large-scale malaria eradication program focused on the South. Activities conducted under the program included larval control, screenings, and the administration of medicine. The intervention was highly successful; during the 1920s, malaria mortality in the South fell by more than 60 percent.
We find no evidence that the campaign was targeted specifically towards whites. In fact, anecdotal evidence suggests that public health authorities understood the importance of a widespread application of the treatment, and in some cases, actively tried to inform whites about the economic importance of having access to a healthy Black workforce. Though consistent data on the timing and intensity of malaria control efforts is unavailable for our setting, we find qualitative evidence that malaria campaigns were first launched in the most malarious counties, which often also had a significant Black population.
The impact of malaria eradication on productivity gaps is ex-ante ambiguous. While health benefits to eradication might have benefited Blacks as much as whites, Blacks may have been unable to fully realize human capital gains from their improved health due to race-specific barriers in education and labor markets.
We estimate the effect of malaria eradication on schooling and income through a difference-in-differences design. In particular, by matching individuals in 1940 to their earliest census, we can exploit spatial variation in exposure to pre-eradication malaria mortality at the county level across the U.S. South. We also use variation in the length of a childhood spent exposed to eradication to construct a cohort-level treatment measure. Our empirical estimates compare outcomes for cohorts born in malarious areas closer to the start of the eradication program to older cohorts born in the same areas, relative to this difference for individuals born in less malarious areas.
Our paper finds the following baseline results: increased exposure to the malaria eradication program was associated with higher schooling attainment and higher incomes for whites. The same benefits did not accrue to Blacks. Specifically, a one standard deviation increase in malaria exposure was associated with a 1 percentage point increase in the probability of middle school completion for whites born after the eradication program. We find no such significant changes in schooling for Blacks. Consequently, the Black-white schooling gap widened as a result of the intervention. Similar to the result for schooling, the income gains only accrued to whites, with Black income negligibly impacted.
The finding that malaria eradication widened racial gaps in schooling and income is unique relative to the literature. Previous studies have found that historical health interventions in the United States either reduced racial and gender gaps or left them unaffected (Barreca Reference Barreca2010; Bleakley Reference Bleakley2007). Most of these papers are only able to exploit state-level variation in disease endemicity, and as such, cannot control for broader racial convergence in socioeconomic outcomes between relatively poorer (disease-afflicted) and richer (disease-free) states. Our results may also be distinct from the literature as Black males’ labor force participation rates were already high prior to the onset of malaria eradication, thus ruling out labor market entry effects from improved health such as those measured for women (e.g., Adhvaryu et al. Reference Adhvaryu, Bednar, Molina, Nguyen and Nyshadham2020). Programs specifically targeted towards Blacks during the 1920s were effective in reducing Black-white schooling gaps in the South (Aaronson and Mazumder Reference Aaronson and Mazumder2011); however, malaria campaigns were broadly applied and thus were likely unable to produce similar convergence results.
Even though treatments were broadly applied, Blacks were likely unable to benefit from disease eradication campaigns due to extreme racial segregation in the labor market. In particular, we are focusing on the South during the Jim Crow era. Prior to the 1964 Civil Rights Act, employment discrimination was legal, and job listings targeted specific races. One possibility is that becoming healthier (and more productive) does not mean much in terms of employment and wages when minorities face rampant discrimination throughout the labor market.
We consider occupational changes associated with the eradication program and find that exposed Blacks were much more likely to be farm laborers and less likely to work in a blue-collar job. We do not find any evidence that Blacks were able to shift into higher-earning occupations, which aligns with their (lack of) results for schooling.
Malaria eradication programs occurred alongside the Great Migration, and indeed we find younger individuals in more malarious areas were more likely to have migrated from their county (or state) of birth. We find that schooling and income gains for white migrants overpowered any gains for Black migrants at the county level. Though not precisely estimated, we find suggestive evidence that in the sample of out-of-state migrants, exposed Blacks experienced larger income gains than exposed whites.
We test whether the null schooling result for Blacks is driven by (lack of) access to schooling as well as differences in school quality and find that this is not the case. We proxy for the former with a measure of exposure to schools built under the Rosenwald Rural Schools Initiative, a far-reaching education program launched in 1913 that built schools in the South specifically for rural Black children. We proxy for school quality using county-level Black teacher-student ratios. We do not find a statistically meaningful improvement in Black years of schooling using either proxy.
Our results are robust to a variety of alternative specifications. In particular, our results do not depend on the specific functional forms chosen to determine exposure to malaria eradication programs or our choice of dependent variables. Our results do not depend on our baseline matching. Becoming more or less strict in the matching algorithm and using inverse probability weights to account for non-random matching yields similar results to our baseline.
Our null schooling and income results for Blacks cannot be explained by racial targeting of the eradication programs. We include time-varying controls for a county’s fraction Black population to address any targeting of white majority areas in eradication efforts. Our schooling results are highly robust to this modification. The results for our preferred income measure are somewhat attenuated, but results for reported earnings continue to show significant income gains for whites. We also do not find any pattern in our results across segregation levels that would suggest malaria eradication programs were biased towards whites.
In addition, our results cannot be explained by a concurrent shock to agricultural production. As the arrival of the boll weevil, a cotton pest, occurred around the same time as malaria eradication programs, we investigate the robustness of our results to the inclusion of various measures of a county’s cotton production and find our results cannot be explained by this concurrent shock.
Our paper is linked to three broad strands of the existing literature. First, our paper speaks to work on the linkages between health and productivity. In the U.S. context, the general linkages between malaria eradication in the South and productivity gains have been well documented. Footnote 4 Bleakley (Reference Bleakley2010) focuses on a sample of white males and finds large income gains associated with malaria eradication. Footnote 5 Barreca (Reference Barreca2010) studies all individuals born in the South between 1900 and 1936 and finds that in utero and postnatal exposure to malaria reduces both schooling attainment and income, though the authors’ income results are not precisely estimated. Other papers, such as Hong (Reference Hong2007, Reference Hong2011, Reference Hong2013) look at impacts of malaria (and its eradication) on health and productivity, finding large benefits from eradication across both dimensions.
Our work builds on this literature by extending the analysis to investigate differential impacts by race. The previous literature has been unable to provide convincing analysis on racial gaps due to a lack of data. In particular, both Bleakley (Reference Bleakley2010) and Barreca (Reference Barreca2010) use state of birth variation in exposure to malaria endemicity. These papers either remove Blacks from the sample (as in Bleakley (Reference Bleakley2010)) or do not precisely measure the differential effects of malaria eradication by race (as in Barreca (Reference Barreca2010)). Footnote 6 The papers are also unable to flexibly control for confounders in the form of concurrent state-specific shocks or broader racial convergence between poorer and richer states. By contrast, we use a finer source of data to provide a thorough analysis of the differential effects by race.
Second, this paper is also related to a rich literature studying racial differentials in education and income in the United States. In particular, Card and Krueger (Reference Card and Krueger1992), Collins and Wanamaker (Reference Collins2014), and Margo (Reference Margo1995) study racial wage convergence at various points in time during the twentieth century. Ashenfelter, Collins, and Yoon (Reference Ashenfelter, Collins and Yoon2006), Carruthers and Wanamaker (Reference Carruthers2017), Lee (Reference Lee1999), and Smith and Welch (Reference Smith1989) focus on inequalities in education and wages.
Finally, our work is also connected to the literature that ties health innovations to changes in the levels of inequality. Some papers in this literature find that new health technologies may contribute to decreased inequality between a majority and minority group (e.g., Albanesi and Olivetti (Reference Albanesi and Olivetti2016) and Goldin and Katz (Reference Goldin and Katz2002)), while others find increased inequalities (e.g., Jayachandran, Lleras-Muney, and Smith (Reference Jayachandran, Lleras-Muney and Smith2010)).
Our work contributes to the above areas of literature by focusing on a health innovation that was broadly applied. While the literature trying to understand what drives education and wage differentials is abundant, there is limited work connecting what role health interventions play in widening or closing such gaps. Health is often considered the “great equalizer,” but there is limited evidence that a health benefit that is applied broadly has identical impacts across types. We provide evidence that even if a health innovation is provided in a non-discriminatory way, there may still be divergence in schooling and income, suggesting health on its own is not sufficient to reduce inequalities.
BACKGROUND
Malaria in the United States
Malaria is a vector-borne parasitic disease that thrives in warm, tropical climates and is acutely detrimental to human health. The disease is spread by the female anopheles mosquito, which transfers malaria parasites from an infected to an uninfected human via a blood meal. The main parasitic organisms prevalent in the United States were vivax and falciparum. Symptoms of the disease include fevers, chills, headaches, and in some cases, death. Continued infection with malaria parasites is also associated with chronic health problems, such as an enlarged spleen, anemia, and lethargy. Young children, pregnant women, and immuno-suppressed individuals are at a particularly high risk of contraction.
Malaria was endemic in the United States in the 1800s and remained prevalent in the Southern region of the country until well into the beginning of the twentieth century. In 1850, more than 45 out of 1,000 deaths in the United States were attributable to malaria. By the early 1900s, however, malaria cases were largely concentrated in the U.S. South. The Mississippi and Yazoo River delta regions were especially conducive to mosquito breeding, as they contained swampy land and stagnant water bodies. A second malaria belt existed along the Atlantic coastal plain in the low-lying areas of the Carolinas, Northern Florida, and Alabama.
In addition to climatic factors, the spread and severity of malaria were closely linked to underlying socioeconomic conditions and certain occupations. Malaria endemicity increased with poverty; poorer individuals were more likely to live in densely populated areas, reside in lower quality houses, be malnourished, and have comorbidities that render them more susceptible to the disease. Tenant farmers working on cotton plantations were also particularly vulnerable to malaria, as cotton was a labor-intensive crop that grew in weather conditions where mosquitoes thrive.
Malaria Eradication Programs
The scientific understanding of malaria and its transmission greatly expanded in the late 1800s and early 1900s, when it was discovered that the disease is spread by mosquitoes. U.S. government authorities launched initiatives to eradicate vector-borne diseases during their involvement in Cuba and the Panama Canal Zone in the early 1900s. Walter Reed, a U.S. Army doctor, set up an experimental camp in Cuba in 1900 and discovered that yellow fever is transmitted via mosquitoes. Drawing from these findings, William Gorgas launched a mosquito eradication program that eliminated yellow fever from Havana in 1902. As the chief sanitary officer of the Panama Canal Commission from 1904–1913, Gorgas also undertook a similar eradication effort in the Canal Zone that involved drainage, window screening, the administration of quinine, and the killing of adult mosquitoes. This initiative eliminated yellow fever and reduced malaria cases in the Canal Zone by up to 80 percent.
Leveraging the scientific knowledge generated by U.S. Army doctors, the U.S. Public Health Service (USPHS) became involved in malaria control in the 1910s in partnership with the Rockefeller Foundation’s International Health Board (IHB). Both organizations launched targeted malaria eradication studies in the U.S. South. Eradication methods that were piloted included the use of larvicide, mass administration of quinine, and drainage activities. These interventions were highly successful; in 1916, a “quinine sterilization” program in highly malarious Bolivar County, Mississippi, reduced malaria infection by 90 percent.
United States entry into WWI in 1917 saw federal involvement in malaria control efforts, paving the way for state-led eradication campaigns. During the war, the government conducted draining and larvicide operations at various Southern military training camps and their neighboring towns. At the end of the war, the IHB worked with the men trained in these activities to undertake malaria control demonstrations to publicize malaria reduction techniques with state authorities. In the 1920s, states’ boards of health significantly ramped up the IHB/USPHS model and began large-scale eradication efforts across the South. These initiatives were highly successful; malaria mortality in the South declined by 60 percent in the 1920s. Footnote 7 We now turn our attention to the racial aspects of these eradication campaigns.
Malaria and Race
In reviewing the literature on malaria eradication programs, we find no evidence that the programs targeted white populations while neglecting to treat Blacks. If this were the case, then we would unsurprisingly expect health and productivity gains to be entirely concentrated among whites.
Anecdotal evidence suggests that doctors and public health officials during the early 1900s were aware of the network effects of diseases and understood the importance of a broad application of treatment. At the time, Blacks lived in close proximity to whites, employed, for instance, as domestic staff or farm laborers. A healthy Black population, therefore, had direct consequences for the well-being of whites. Southern physicians underscored this fact, with a New Orleans doctor stating, “We in the far South cannot afford to ignore the problem of the health of the negro” (Humphreys Reference Humphreys2001, p. 60).
Even when health-based segregation may have been feasible, authorities were hesitant to separate Blacks vulnerable to malaria from richer whites. Malaria endemicity was linked more closely to underlying socioeconomic conditions rather than to race. Any effort to create a “malaria free zone” (as was done in European colonies in Africa) would have required segregating poorer whites in addition to Blacks. Southern leaders wary of white populism were naturally reluctant to take such an action.
Southern whites also had an economic interest in improved Black health outcomes. Black farm tenants, in particular, were an important and cheap source of labor for whites. This incentive is shown in Figure 1, which depicts an educational cartoon used by the Georgia State Board of Health in 1923. The cartoon shows a white male carrying a bale on his shoulders. Atop the bale sits a Black male being stung by a mosquito. According to the CDC, the cartoon was used to plead with white farmers to provide adequate housing to their Black workforce. If they do not, the cartoon would suggest, they will face “The Southern Farmer’s Burden”: a sickly and unproductive source of cheap labor.
GEORGIA STATE BOARD OF HEALTH EDUCATIONAL CARTOON
Notes: This figure was used by the Georgia State Board of Health in 1923 to educate white farmers on the importance of providing clean living conditions for farm labor.
Source: HHR, “Southern Farmer’s Burden-malaria mosquito/sick labor: USPHS 1923 cartoon,” Georgia State University Library Exhibits, accessed August 16, 2021, http://exhibits.library.gsu.edu/current/items/show/417. Courtesy of National Archives and Records Administration, College Park, MD, photo no. 90-G-22-4.

Evidence from early eradication experiments led by the USPHS and the IHB further suggests that health authorities did not exclusively treat whites. In fact, some of the most malarious areas selected for these studies also had significant Black populations. For instance, Bolivar county, chosen for the quinine program outlined in the previous section, was 75 percent Black at the time of the study. Malaria reduction efforts in the South during the early twentieth century also took place in the broader context of several other public health initiatives, most of which did not (or could not) discriminate by race. For instance, Troesken (Reference Troesken2002) shows that Blacks living in Southern cities during Jim Crow still received water and sewerage services since it was infeasible to exclude the Black population from receiving these public goods without also adversely impacting urban whites.
Southern health authorities do not appear to have targeted white-majority areas once they scaled up malaria programs, despite their intense hostility towards Blacks in the Jim Crow era. We are unable to test directly for possible racial discrimination in the timing and intensity of malaria eradication, as county-level data on malaria programs are not consistently available. However, we search for language related to malaria eradication in Southern newspaper articles published in the 1920s and find that malaria control initiatives were targeted towards the most disease-afflicted counties that often also had a disproportionately high Black population. In Alabama, a U.S. health official visited five counties in 1921 to advise authorities on malaria control activities; the fraction Black population in these counties was 45 percent compared to a state average of 43 percent.Footnote 8, Footnote 9 Similarly, in North Carolina, the IHB expanded malaria control efforts in Lenoir and Pamlico counties. The counties’ Black population, at 45 percent and 38 percent, respectively, was well above the statewide figure of 32 percent. Footnote 10 More qualitatively, an article on churches published in several Southern newspapers in 1920 stated that “the best means of ridding the South of malaria” was to “Build negro churches in the open, cut out the underbrush near them and drain the surrounding pools. With that done, the problem will be simplified.” Footnote 11
From a health perspective, Blacks were particularly impacted by malaria and therefore stood to benefit more than whites from its eradication. The antebellum argument that Blacks were immune to malaria was no longer relevant at the turn of the twentieth century. In fact, underlying socioeconomic conditions during this period meant that Blacks were disproportionately vulnerable to the disease. Southern Blacks were more malnourished, had lower access to healthcare, and lived in more crowded and low-quality housing conditions relative to whites. Data from this period shows that both malaria morbidity and mortality were particularly high for Blacks. USPHS researcher Kenneth Maxcy reported in 1923 that Black schoolchildren in the Mississippi Delta were twice as likely to suffer from splenomegaly (a symptom of malaria) relative to white children (Humphreys Reference Humphreys2001). Using vital statistics records from 1919–1921 and 1939–1941, statistician Mary Gover found that malaria death rates for Blacks were in some cases between 9 to 12 times higher than those for whites (Humphreys Reference Humphreys2001).
Some recent evidence and our analysis on malaria eradication programs suggest that the programs had a larger or equal positive health impact for Blacks. Kitchens (Reference Kitchens2013) investigates the impacts of one particular malaria program conducted by the Works Progress Administration. His findings suggest that areas with more Blacks had larger reductions in malaria mortality. In addition, we conducted an informal analysis using WWII enlistment records to investigate the impact of early life exposure to malaria mortality on body mass index (BMI) levels. Footnote 12 Our results suggest similar health benefits for whites and Blacks. Footnote 13
DATA
Linked Census Data
To test whether malaria eradication programs had a differential impact on Southern Blacks and whites, we link a sample of Southern-born men in the 1940 census to the earliest census year in which they appear.Footnote 14 We first extract income, schooling, and demographic data from the 1940 full count census for all men born in the U.S. South, where “South” is the South Region as defined by the Census Bureau. Footnote 15 We use the 1940 census as this was the first census year where detailed information on years of schooling and wage income was collected. We limit our sample to the South for two important reasons. First, based on trends in malaria mortality and endemicity, it appears that malaria was largely a Southern phenomenon by the time eradication efforts began in earnest in the 1910s (see Online Appendix Figure A.1). Second, the vast majority of Blacks (around 90 percent) lived in the South in the early 1900s. During this period, Northern Blacks were a selected group of individuals who were on a different trajectory than Southern Blacks. In particular, the Southern economy, with a foundation rooted in slavery, created extreme barriers to economic mobility for Blacks. Including Northern-born Blacks as an implicit control group would therefore likely confound our results, as their income and schooling profiles followed a very different trend relative to Southern-born Blacks. We limit our analysis to males as name changes for females after marriage prevent us from matching them successfully. We further restrict our sample to include individuals between the ages of 23 and 57, corresponding to reported birth years between 1883 and 1917 in the 1940 census. This age restriction is consistent with standard working age assumptions.
Given the high levels of migration experienced by Southerners, particularly Blacks, during the period under consideration, it would be inaccurate to assume that an individual’s 1940 reported county of residence is their birth county when assigning malaria exposure at childhood. An alternative strategy would be to assign exposure based on the reported state of birth. However, this coarser approach would not capture within-state differences in malaria endemicity and cannot control for time-varying state trends.
Our strategy matches individuals in 1940 to themselves as they first appeared in either the 1900, 1910, or 1920 full count censuses using the Abramitzky, Boustan, and Eriksson (ABE) matching algorithm (Abramitzky, Boustan, and Eriksson Reference Abramitzky, Boustan and Eriksson2012). Footnote 16 In our baseline sample, we find unique matches for individuals across census years based on their New York State Identification and Intelligence System (NYSIIS) standardized first name, NYSIIS standardized last name, race, and state of birth within a two-year age band. Footnote 17 We follow the conservative ABE approach in our baseline results and require each observation to be unique in its dataset within (plus or minus) two years. Our match rate is approximately 19 percent, similar to other papers in the literature. We also test for robustness to alternative matching criteria, such as different name definitions and age bands, and find that our results are robust to different matching strategies.
Our main outcomes of interest are years of schooling and income. For schooling, we consider whether an individual completed eight years of schooling as our baseline variable. Ungraded schools were common in the U.S. South, especially for Blacks (Margo Reference Margo1990). Instead of focusing on raw years of schooling, we aggregate this data into a binary “middle school completion” variable to indicate if an individual completed at least eight years of schooling. For robustness, we also include results for reported years of schooling as well as for different schooling thresholds, for example, completed five or six years of schooling.
Our income variable includes earnings from both wage and non-wage sources. As the 1940 census reports income for wage earners (i.e., salaried employees) only, we adjust reported wage income to account for self-employed earnings, following Collins and Wanamaker (Reference Collins2014).Footnote 18 The adjustment proceeds as follows: From the 1960 5 percent census, where self-employed earnings data are available, we obtain the ratio of average self-employed income to average wage income at an occupation, region, and race level. We also calculate the average wage earnings for the same occupation, region, and race in the 1940 census. The estimate of self-employed income in 1940 is derived as the product of this ratio from the 1960 census and the average wage income as per the 1940 census. Our preferred measure of income is the sum of actual wage earnings in 1940 and this estimate of self-employed earnings. We refer to this variable as income, adjusted for self-employed earnings.
We collect occupation data as an additional measure of economic standing. Using occupation codes as reported in the 1940 census, we broadly split occupations into the following six categories: Farm owner, farm tenant, farm laborer, blue-collar, white-collar, and not in the labor force. “Blue-collar” includes salaried jobs that involve primarily manual labor such as craftsmen and service occupations. “White-collar” indicates professional and technical jobs such as engineers and doctors.
Malaria Data
Malaria mortality data in the pre-eradication period at a county level is sourced from the Census Vital and Social Statistics (Census 1894). The mortality data corresponds to the 1890 census year, the latest pre-eradication decade for which this data was available. We also use a county-level index of malaria ecology, calculated as of 1900, created by Hong (Reference Hong2007). Footnote 19 The index is constructed based on health data from Union Army recruits during the U.S. Civil War and can be interpreted as the estimated annual probability of contracting malaria for an individual residing in a particular county.
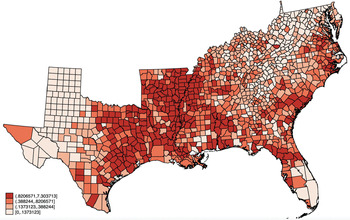
The county-level, pre-program distribution of malaria mortality displays significant variation in malaria exposure both within and across states, as shown in Figure 2. The data in the figure are also consistent with official historical estimates of malarious areas in the United States, suggesting that mortality is a reasonable proxy for endemicity (see Online Appendix Figure A.1).
MALARIA MORTALITY IN 1890 ACROSS U.S. SOUTHERN COUNTIES
Notes: This figure plots malaria mortality, defined as deaths per 1,000 population across U.S. southern counties as recorded in the 1890 Census and Vital Statistics. Darker shades indicate counties with higher mortality. County boundaries correspond to 1890 census definitions.
Source: Authors’ calculations.

Consistent with the previously outlined description of malaria endemicity, malaria deaths were concentrated in cotton-growing areas of the South along the Mississippi River, as well as in eastern counties along the Atlantic coastal plain. The spatial correlation in malaria mortality may confound our results if it is linked to time trends specific to the identified malarious regions. We include state by cohort fixed effects and flexibly control for non-malaria-related health conditions to address this concern. To control for trends specific to cotton-growing areas, we test for robustness to county-level cotton production.
County-Level Data
We collect additional county-level variables that proxy for health, income, and education standards. For health, we use non-malaria-related mortality as of 1890, sourced from Census Vital Statistics (Census 1894). Income controls include the fraction of males unemployed in 1910, taken from the 1910 full count census (Ruggles et al. Reference Ruggles, Flood, Foster, Goeken, Pacas, Schouweiler and Sobek2021).
To account for differential access to schooling, we follow Aaronson and Mazumder (Reference Aaronson and Mazumder2011) and calculate a time-varying measure of a county’s exposure to Rosenwald schools. Footnote 20 The Rosenwald Rural Schools Initiative was an education program aimed at reducing Black-white schooling gaps in the U.S. South. The program sponsored the construction of around 5,000 schools for Southern rural Black children between 1913 and 1931. Since the timing of school construction varied by county, there is significant geographical and cohort-level variation in Black students’ access to Rosenwald schools. We account for this variation by replicating the Rosenwald exposure measure computed in Aaronson and Mazumder (Reference Aaronson and Mazumder2011). The measure, a continuous variable between zero and one, estimates the average Rosenwald coverage a student experienced over the ages of 7–13. Footnote 21 We use the exposure measure as a control in our income regressions and also test for heterogeneity in our schooling results by terciles of Rosenwald exposure. The latter analysis assesses whether school access played any role in influencing schooling attainment post-malaria eradication.
Additionally, we proxy for school quality by calculating county-level Black teacher-to-student ratios from the 1880–1940 complete count censuses. We obtain the number of Black teachers from occupation code data contained in each census. The teacher-student ratio for each county is defined as the ratio of the number of Black teachers to the number of Black school-going children.
To test for racial targeting in malaria programs, we calculate the county-level fraction Black population from the 1910 full count census (Ruggles et al. Reference Ruggles, Flood, Foster, Goeken, Pacas, Schouweiler and Sobek2021). We also extract a county-level segregation index, taken from Logan and Parman (Reference Logan2017), to explore heterogeneity in results by the level of race-based residential segregation. The index compares the number of Black households with non-Black neighbors relative to the expected number under complete segregation and no segregation (i.e., random assignment). The variable is increasing in the level of segregation, with a value of zero (one), implying complete integration (segregation). Footnote 22 We use index values as of the 1880 census for our analysis.
As a robustness check, we account for nominal earnings differences between migrants to the North and non-migrants by adjusting our income variable for cost-of-living differences. The adjustment may be important as price levels were higher outside the South. We use Stecker (Reference Stecker1937) to obtain the cost of living differences in the 1930s and follow the adjustment procedure from Collins and Wanamaker (Reference Collins2014).
We investigate the role cotton may play as a potential confounder using the United States Census of Agriculture (Reference Haines, Fishback and RhodeHaines, Fishback, and Rhode 2018). In particular, we obtain county-level cotton acreage in 1880–1930 and include this data as a control in our baseline regressions. This is an important consideration, as areas suitable for cotton production were also areas where malaria thrived. In addition, the time period under consideration in this paper corresponds to the spread of the boll weevil, an agriculture pest that feeds on cotton plants.
We construct county-level crosswalks to explicitly account for numerous county boundary changes that occurred during the sample period (1880–1940). This strategy allows us to retain data at the county level without having to remove counties that experienced border changes (as in Baker, Blanchette, and Eriksson (Reference Baker, John and Katherine2020)) or having to collapse the data at a state economic area (SEA) level (as in Bleakley (Reference Bleakley2007)). For more information on these border adjustments, refer to Online Appendix Section C.4.
Summary Statistics
Summary statistics for the variables of interest, presented in Table 1, show pronounced differences in Black and white schooling and wages for the sample. For instance, 63 percent of whites on average obtained greater than eight years of schooling (i.e., have completed middle school), whereas the comparable number for Blacks stood at 26 percent. Median white wages were also approximately 1.7 times higher than median Black wages.
SUMMARY STATISTICS

Notes: Summary statistics presented for white and black males between the ages of 23–57 (inclusive) born in the South for the linked 1940 census sample. Observations with missing education data are excluded. Malaria mortality data is winsorized at the 1 percent level.
Source: Authors’ calculations.
The table also shows that across both races, a significant proportion of individuals engaged in self-employment and migration. Adjusting income for self-employment is an important analytical exercise, as around 26 percent of individuals were self-employed. Migration data shows that 69 percent of Blacks and 61 percent of whites migrated away from their childhood county. This fact underscores the importance of using a childhood county rather than a county of residence when assigning childhood exposure to malaria eradication. Median malaria mortality stood at 0.38 deaths per 1,000 individuals and represented 3.5 percent of all non-malaria-related deaths. Footnote 23 These figures suggest that malaria was a major health hazard before eradication efforts began.
We show in Online Appendix Table A.1 that our linked sample matches most moments of the 1940 complete count census for most socioeconomic variables. Our sample has fewer Blacks relative to the full count census, as Blacks were less likely to have consistent name and age records across census years. In robustness tests, we weight individuals using inverse probability weights such that the linked sample matches the population on the demographic variables used to link individuals across census years, namely race, state of birth, and age. This approach allows us to test whether any of our results are driven by differential selection into the sample.
Figure 3 plots middle school completion rates for the matched census sample, split by race and median pre-program malaria mortality. Footnote 24 The vertical line indicates the first cohort exposed to the eradication program during childhood (i.e., before the age of 18). As seen in the figure, there was relatively little difference in white middle school completion rates across malarious and non-malarious counties. We see a divergence in schooling outcomes for Blacks, with Blacks born in below-median malarious counties having higher schooling attainment than those in above-median counties, and this gap increases slightly as cohorts became more exposed to eradication. However, the raw data suggests the widening could have begun slightly earlier than the treatment with the 1900 cohort. This could be indicative of potential pre-trends, and we explore this non-parametrically in presenting our results.
MIDDLE SCHOOL COMPLETION AND MALARIA MORTALITY—RAW DATA
Notes: This figure plots the middle school completion rate by race, birth year, and above and below median malaria mortality. Middle school completion is defined as the percentage of individuals who report having completed at least eight years of schooling in the 1940 census. Above (below) median includes all counties that reported greater (less) than median malaria mortality in 1890.
Source: Authors’ calculations.

EMPIRICAL STRATEGY
Our empirical strategy follows a continuous difference-in-differences design where: (1) spatial variation comes from a county’s pre-program level of malaria endemicity, and (2) time variation comes from a birth cohort’s age at the onset of the malaria eradication program. Our main specifications are as follows:
 $${y_{irct}} = \beta ma{l_c} \times trea{t_t} + {\eta ^T}{X_{rct}} + {\mu _t} + {\mu _c} + {\varepsilon _{irct}}$$
 $${y_{irct}} = \sum\limits_{r \in \{ b,w\} } {{\delta _r}ma{l_c} \times trea{t_t} \times 1\{ Race = r\} + {\eta ^T}{X_{rct}} + {\mu _{rt}} + {\mu _{rc}} + {\varepsilon _{irct}},} $$
where i indexes individual, r indexes race, c indexes (childhood) county, and t indexes birth cohort bin. For Equation (1), y irct denotes the outcome variable of interest, that is, middle school completion for individual i of race r with childhood county c, belonging to birth cohort bin t. Our baseline measure of spatial exposure to malaria is the pre-program malaria mortality in county c, denoted by mal c . In the tables, we refer to this measure as malaria mortality exposure. Cohort bin t’s exposure to the eradication program is treat t , constructed as described in the next section. It captures the average length of time a particular cohort spent exposed to the program during childhood. X rct is a vector of race and cohort bin specific controls. For schooling outcomes, these include 1890 non-malaria mortality and 1910 male unemployment rate, both of which are interacted with cohort bin and race dummies. When y irct is income, we also include Rosenwald exposure interacted with race as a control. μ t and μ c denote birth cohort bin and county fixed effects, respectively, and ε irct is the error term. Standard errors are clustered at the childhood county level.
Our coefficient of interest, β, represents the difference-in-difference estimate of the effect of malaria eradication pooled across both Blacks and whites. It can be interpreted as an effect of being born in a malarious area (i.e., with a mortality rate of 1 death per 1,000) versus a non-malarious area for a cohort born after the eradication program, relative to the same difference across older cohorts whose childhood was completed before the program began.
We augment the standard differencing approach by including county-by-race fixed effects and cohort bin-by-(birth) state-by-race fixed effects to our main specification in Equation (1). Footnote 25 Adding county fixed effects for each race controls for any non-time varying county characteristics, such as climate or prior history with slavery, that may differentially impact Blacks and whites. Including cohort-by-state-by-race fixed effects control for concurrent race-specific shocks at the national level, such as WWI enlistment and the 1918 influenza pandemic. Incorporating these fixed effects also flexibly accounts for any time-varying state-level policies that could plausibly have been correlated with both malaria endemicity and economic outcomes, such as mandatory schooling laws, and changes in state health and education spending.
We estimate Equation (2) to disentangle the effects of the program by race. All common variables and indices are exactly as stated in Equation (1). 1{Race = r} indicates whether an individual belongs to race r, where r is either Black or white. μ rt and μ rc denote cohort-by-race and county-by-race fixed effects, respectively, and ε irct is the error term.
The coefficient of interest, δ r represents the impact of the eradication program on race r. It is numerically equivalent to the β coefficient from estimating Equation (1) for race r individuals only, once μ t and μ c are replaced with μ rt and μ rc , respectively. We determine whether Blacks and whites were differentially impacted by eradication programs by performing inference on δ w – δ b . Footnote 26 If δ w – δ b is greater than (less than) zero, then this result implies that eradication led to a widening (narrowing) of schooling attainment and earnings between exposed whites and Blacks. As with Specification (1), we can control for time-varying state-level shocks by including cohort-by-state-by-race fixed effects in Equation (2).
We also consider whether exposure to the eradication programs resulted in occupational shifts that are consistent with the income results. We estimate the following linear probability models by race:
 $$1\{ Oc{c_{irct}} = o\} = \sum\limits_{r \in \{ b,w\} } {{\delta _r}ma{l_c} \times trea{t_t} \times 1\{ Race = r\} + {\eta ^T}{X_{rct}} + {\mu _{rt}} + {\mu _{rc}} + {\varepsilon _{irct}},} $$
where the right-hand-side variables are exactly as defined in Equation (2). 1{Occ irct = o} indicates whether individual i is employed in occupation o, where o is one of the six occupation categories described previously.
Cohort-Level Exposure to the Eradication Program
The timing of the eradication program, which began nationwide in 1920, creates variation in birth cohorts’ exposure to the program depending on their age at program onset. A natural empirical approach given this variation would be to construct a continuous measure of cohort exposure based on an individual’s year of birth relative to 1920, as in Bleakley (Reference Bleakley2010). This approach requires precise reporting of age data. However, our outcome data, and in particular data for Blacks, displays significant amounts of age heaping, as Blacks tended to over-report ages corresponding to decadal and mid-decadal birth years. To account for heaping, we follow Cutler et al. (Reference Cutler, Fung, Kremer, Singhal and Vogl2010) and group individuals into five-year cohort bins centered on years ending in the digits 0 and 5. Therefore, an individual born in 1904 is placed into the 1905 cohort bin, and so on. Footnote 27
We compute treat t as the average length of time a particular cohort bin was exposed to the eradication program as a child:
 $$trea{t_t} = max\left\{ {min\left\{ {{{18 - \left( {1920 - t} \right)} \over {18}},1} \right\},0} \right\},$$
where t denotes the cohort bin. Figure 4 plots treat t for various birth cohorts. As shown in the figure, cohorts that were already adults by the time the eradication program began have a treat t value of zero, whereas those born after 1920 are fully exposed to the program and are thus assigned treat t equaling one. Since we only consider individuals aged 23–57, our cohort bins range from 1885 through 1915. Footnote 28
treat t BY BIRTH YEAR
Notes: This figure plots the treat t variable, constructed as described in Equation (4), by birth year. The shaded area denotes birth years corresponding to ages (23–57 year olds) included in our baseline sample.
Source: Authors’ calculations.

Identification
The identifying assumptions underlying our estimation strategy are as follows: First, both malarious and non-malarious areas had similar time trends before the program. Second, in the absence of the malaria eradication program, individuals in more malarious areas would have continued to follow the same trends as those in less malarious areas. We test for the former assumption by running the following, non-parametric version of our main specifications:
 $${y_{irct}} = \sum\limits_{t \ne 1900} {{\beta _t}ma{l_c} \times 1\{ birthyrbin = t\} + {\eta ^T}{X_{rct}} + {\mu _t} + {\mu _c} + {\varepsilon _{irct}}} $$
 $${y_{irct}} = \sum\limits_{r \in \{ b,w\} } {\sum\limits_{t \ne 1900} {{\delta _{rt}}ma{l_c} \times 1\{ Race = r\} \times 1\{ birthyrbin = t\} + {\eta ^T}{X_{rct}} + {\mu _{rt}} + {\mu _{rc}} + {\varepsilon _{irct}},} } $$
where the common variables and indices are exactly as in Equations (1) and (2). 1{birthyrbin = t} indicates whether an individual was born in a birth year corresponding to bin t. In the absence of pre-trends, we would expect the δ t and the δ rt coefficients associated with pre-1900 cohort bins to be close to zero.
Including cohort-by-state-by-race fixed effects allows us to partly address the second identifying assumption. This approach means that any alternative explanation for our results requires the presence of a shock that impacted more malarious areas disproportionately relative to less malarious areas within the same state and happened to occur at the same time as the eradication program.
As our exposure variable is the interaction of two continuous variables, our empirical strategy implicitly assumes a tradeoff between pre-program malaria mortality and years of exposure. In particular, an individual born earlier in a more malarious county can have an equivalent “treatment” as an individual born later in a less malarious county. In our robustness, we relax this assumption by re-defining exposure to malaria as a binary variable (above/below the median of malaria mortality). Our results are generally robust to this alternative specification.
We further address endogeneity concerns by considering competing hypotheses in our robustness section. We include county-level controls for Black population composition interacted with cohort bin to test for differential timing in malaria control programs. We also control for trends in county-level cotton productivity to account for any shocks that affected cotton-rich malarious areas during the time of the eradication program. Our results remain robust to these modifications.
RESULTS: SCHOOLING AND INCOME
We show in Table 2 that increased exposure to the malaria eradication program was associated with increases in schooling attainment. Column (1) estimates Specification (1) and reports results for schooling pooled across Blacks and whites with county of birth and cohort bin fixed effects. The β coefficient representing the effect of childhood exposure to malaria treatment is positive and significant. It implies that individuals exposed to the program in highly malarious areas (i.e., those with a mortality rate of 1 death per 1,000 Footnote 29 ) experienced a 2 percentage point increase in their likelihood of middle school completion. The coefficient remains significant after including county-by-race and cohort-by-state-by-race fixed effects (as in Column (2)), as well as after incrementally adding health and income controls (Column (3)).
IMPACT OF MALARIA ERADICATION ON COMPLETING MIDDLE SCHOOL

* = Significant at the 10 percent level.
** = Significant at the 5 percent level.
*** = Significant at the 1 percent level.
Notes: Controls include 1910 male unemployment rate in childhood county interacted with birth year bin and 1890 non-malaria mortality per 1,000 population in childhood county interacted with birth year bin. Robust standard errors are clustered at the childhood county level.
Source: Authors’ calculations. The table presents results from estimating Equations (1) and (2).
However, this positive effect on schooling was limited to whites. Columns (4) and (5) of Table 2 estimate Specification (2) and report race-specific coefficients corresponding to the pooled coefficients in Columns (2) and (3), respectively. As shown in the table, it appears that the positive β coefficient on the pooled race sample is entirely driven by positive schooling effects for whites. The δ w coefficient, which denotes the effect of exposure to the treatment for whites only, is positive and significant across both Columns (4) and (5). It implies that a one standard deviation increase in pre-program malaria mortality (an increase in 0.535 malaria deaths per 1,000) was associated with a 1 percentage point increase in the probability of middle school completion for whites.
The equivalent δ b coefficient for Blacks is close to zero and even slightly negative. These differences by race are meaningful, as the delta between the white and Black coefficients is positive and significant across both Columns (4) and (5). The results are striking, given that pre-program Blacks in the sample had a middle school completion rate of 21 percent relative to 58 percent for pre-program whites, implying that Blacks’ marginal gains to additional schooling at the onset of eradication were likely larger than those for whites. Footnote 30
Results for raw years of schooling, reported in Online Appendix Table A.2, are consistent with those for our preferred middle school completion measure. The δ w coefficient is positive and statistically significant across Columns (4)–(5), whereas the associated δ b coefficient remains insignificant.
Similar to the schooling results, income gains associated with malaria eradication also accrued mostly to whites. Table 3 shows results from estimating Equations (1) and (2) for our preferred income variable, log income adjusted for self-employed earnings. The specifications across the columns are identical to those in Table 2, except that for the income specifications in Column (3) and Column (5), we include Rosenwald school exposure as an additional control variable to account for differential access to schooling for Blacks. The results are largely consistent with our schooling regressions. The estimates in Columns (1) through (3) imply that exposure to the malaria eradication program was associated with a 2–5 percent increase in income across races, though the results are not statistically significant across all columns. The δ w coefficient in Column (5) shows that white incomes rose by around 2 percent with program exposure. Conversely, the δ b coefficient capturing income gains for Blacks is insignificant and close to zero. We present results for wage income (not adjusted for self-employment earnings) in Online Appendix Table A.3. The results are similar to our preferred income measure, but the significance is attenuated for white men.
IMPACT OF MALARIA ERADICATION ON INCOME

* = Significant at the 10 percent level.
** = Significant at the 5 percent level.
*** = Significant at the 1 percent level.
Notes: Controls include 1910 male unemployment rate in childhood county interacted with birth year bin, 1890 non-malaria mortality per 1,000 population in childhood county interacted with birth year bin, and Rosenwald school exposure in childhood county. Robust standard errors are clustered at the childhood county level.
Source: Authors’ calculations. The table presents results from estimating Equations (1) and (2).
Non-Parametric Results: Schooling and Income
We allow for the effect of eradication to vary non-parametrically at the cohort-bin level and find schooling results consistent with our parametric baseline specifications. Figure 5 plots the coefficients on malaria exposure across cohort bins for the pooled sample as well as for each race. Panel (A) plots the δ t coefficients from estimating Equation (5) across races and shows a positive effect on schooling outcomes post-eradication. While the power of the test on pre-trends is low, the post-eradication coefficients are suggestive of a net gain in schooling when pooling across races. Panels (B) and (C) plot δ wt and δ bt coefficients from estimating Equation (6) for whites and Blacks, respectively. As shown in Panel (B), all coefficients in the pre-eradication period are insignificant. Post-eradication, the schooling coefficients for whites become positive and significant for all cohort bins that are exposed to the program.
IMPACT OF MALARIA ERADICATION ON MIDDLE SCHOOL COMPLETION BY COHORT BIN
Notes: In Panel (A), each point, and the associated 95 percent confidence interval, represents the β t coefficient from estimating Equation (5). Each point in Panels (B) and (C) represents the δ wt and δ bt coefficients, respectively, from estimating Equation (6). The dependent variables for Figures 5 and 6 are an indicator for middle school completion and log income, adjusted for self-employed earnings, respectively. The specification in all panels includes controls, as well as county x race and state x cohort bin x race fixed effects. Education controls include 1910 male unemployment rate, and 1890 non-malaria mortality per 1,000 population in childhood county. Income controls include all education controls, as well as Rosenwald school exposure.
Source: Authors’ calculations.

The coefficients for Blacks, as shown in Panel (C), are mostly close to zero and statistically insignificant both before and after eradication, indicating that Blacks exposed to treatment did not experience meaningful schooling gains. There is a slight pre-trend for Blacks, as the 1885 cohort bin coefficient is positive and significant. This coefficient exploits variation in malaria mortality experienced by Blacks aged 53–57 in the 1940 census. Given the relatively low life expectancy for Blacks during this period, the coefficient is likely estimated off of a selected sample that may not reflect an average Black cohort’s exposure to malaria in the pre-period.
Figure 6 plots coefficients across cohort bins for our baseline income measure and shows increases in income for exposed whites and no such income gains for Blacks. The figure replicates the structure of Figure 5, with Panel (A) showing pooled race results and Panels (B) and (C) displaying race-specific coefficients. For whites, as shown in Panel (B), post-eradication coefficients show an increase relative to the pre-eradication coefficients, albeit more noisily estimated than for the schooling results. Coefficients for Blacks as displayed in Panel (C) are statistically insignificant both before and after eradication. The (omitted) coefficient for the 1900 birth year bin shows slightly higher income gains for malaria-exposed Blacks in that cohort. We do not consider this result to meaningfully change our interpretation of a null income effect for Blacks since the coefficients for the post-eradication bins are lower than those for 1900 and are of similar magnitudes to the pre-1900 coefficients. Footnote 31
IMPACT OF MALARIA ERADICATION ON INCOME BY COHORT BIN
Notes: In Panel (A), each point, and the associated 95 percent confidence interval, represents the β t coefficient from estimating Equation (5). Each point in Panels (B) and (C) represents the δ wt and δ bt coefficients, respectively, from estimating Equation (6). The dependent variables for Figures 5 and 6 are an indicator for middle school completion and log income, adjusted for self-employed earnings, respectively. The specification in all panels includes controls, as well as county x race and state x cohort bin x race fixed effects. Education controls include 1910 male unemployment rate, and 1890 non-malaria mortality per 1,000 population in childhood county. Income controls include all education controls, as well as Rosenwald school exposure.
Source: Authors’ calculations.

Interpretation of Results
The key insight from our results is that malaria eradication programs widened racial gaps in the labor market; this is a novel finding relative to similar papers in the literature. As mentioned, previous research in the U.S. context has exploited coarser, state-level variation in childhood exposure to disease environments and has found largely negligible impacts of disease eradication on racial income gaps. Barreca (Reference Barreca2010) uses data from the 1960 census to assess the impact of in utero and postnatal exposure to malaria on adult outcomes. While the author finds suggestive evidence that Blacks benefited less than whites from a malaria-free environment, large standard errors prevent him from making a conclusive statement regarding the differential effects of malaria across races. Bleakley (Reference Bleakley2007) evaluates the economic impact of hookworm eradication programs in the U.S. South from 1910–1915. The author finds that in the long run, Blacks exposed to hookworm eradication as children experienced similar increases in earnings and larger increases in literacy relative to the same cohort of whites.
Our study is distinct from the above literature as it excludes Northern-born Blacks and controls for concurrent race-specific shocks at the state level; these modifications are quantitatively salient. As shown in Online Appendix Table A.4, when we modify our baseline estimation strategy to exploit only the state of birth level variation in malaria endemicity, we find that increased exposure to malaria eradication was associated with higher income for both Blacks and whites. Moreover, the magnitudes of these increases were largely similar across races. This result shows that previous research documenting an increase in Black economic benefits associated with public health interventions may be capturing state-level convergence in incomes between relatively poorer (disease-afflicted) and richer (disease-free) states.
Our results may also be unique relative to previous research because of the labor market context and the untargeted nature of the malaria eradication program. Adhvaryu et al. (Reference Adhvaryu, Bednar, Molina, Nguyen and Nyshadham2020) study the impact of salt iodization in the United States in the mid-1920s and find meaningful economic benefits for women. However, these benefits were largely driven by external margin effects; female cohorts exposed to the iodization program were significantly more likely to enter the labor force. Conversely, men did not experience significant income increases since their pre-existing labor force participation levels were already quite high. In our context, even though Black males earned significantly less than white males, their baseline labor force participation rate was relatively high at 93 percent, thus ruling out any potential income gains associated with labor market entry. Footnote 32 Furthermore, a relatively untargeted intervention, such as the one we consider, may have been less effective than programs that specifically targeted Blacks in the South during the early 1900s. For instance, Aaronson and Mazumder (Reference Aaronson and Mazumder2011) document that the Rosenwald Rural Schools Initiative, under which schools were built for rural Black schoolchildren, was highly effective in raising Black schooling levels. This setting is distinct from ours in that whites could have been feasibly excluded from attending Rosenwald schools; by contrast, malaria eradication efforts needed to be broadly applied across the population.
Our effect sizes for white income and schooling gains are largely in line with previous research, as shown in Table 4. Columns (6) and (9) of the table restate our baseline results for whites and Blacks, respectively, so that the magnitudes align with those reported by selected papers in the literature. As shown in Panel (A), our schooling estimates for whites are either larger than or are around one-third the magnitude of comparable schooling coefficients in the literature. Our benchmarked magnitudes for white income, reported in Panel (B), are between one-third and one-half of comparable income estimates. Our null schooling and income result for Blacks stands somewhat in contrast to the literature, as most papers find similar (or larger) gains for minority groups relative to the majority group.
COMPARISON OF EDUCATION AND INCOME MAGNITUDES VS. LITERATURE

* = Significant at the 10 percent level.
** = Significant at the 5 percent level.
*** = Significant at the 1 percent level.
Notes: This table benchmarks the magnitudes for schooling and income to coefficients obtained by related papers in the literature. Panels A and B display schooling and income outcomes, respectively. Columns (4) and (7) describe the relevant majority and minority groups considered by each of the listed papers. Columns (5) and (8) display the baseline coefficients, measured as changes in the dependent variable (stated in Column (1)) associated with a change in the independent variable (stated in Column (2)), where the unit of change of the independent variable is stated in Column (3). In Columns (6) and (9), we restate our coefficients and express our obtained magnitudes in units that are comparable to each referenced paper. For papers where the units are not readily available, we imputed them based on other reported summary statistics. One s.d. stands for a standard deviation increase. Binary denotes an increase from zero to one for a binary independent variable. p(75) – p(25) refers to an increase from the 25th to the 75th percentile.
Source: Authors’ calculations; Aaronson and Mazumder (Reference Aaronson and Mazumder2011); Adhvaryu et al. (Reference Adhvaryu, Bednar, Molina, Nguyen and Nyshadham2020); Baker, Blanchette, and Eriksson (Reference Baker, John and Katherine2020); Barecca (Reference Barreca2010); Bleakley (Reference Bleakley2007); Niemesh (Reference Niemesh2015).
ADDITIONAL RESULTS
Income Results and Occupational Shifts
As income is imperfectly measured in the 1940 census, we consider if exposure to malaria eradication led to shifts between broad occupation categories: farm owner, farm tenant, farm laborer, blue-collar, white-collar, and not in the labor force. It could have been possible for Blacks to shift into occupations with better standards (e.g., better hours and conditions) without seeing a gain in income. This could still be perceived as a positive impact of malaria eradication even though we do not find any wage gains accruing to Blacks in our baseline results.
Results from estimating Equation (3) are displayed in Figure 7 and show no significant changes in occupation categories for whites. The results for Blacks suggest a lower probability of a blue-collar occupation and a greater probability of being a farm laborer. As displayed in Panel (B), Blacks exposed to treatment were around 3 percentage points more likely to be farm laborers. Farm laborers did not have better working conditions or better hours than blue-collar workers, so this would certainly not be considered an upgrade in the occupational ladder. If anything, farm labor was a less desirable occupation with worse conditions, suggesting that Blacks experienced occupational downgrading. Interestingly, for both races, the coefficient on not being in the labor force is a somewhat precise zero. The data in Panel (B) is also consistent with our schooling results, as Blacks would have likely needed to increase their level of schooling to secure higher-paying, white-collar jobs, and we do not find any evidence that Blacks exposed to malaria eradication treatments had a higher probability of being employed in a white-collar occupation.
OCCUPATION RESULTS BY RACE DEPENDENT VARIABLE: OCCUPATION INDICATOR
Notes: Each point (and the associated standard error) is from a separate regression, and denotes the δ r coefficient from estimating Equation (3) for a particular occupation o. Owner, Tenant, and Laborer refer to farmer occupation categories. Panels (A) and (B) display the δ w and δ b coefficients for whites and Blacks, respectively. The specification in all panels includes the income controls, as well as county x race and state x cohort bin x race fixed effects.
Source: Authors’ calculations.

We consider income effects along the intensive margin by estimating Equation (2) conditional on a particular occupation and find income gains for whites engaged in skilled occupations but no significant income gains for Blacks in specific occupations. As shown in Panel (A) of Figure 8, exposure to eradication was associated with income increases for whites engaged in both blue-collar and white-collar work. The results for Blacks in Panel (B) show no significant increases in income conditional on being employed in any occupation. While we would like to investigate how eradication impacted the business patterns and profits of business owners and entrepreneurs, we are ultimately unable to do so. Self-employed earnings are not reported in the 1940 census, and our income adjustment does not vary within a county, so we are unable to calculate income effects for farm owners and farm tenants.
INCOME RESULTS BY OCCUPATION DEPENDENT VARIABLE: LOG INCOME, ADJUSTED FOR SELF-EMPLOYED EARNINGS
Notes: Each point (and the associated standard error) is from a separate regression, and denotes the δ r coefficient from estimating Equation (2), conditional on an individual belonging to a particular occupation. Panels (A) and (B) display the δ w and δ b coefficients for whites and Blacks, respectively. The specification in all panels includes the income controls, as well as county x race and state x cohort bin x race fixed effects.
Source: Authors’ calculations.

Migration Specific Results
We test the link between exposure to the eradication program and migration outcomes and consider whether our baseline results differ for the subset of migrants in our sample.
Malaria eradication programs and other ambitious public health interventions in the U.S. South during the early 1900s coincided with the first “Great Migration” of 1910–1930, during which 1.6 million Blacks migrated from the South to non-Southern industrial cities. Previous literature on Blacks in the pre-Great Migration time period finds that negative health shocks reduced migration propensities (Logan Reference Logan2009). We verify whether this relationship holds in our context, though for a positive health shock, and determine the extent to which health benefits from malaria eradication contributed to the Great Migration.
We find that exposure to treatment induced county-level migration for whites and was strongly associated with out-of-state migration for both whites and Blacks. Our linked census sample allows us to determine whether individuals’ county of residence differs from their childhood county. We can therefore compute migration outcomes at both a county and at a state level, as displayed in Table 5. Column (2) of the table shows that exposed whites were 2 percentage points more likely to migrate away from their childhood county, and the result is highly statistically significant. The corresponding coefficient for Blacks is positive though insignificant. Columns (3) and (4) display pooled and race-specific state migration results, respectively, and show that treatment was associated with a 3 percentage point increase in the likelihood of out-of-state migration for both whites and Blacks. These results are intuitive; Blacks who migrated across states were particularly entrepreneurial and most able to take advantage of their improved health. Additionally, labor mobility improved for whites who were healthier as a result of the program.
IMPACT OF MALARIA ERADICATION ON MIGRATION

* = Significant at the 10 percent level.
** = Significant at the 5 percent level.
*** = Significant at the 1 percent level.
Notes: County (state) migrant is a binary variable that equals one if an individual’s county (state) of residence in 1940 is different from his childhood county (state). Controls include 1910 male unemployment rate in childhood county interacted with birth year bin, 1890 non-malaria mortality per 1,000 population in childhood county interacted with birth year bin, and Rosenwald school exposure in childhood county. Robust standard errors are clustered at the childhood county level.
Source: Authors’ calculations. The table presents results from estimating Equations (1) and (2).
We would expect greater schooling and income gains for the subset of migrants and find results consistent with this hypothesis. Table 6 displays our baseline results conditional on migration. Whites who migrated across both counties and states experienced schooling and income gains, and the results conditioning on county migration are statistically significant. The coefficients for whites are slightly greater in magnitude (though not statistically different) than those for the overall white sample in Table 3. Conditioning on out-of-state migration, we find that the coefficient on income for Blacks is positive, though not statistically significant. This result is indicative of some income gains for Blacks who migrated out of state, though the relatively small sample of these makes statistical inference difficult.
BASELINE RESULTS CONDITIONAL ON MIGRATION

* = Significant at the 10 percent level.
** = Significant at the 5 percent level.
*** = Significant at the 1 percent level.
Notes: Educ. is the middle school completion variable, and Income is log income adjusted for self-employed earnings. County (state) migrant is a binary variable that equals one if an individual’s county (state) of residence in 1940 is different from his childhood county (state). Education controls include 1910 male unemployment rate in childhood county interacted with birth year bin and 1890 non-malaria mortality per 1,000 population in childhood county interacted with birth year bin. Income controls include all education controls and Rosenwald school exposure. Robust standard errors are clustered at the childhood county level.
Source: Authors’ calculations. This table presents results for the baseline education and income variables for the subsample of county and state migrants.
The Role of School Access and Quality
This section investigates the potential reasons behind our finding that Black schooling attainment did not increase as a result of exposure to the eradication program. We first tackle access to schooling resources and subsequently explore the impact of school quality.
SCHOOL ACCESS
We proxy for schooling access by using data on Rosenwald schools. The Rosenwald Rural Schools Initiative was expressly designed to reduce Black-white schooling gaps in the rural South. The program had extensive reach: by the time of its completion, around 36 percent of rural Black children living in the South may have enrolled at a Rosenwald school. It was highly successful in increasing Black schooling levels, accounting for roughly one-third of the observed increases in years of completed schooling for the exposed Black cohorts (Aaronson and Mazumder Reference Aaronson and Mazumder2011).
We evaluate whether Blacks born in more malarious areas that also happened to receive Rosenwald schools were able to increase their schooling attainment, as they actually had access to a school. To test this hypothesis, we re-run our race-specific baseline Equation (2) by tercile of exposure to Rosenwald schools. This variable captures the average Rosenwald coverage experienced by a particular cohort and therefore is a decent proxy for schooling access. When we run Aaronson and Mazumder’s (Reference Aaronson and Mazumder2011) baseline specification for our data, that is, estimate schooling on Rosenwald exposure, we can largely replicate their results even though our sample is not a repeated cross-section as in their paper. Footnote 33 This finding mitigates concerns that our (lack of) results by tercile of Rosenwald exposure is driven by the particularities of our sample.
Figure 9 shows the results from computing our baseline schooling results by tercile of Rosenwald school exposure and finds no significant schooling increases for Blacks with greater access to Rosenwald schools. As shown in Panel (B), schooling results for Blacks remain statistically insignificant across Rosenwald exposure terciles. For whites, there is no clear pattern in schooling results by Rosenwald exposure tercile, as shown in Panel (A). Based on these results, we cannot conclude that the (lack of) schooling results for Blacks were driven by access to schooling.
EDUCATION RESULTS BY TERCILES OF ROSENWALD SCHOOL EXPOSURE DEPENDENT VARIABLE: COMPLETED MIDDLE SCHOOL
Notes: Each point (and the associated standard error) is from a separate regression, and denotes the δ r coefficient from estimating Equation (2) for a particular tercile of Rosenwald exposure. Panels (A) and (B) display the δ w and δ b coefficients for whites and Blacks, respectively. The specification in all panels includes the education controls, as well as county x race and state x cohort bin x race fixed effects.
Source: Authors’ calculations.

Figure 9 about here
SCHOOL QUALITY
We proxy for school quality with the ratio of Black teachers to students in an individual’s childhood county and do not find a statistically meaningful improvement in Black schooling outcomes with improvements in school quality. Figure 10 plots the results for the middle school completion outcome variable by tercile of Black teachers to student ratios. In Panel (B), which displays results for Blacks, we find that schooling gains increased slightly with the tercile of Black teacher-student ratios, though the estimates are noisy and not statistically significant. Footnote 34 For whites, as displayed in Panel (A), the coefficients are higher in terciles 2 and 3 relative to tercile 1, but the results for tercile 2 and tercile 3 are largely similar. This result may arise because areas with a greater number of Black teachers relative to Black students also likely had a higher number of teachers and schooling resources overall.
EDUCATION RESULTS BY TERCILES OF BLACK TEACHER TO STUDENT RATIO DEPENDENT VARIABLE: COMPLETED MIDDLE SCHOOL
Each point (and the associated standard error) is from a separate regression, and denotes the δ r coefficient from estimating Equation (2) for a particular tercile of Rosenwald exposure. Panels (A) and (B) display the δ w and δ b coefficients for whites and Blacks, respectively. The specification in all panels includes the education controls, as well as county x race and state x cohort bin x race fixed effects.
Source: Authors’ calculations.

Figure 10 about here
ROBUSTNESS TESTS
Alternative Specifications
Our baseline results are largely robust to alternative specifications and variable definitions. Results from this robustness analysis are presented in Table 7 and Online Appendix Table A.5 for our preferred schooling and income measures, respectively.
ROBUSTNESS TO ALTERNATIVE SPECIFICATIONS: IMPACT OF MALARIA ERADICATION ON COMPLETING MIDDLE SCHOOL

* = Significant at the 10 percent level.
** = Significant at the 5 percent level.
*** = Significant at the 1 percent level.
Notes: Panel (A) includes results without controls and Panel (B) includes controls. Controls include 1910 male unemployment rate in childhood county interacted with birth year bin and 1890 non-malaria mortality per 1,000 population in childhood county interacted with birth year bin. Column (2) redefines treat t : the variable is now given by a modified version of Equation (4), with t replaced by year of birth. Column (3) redefines mortality as a binary variable that equals one if a county has above median malaria mortality. Column (4) replaces malaria mortality with the Malaria Ecology Index. Column (5) replaces the dependent variable with sixth grade completion, corresponding to above median school completion for Blacks in the sample. Robust standard errors are clustered at the childhood county level.
Source: Authors’ calculations. The table presents results from estimating Equation (2). Column (1) replicates the baseline regression results displayed in Table 2.
We attempt several robustness checks by redefining the spatial malaria endemicity measure, the time-varying cohort exposure to eradication, and the outcome variable. For the middle school completion measure, Column (1) of Table 7 replicates our baseline race-specific coefficients as reported in Columns (4) and (5) of Table 2. Panel (A) reports results without controls, and Panel (B) includes the relevant control variables. Robustness checks are reported in Columns (2)–(5) of the table.
As shown in Table 7, the schooling results are mostly consistent across the alternative specifications. In Column (2), we redefine the treat t variable by no longer creating five-year cohort bins. Footnote 35 Dropping the binned treatment does not affect the direction of schooling attainment for whites and Blacks. To test that our results are consistent with a more non-parametric approach, we redefine our malaria mortality measure as a binary variable that equals one if a county had above-median mortality in 1890. The results for this strategy are reported in Column (3) and suggest that the white schooling results are somewhat independent of our chosen continuous measure of malaria exposure.
Our schooling results are also robust to alternative variable definitions. In Column (4) of Table 7, we replace our continuous malaria measure with a malaria ecology measure developed in Hong (Reference Hong2007). Results for the ecology measure replicate the Black-white divergence results, but the divergence is now driven by declines in Black schooling attainment. Footnote 36 In Column (5), we consider an alternative school completion threshold, where the threshold is defined as having completed six rather than eight years of schooling. Footnote 37 Redefining the schooling measure in this manner does not meaningfully impact our result.
The income results, as shown in Online Appendix Table A.5, are also largely robust to alternative variable definitions. The columns in this table run identical specifications to those in the corresponding columns of Table 7, with the exception of Column (5). In Column (5), we redefine the income measure to adjust for cost of living (COL) differences, as in Stecker (Reference Stecker1937). Footnote 38 As shown in row 1 of both Panels (A) and (B), white income gains are mostly positive, though not all the coefficients are significant. Adjusting for cost of living in Column (5), our income results for whites are positive and highly statistically significant, both with and without controls. We do not see a statistically significant income gain among Blacks in any specification.
Robustness to Census Matching
Our baseline results are robust to alternative matching strategies, including becoming more or less strict in what constitutes a match and inverse probability weighting our baseline data to account for potential selective matching.
Table 8 presents results from estimating Equation (2) using middle school completion as the dependent variable with samples generated using various matching approaches. Column (1) replicates our baseline results without controls (Panel (A)) and with controls (Panel (B)), corresponding to Columns (4) and (5) of Table 2. Column (2) becomes more strict in our matching: we still standardize names, but we now require an observation to be unique within five years in its dataset. Footnote 39 In Column (3), we keep our uniqueness requirement identical to baseline (two years), but instead do not standardize names and require matches on exact names. In Column (4), we return to standardized names and become less conservative in our matching relative to baseline: we only require uniqueness within the year of birth in each dataset. Footnote 40 Finally, Column (5) adjusts for the non-representative nature of matching. We use the baseline sample with inverse probability weights based on the characteristics that were used in the matching: race, state of birth, and year of birth.
ROBUSTNESS TO CENSUS MATCHING: IMPACT OF MALARIA ERADICATION ON COMPLETING MIDDLE SCHOOL

* = Significant at the 10 percent level.
** = Significant at the 5 percent level.
*** = Significant at the 1 percent level.
Notes: Panel (A) includes results without controls and Panel (B) includes controls. Controls include 1910 male unemployment rate in childhood county interacted with birth year bin and 1890 non-malaria mortality per 1,000 population in childhood county interacted with birth year bin. Column (2) requires observations to be unique within five years in its own dataset. Column (3) uses exact names rather than standardized names. Column (4) only requires an observation to be unique in its own year of birth in its dataset. Column (5) uses inverse probability weights for the demographic characteristics used to match (year of birth, race, and state of birth) individuals across census years. Robust standard errors are clustered at the childhood county level.
Source: Authors’ calculations. The table presents results from estimating Equation (2). Column (1) replicates the baseline regression results displayed in Table 2.
The results in the table show that our baseline results cannot be explained by the technique used for matching. Across all columns, we find results that are largely consistent in both magnitude and significance. Our results for income tell a similar story, as seen in Online Appendix Table A.6. Thus, our baseline results are extremely robust to alternative matching specifications and weighting.
Alternative Hypotheses
RACIAL TARGETING OF MALARIA ERADICATION PROGRAMS
Southern state governments in the Jim Crow era were immensely hostile towards Blacks. Racial segregation in schooling, labor markets, and public transportation was enforced by law. Given this context, a potential competing explanation for our baseline results is that public health authorities targeted malaria eradication efforts towards white-majority areas or that counties with a relatively higher proportion of Blacks were on differential trends in a manner that was correlated with the roll-out of malaria campaigns. We cannot explicitly test for these alternative hypotheses as consistent county-level data related to the timing of malaria programs or malaria mortality is not available for our setting.
Instead, we rule out potential racial targeting in malaria control efforts by including time-varying controls for a county’s Black population share and find that our schooling results are robust to these modifications. Results for this exercise are reported in Table 9. Column (1) replicates the baseline schooling results displayed in Column (5) of Table 2. Column (2) includes parametric controls for percent Black population in 1910 interacted with birth year bin, and Column (3) incorporates non-parametric controls for quintile Black population in 1910 interacted with birth year bin. The specifications in Columns (2) and (3) absorb some of the variation in malaria mortality, as malaria endemicity is positively correlated with a county’s fraction Black population. Nevertheless, as shown in Columns (2) and (3), schooling gains remain positive and significant for whites and are statistically insignificant for Blacks.
ROBUSTNESS TO ALTERNATIVE HYPOTHESES—BLACK POPULATION CONTROLS

* = Significant at the 10 percent level.
** = Significant at the 5 percent level.
*** = Significant at the 1 percent level.
Notes: Columns (1)–(3) correspond to middle school completion, Columns (4)–(6) correspond to log income adjusted for self-employed earnings, and Columns (7)–(9) correspond to (log) income as reported in the 1940 census. Columns (1), (4), and (7) replicate the baseline regression results displayed in Column (5) of Table 2, Table 3, and Online Appendix Table A.3, respectively. Columns (2), (5), and (8) include county level percent Black population in 1910 interacted with birth year bin. Columns (3), (6), and (9) include quintile of percent Black population in 1910 interacted with birth year bin. All columns include controls for 1910 male unemployment rate in childhood county interacted with birth year bin and 1890 non-malaria mortality per 1,000 population in childhood county interacted with birth year bin. Columns (4)–(9) additionally include controls for Rosenwald exposure in childhood county. Robust standard errors are clustered at the childhood county level.
Source: Authors’ calculations. The table presents results from estimating Equation (2).
Our baseline income results are attenuated after including the percent Black controls; reassuringly, however, results for reported log wage income remain consistent with our findings. Columns (4)–(6) of Table 9 replicate the specifications in Columns (1)–(3) for our baseline log income variable, adjusted for self-employed earnings. Columns (7)–(9) repeat this analysis for log wage income as reported in the 1940 census. We include the latter columns as self-employed earnings are imputed based on relatively coarse (i.e., census regional or national) geographic variation in self-employment to wage income ratios, and as such are likely to be attenuated once we control flexibly for fraction Black population. As shown in Columns (5) and (6), income coefficients for whites remain positive but are now no longer statistically significant. However, for log wage income, the δ w coefficients in Columns (8) and (9) are positive and statistically significant after including percent Black controls. These results suggest that our null schooling and income results for Blacks are likely not a function of Black majority areas being excluded from malaria control efforts.
We also test for racial targeting in the malaria eradication programs by exploring heterogeneity in our schooling and income results by the pre-campaign level of residential segregation. The literature on malaria and other health programs in the South indicates that public health authorities in the early 1900s were largely aware of the network effects of diseases. Despite this, had state-level authorities discriminated by race in administering the eradication program, we would expect schooling and income gains, particularly for Blacks, to decrease with the level of segregation. That is, if Blacks could only gain from the program as a result of “spill-overs” from treatment concentrated in white-majority areas, then these spillovers should be expected to be the highest in areas where Blacks and whites were the most integrated.
We proxy for segregation with the neighbor-based segregation index developed in Logan and Parman (Reference Logan2017). The measure is increasing in the level of segregation. We follow a similar approach to the Rosenwald school access analysis and estimate Equation (2) by race and segregation tercile.
Results from this exercise do not show consistently higher income and schooling effects for less segregated areas, supporting the hypothesis that eradication programs did not discriminate by race. As shown in Figures 11 and 12, which plot results by segregation tercile for schooling and income, respectively, there does not seem to be any clear pattern in either schooling or income gains by pre-program segregation levels for both races. Income results for whites are highest in the middle segregation tercile, but schooling results for whites are fairly consistent across terciles. The coefficients for Blacks are not statistically different from each other across segregation levels for both outcome variables.
EDUCATION RESULTS BY TERCILES OF RESIDENTIAL SEGREGATION DEPENDENT VARIABLE: COMPLETED MIDDLE SCHOOL
Notes: Each point (and the associated standard error) is from a separate regression, and denotes the δ r coefficient from estimating Equation (2) for a particular tercile of the constructed residential segregation index. Higher terciles denote higher levels of segregation. Panels (A) and (B) display the δ w and δ b coefficients for whites and Blacks, respectively. The specification in all panels includes the education controls, as well as county x race and state x cohort bin x race fixed effects.
Source: Authors’ calculations.

INCOME RESULTS BY TERCILES OF RESIDENTIAL SEGREGATION DEPENDENT VARIABLE: LOG INCOME, ADJUSTED FOR SELF-EMPLOYED EARNINGS
Notes: Each point (and the associated standard error) is from a separate regression, and denotes the δ r coefficient from estimating Equation (2) for a particular tercile of the constructed residential segregation index. Higher terciles denote higher levels of segregation. Panels (A) and (B) display the δ w and δ b coefficients for whites and Blacks, respectively. The specification in all panels includes the income controls, as well as county x race and state x cohort bin x race fixed effects.
Source: Authors’ calculations.

THE BOLL WEEVIL
The relatively high spatial correlation between cotton production and pre-program malaria endemicity implies that our results may be confounded by any time-varying shocks to cotton production, such as the arrival of the boll weevil, that coincided with the period of the eradication program. Footnote 41
We test for this alternative hypothesis by including several proxies for a county’s cotton intensity in our baseline specification and continue to find positive income and schooling results for whites. We obtain county-level cotton acreage per capita from the Census of Agriculture. In our first test of this hypothesis, we allow for non-parametric shocks to cotton production by taking the cotton acreage per capita in 1900 in an individual’s county of birth and interact it with birth year bins. As cotton productivity itself could be impacted by malaria eradication, we include an alternative test of this hypothesis. We instead include cotton acreage per capita in 1900 in an individual’s county of residence in 1940 interacted with birth year bins. Our results are less likely to be confounded as cotton productivity in the county of residence in 1940 is less closely linked to childhood exposure to malaria endemicity, though it may still independently impact adult income levels. In both tests of the hypothesis, cotton acreage per capita is interacted with race to flexibly control for differential effects of cotton production shocks by race.
Results for this analysis are displayed in Table 10. Footnote 42 Column (1) replicates our baseline schooling results by race, as displayed in Column (5) of Table 2. Column (2) re-runs this specification and adds controls for cotton acreage per capita in the county of birth in 1900 interacted with birth year bins. Column (3) modifies the specification in Column (1) and controls for cotton acreage per capita in 1900 in the county of residence, in 1940 interacted with birth year bins. Columns (4)–(6) display results for our income measure corresponding to the specifications in Columns (1)–(3). Across all columns, the δ w coefficient for whites remains significant and positive, whereas we continue to see negligible schooling and income gains for Blacks. Footnote 43
ROBUSTNESS TO ALTERNATIVE HYPOTHESES—COTTON PRODUCTION CONTROLS

* = Significant at the 10 percent level.
** = Significant at the 5 percent level.
*** = Significant at the 1 percent level.
Notes: Columns (1)–(3) correspond to middle school completion and Columns (4)–(6) correspond to log income adjusted for self-employed earnings. Columns (1) and (4) replicate the baseline regression results displayed in Column (5) of Table 2 and Table 3, respectively. Columns (2) and (5) include decadal cotton acreage in childhood county. Columns (3) and (6) include cotton acreage in 1900 interacted with birth year bin. All columns include controls for 1910 male unemployment rate in childhood county interacted with birth year bin and 1890 non-malaria mortality per 1,000 population in childhood county interacted with birth year bin. Columns (4)–(6) additionally include controls for Rosenwald exposure in childhood county. Robust standard errors are clustered at the childhood county level.
Source: Authors’ calculations. The table presents results from estimating Equation (2).
CONCLUSION
This paper studies the impact of a large-scale public health intervention, the malaria eradication program in the early 1900s U.S. South, on Black-white productivity gaps. Conventional wisdom dictates that the socioeconomic benefits from disease eradication should disproportionately accrue to those individuals most vulnerable to contracting and experiencing productivity losses from the disease. However, in the presence of inadequate schooling access and asymmetric barriers to labor market entry, minority groups may not be able to fully realize meaningful human capital gains from public health programs.
We use linked census records to evaluate the impact of malaria eradication on schooling attainment and earnings. Our empirical design is a difference-in-differences approach where spatial variation comes from pre-eradication malaria endemicity, and time variation comes from differential cohort-level exposure to the start of the eradication program.
We determine that malaria eradication led to increases in the schooling and income gaps between Blacks and whites. Blacks exposed to the treatment became more likely to be employed as farm laborers, though they experienced no meaningful income gains. This suggests white farm owners/tenants may have been able to extract profits from employing a healthier Black workforce that received no higher pay, though data limitations prevent us from fully testing this hypothesis. We also find that more exposed individuals were more likely to migrate. Among the subsample of migrants, we find suggestive evidence that more exposed Blacks received income gains relative to more exposed whites, though this cannot be precisely estimated. Finally, we find no evidence that school access/quality played an important role in our (lack of) schooling result for Blacks.
To the best of our knowledge, malaria eradication efforts were not targeted at a specific race. That we see productivity gaps arise even in this setting suggests that untargeted health interventions may end up unintentionally exacerbating racial differences. The South in the 1920s, amid Jim Crow, was deeply hostile toward Blacks. Schools were segregated, and Black men in the labor force were limited to a certain set of occupations and tasks, unable to advance into supervisory or more prestigious careers. Malaria was a debilitating disease to all persons living in the South, and even though it was eradicated for everyone, Blacks were effectively shut off from translating improved health into better economic outcomes due to the rampant discrimination present in the South. Our findings suggest the full benefits of health programs may only be realized by minority groups if they are accompanied by a concerted effort to lower barriers to entry in education and labor markets.