INTRODUCTION
The use of multipurpose legumes has been promoted to increase the productivity and the resilience of smallholder systems in the tropics (Giller Reference Giller2001; Cherr et al. Reference Cherr, Scholberg and McSorley2006). Benefits reported for cropped soils are the addition of nitrogen (N) via symbiotic N2 fixation, the build-up of soil organic matter stocks, reduction of run-off and soil erosion and the enhancement of quantity and quality of crop residues that are fed to livestock (Said & Tolera Reference Said and Tolera1993; Boddey et al. Reference Boddey, de Moraes Sá, Alves and Urquiaga1997; Giller Reference Giller2001; Pansak et al. Reference Pansak, Hilger, Dercon, Kongkaew and Cadisch2008). Legume performance in providing those benefits depends largely on biomass production. N2 fixation and N uptake were reported as being proportional to legume biomass production (Douxchamps et al. Reference Douxchamps, Humbert, van der Hoek, Mena, Bernasconi, Schmidt, Rao, Frossard and Oberson2010; Unkovich et al. Reference Unkovich, Baldock and Peoples2010). Economic benefits from legumes are also directly linked to legume productivity (Ebanyat et al. Reference Ebanyat, de Ridder, de Jager, Delve, Bekunda and Giller2010).
The general degree of system improvement therefore depends on legume biomass production, which in turn depends on the legume adaptation to climate and soil fertility conditions. It is common for soil conditions to be highly heterogeneous in most low input smallholder farming systems (Tittonell et al. Reference Tittonell, Vanlauwe, Leffelaar, Rowe and Giller2005; Zingore et al. Reference Zingore, Murwira, Delve and Giller2007), and legumes must be targeted to locations where only a few factors limit biomass production (Ojiem et al. Reference Ojiem, Vanlauwe, de Ridder and Giller2007). Numerous constraints determine soil fertility in hillside environments (de Costa & Sangakkara Reference de Costa and Sangakkara2006) and the issue must be addressed within a landscape perspective, as biomass production is very much affected by landscape position (Kravchenko et al. Reference Kravchenko, Bullock and Boast2000; Iqbal et al. Reference Iqbal, Read, Thomasson and Jenkins2005; Thelemann et al. Reference Thelemann, Johnson, Sheaffer, Banerjee, Cai and Wyse2010).
Often, a rich database on the adaptation of legumes to soil types is available for well-known legumes. However, for new legume options, very limited information is available and there is no consensus on how to assess the environmental factors systematically (i.e. soil properties and topography) limiting biomass production for new varieties.
Biomass studies are based either on soil chemical and/or physical properties (Daellenbach et al. Reference Daellenbach, Kerridge, Wolfe, Frossard and Finckh2005; Ojiem et al. Reference Ojiem, Vanlauwe, de Ridder and Giller2007; Ebanyat et al. Reference Ebanyat, de Ridder, de Jager, Delve, Bekunda and Giller2010) or on topography (Guretzky et al. Reference Guretzky, Moore, Knapp and Brummer2004; Thelemann et al. Reference Thelemann, Johnson, Sheaffer, Banerjee, Cai and Wyse2010), or both (Kravchenko et al. Reference Kravchenko, Bullock and Boast2000; Iqbal et al. Reference Iqbal, Read, Thomasson and Jenkins2005). To the knowledge of the present authors, topsoil properties, topography and soil profile description have never been combined in a single biomass study.
In 2007, the tropical multipurpose legume Canavalia brasiliensis Mart. Ex. Benth (canavalia) was introduced into the smallholder crop–livestock system of the Nicaraguan hillsides with the purpose of restoring and maintaining soil fertility of cropping areas and increasing the availability of dry season feed for livestock. The main objectives of the present study were to: (i) identify the factors limiting on-farm biomass production of canavalia by combining information from soil profiles, topsoil properties and topography; and (ii) define the best landscape position for introducing canavalia for improved crop–livestock production.
MATERIALS AND METHODS
Sites and field experiments
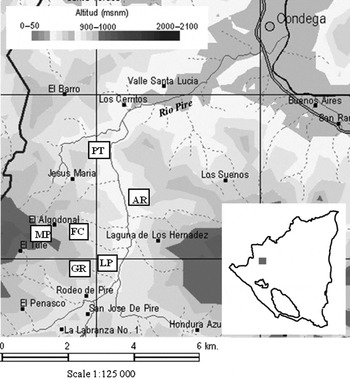
The study area is located in the Rio Pire watershed (Department of Estelí, northwestern Nicaragua), within a 2 km radius around the community of Santa Teresa (13°18′N, 86°26′W, 600–900 m a.s.l.). Soils are classified as Udic and Pachic Argiustolls (Suppl Mat 1). The climate is classified as tropical savannah according to the Köppen–Geiger classification (Peel et al. Reference Peel, Finlayson and McMahon2007). Annual mean rainfall (since 1977) is 825 mm (INETER 2009) and has a bimodal distribution pattern between June–August and September–November. Six farmers from Santa Teresa who were interested in integrating canavalia on a part of their cropped land were identified. They chose the experimental sites within their farms themselves; these were named after the farmer's initials. The sites presented a range of topographical features with varying soil characteristics, representative of the cropping area environmental conditions of the Rio Pire watershed (Fig. 1). Three sites were located in the bottom of the valley (PT, AR and LP), two at a medium level (GR and FC) and one on the top of the hill (MP). All sites were part of the same slope with eastern exposure except site AR, which was situated in front on the western exposed slope. Sites AR and GR showed high topographic variability within-site, as they were located on irregular small hills and depressions. Sites MP and FC were located on irregular slopes. Sites LP and PT were flat with homogeneous topography.
Location of the sites in the Rio Pire watershed (source: MAGFOR, see Suppl Mat 1). The map inserted at the bottom right depicts Nicaragua, the grey square being the study area.

Farmers were traditional crop–livestock smallholders, cultivating maize and beans on c. 2 ha of land and grazing their cattle on communal pastures based on Jaragua grass (Hyparrhenia rufa (Nees) Stapf.). Cultivation is carried out essentially with hand-held tools. Prior to sowing maize, land is usually prepared with a plough pulled by oxen if accessibility to the field and slopes allow; otherwise it is prepared manually using a hoe. Maize is sown at the end of May, at the onset of the first rainy season. Maize is fertilized with urea (80 kg/ha on average) 8 days after sowing, sometimes complemented with compound fertilizer (120 g N/kg, 300 g P2O5/kg and 100 g K2O/kg) at fertilizer amounts up to 96 kg/ha, in one dose 22 days after sowing. At maturity, plants are cut above the ears and maize ears are left drying on the stalks for 2–3 months. Meanwhile, common beans are sown around mid-September between the maize rows, to take advantage of this part of the bimodal rainfall pattern. Maize and beans are both harvested in December. In January, at the beginning of the dry season, forage becomes scarce in the grazing areas and farmers let their cattle enter the cultivated fields to graze on crop residues.
Trials aiming at comparing the N budget of the traditional maize–bean rotation (1st rainy season–2nd rainy season) with an alternative maize–canavalia rotation were established on all sites. Full details of the design, relevance of the proposed rotation for smallholder crop–livestock farmers and resulting N budgets are reported in Douxchamps et al. (Reference Douxchamps, Humbert, van der Hoek, Mena, Bernasconi, Schmidt, Rao, Frossard and Oberson2010). Since the aim of the present study was to identify factors influencing the high variability in canavalia biomass production observed in these trials, only the plots with maize–canavalia rotation are considered here. In brief, four 100 m2 plots of maize–canavalia rotation were repeated in three completely randomized blocks at each site, resulting in 12 plots per site and a total of 72 plots on six farms. At the end of September 2007, weeds were cut with large knives (machetes) and canavalia (CIAT 17009) was sown with a stick between maize rows with a row-to-row spacing of 0·5 m and a plant-to-plant spacing of 0·2 m. No fertilizer was applied to canavalia. At the end of January 2008, four different proportions of canavalia above-ground biomass were removed from the four plots in each block to simulate different grazing rates for the N budget experiment (Douxchamps et al. Reference Douxchamps, Humbert, van der Hoek, Mena, Bernasconi, Schmidt, Rao, Frossard and Oberson2010). In June 2008, the remaining biomass of canavalia was cut before planting maize and the plots were managed the same way as in 2007, with canavalia sown at the end of September 2008 between the maize rows and cut 4 months later at the end of January 2009. Precipitation during canavalia growth (September–January) was 540 mm in 2007 and 460 mm in 2008, which was above the normal rainfall in the region. Temperatures for both years were similar, with a mean of 23 °C, a maximum of 32 °C and a minimum of 14 °C (INETER 2009).
Biomass production of canavalia
Before cutting canavalia in January 2008 and 2009, above-ground biomass production and soil cover were determined in each plot with the comparative yield method (Haydock & Shaw Reference Haydock and Shaw1975), in which the yields from 1 m2 quadrats placed at random were rated with respect to a set of five reference preselected quadrats that provided a scale covering the range of biomass encountered within each plot. This method was chosen because biomass production needed to be evaluated without being harvested, for the purpose of the N budget experiment.
Environmental factors
Topsoil chemical and physical characteristics
In September 2007, topsoil (0–100 mm) was collected with a soil corer in each plot (12 cores per plot), bulked together to form a composite sample per plot, air-dried, sieved at 2 mm and brought to the CIAT laboratories in Cali, Colombia. Samples were analysed for soil organic carbon (SOC) by K2Cr2O7 oxidation (Nelson & Sommers Reference Nelson, Sommers, Page, Miller and Keeney1982), total N (Ntot) by a modification of the Berthelot reaction (Krom Reference Krom1980), available phosphorus (P) using anion exchange resins (Tiessen & Moir Reference Tiessen, Moir and Carter1993), total P (Ptot) by acid digestion (Olsen & Sommers Reference Olsen, Sommers, Page, Miller and Keeney1982), pHH2O in a soil-water suspension (Salinas & Garcia Reference Salinas and Garcia1985), cation exchange capacity by NH4 + saturation (Mackean Reference Mackean1993) and mineral N by 1 m KCl (Anderson & Ingram Reference Anderson and Ingram1993). The same sampling was repeated in October 2008 and samples were again analysed for mineral N. A mean of the mineral N data of both years was used for the subsequent statistical analysis.
Soil physical properties of the topsoil (0–100 mm) of four contrasting sites (PT, GR, LP and MP; two plots per block) were determined in the soil physics laboratory of CIAT. An unsieved soil sample was used for the determination of aggregate stability (Yoder Reference Yoder1936) with an apparatus similar to that described by Bourget & Kemp (Reference Bourget and Kemp1957). Three undisturbed soil cores of 50 mm of diameter per 50 mm length were taken per plot and analysed for water retention (Richards & Weaver Reference Richards and Weaver1944), bulk density and texture (Bouyoucos Reference Bouyoucos1962).
Topography
Slope angle was measured on three representative points in each plot using an A mason level. Slope position was defined for each plot according to the five-unit model of Ruhe & Walker (Reference Ruhe and Walker1968) and included summit, upper slope, mid slope, lower slope and bottom positions. As in most of the studies applying this model (Iqbal et al. Reference Iqbal, Read, Thomasson and Jenkins2005), the boundary lines between position types were arbitrary. The topographic description of the plots was completed for each plot by the hill form (convex, straight or concave).
Soil profiles and rooting patterns
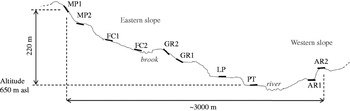
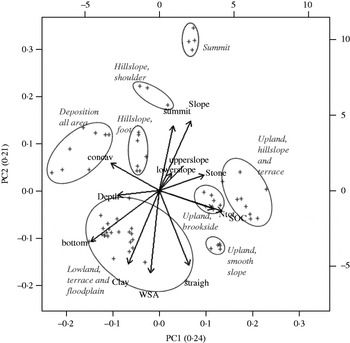
Ten groups of plots with common properties were defined based on chemical and topographic properties, i.e. on all properties measured at single plot level, using an ordination plot (Anderson Reference Anderson2004). Each group corresponded to a distinct landscape position (Fig. 2). In the second year, 4 months after canavalia establishment, one soil profile was opened for each group, at a 0·15 m distance parallel to plant rows, on a length of c. 1·20 m. Profiles were as deep as permitted by soil hardness. Profiles were named after the site in which they were examined. Detailed profile descriptions included sketch maps, horizon identification (Brady & Weil Reference Brady and Weil2007), soil colour, structure and fractions, as well as maps of rooting patterns. Soil colour was defined following a standard colour chart (Oyama & Takehara Reference Oyama and Takehara1967). Soil fractions (i.e. proportions of clay, silt, sand, gravel and stones) were determined visually in the field according to the diameter ranges of Kuntze et al. (Reference Kuntze, Niemann, Roeschmann and Schwerdtfeger1981). Stones were defined as soil particles with a diameter >60 mm. The weight of stones, clay, silt and sand per profile was calculated from the fraction percentage of each horizon and an estimation of its bulk density following Brady & Weil (Reference Brady and Weil2007). The amount of each fraction per profile was the sum of the amounts in each horizon. The amount of fine earth per profile was the sum of the amounts of clay, silt and sand. A transparent plastic sheet was placed on the wall of the profile and positions of visible root contacts were marked with a pen (Tardieu Reference Tardieu1988). All living roots were attributed to canavalia plants, as there were no other plant species in the soil surrounding the profile. The resulting point patterns were then digitalized. Roots were made visible up to the plant line using small knives, and sketched. Lateral roots, which are known to be extended for canavalia (Alvarenga et al. Reference Alvarenga, da Costa, Moura Filho and Regazzi1995), were not included in the sketches as their excavation was not feasible in the present trial.
Transversal view of the landscape positions of the profiles. MP1, upland, hillslope; MP2, upland, terrace; FC1, upland, smooth slope; FC2, upland, brookside; GR2, hillslope shoulder; GR1, hillslope foot; LP, lowland, terrace; PT, floodplain; AR1, depositional area; AR2, summit.

Statistical analysis
Statistical analyses were performed using the program R (R Development Core Team 2007). Data from the profiles were assigned to all plots from the own profile group. For soil physical properties, which were not defined for all plots (see above, topsoil chemical and physical characteristics), average values from their own group were imputed for missing values. First, each type of data (profiles, topographic properties and topsoil properties) was analysed separately. Then, the three types of data were combined and analysed using multivariate statistics.
Canavalia
Canavalia data were submitted to a Wilcoxon rank-sum test to check for significant differences between the 2 years. The significance of the effect of the cut of 2007 on the performance of 2008 was tested by an analysis of variance (ANOVA) using the aov function in R (Chambers et al. Reference Chambers, Freeny, Heiberger, Chambers and Hastie1992). The model contained treatment as fixed factor, site and block as random factors, with block being nested within site. The significance level chosen was P = 0·05.
Topsoil data
The topsoil properties influencing canavalia biomass production were selected with a stepwise multiple regression, using the function lme in R (Pinheiro & Bates Reference Pinheiro and Bates2000).
Topographic data
The proportion of variability in canavalia biomass production explained by topographic properties was determined with a multiple regression, using the function lm in R (Pinheiro & Bates Reference Pinheiro and Bates2000). Categorical variables were fitted by set.
Profile data
In the profiles, root aggregation index and intensity of soil exploration by roots were determined by analysing root point patterns using the package spatstat in R (Baddeley & Turner Reference Baddeley and Turner2005). The root aggregation index is measured based on the nearest neighbour distance, and indicates the degree of randomness in the spatial root distribution pattern. It takes values from 0 to 2, with 0 indicating the maximum degree of clustering, 1 indicating a random pattern and 2 indicating a uniform pattern (Baddeley & Turner Reference Baddeley and Turner2005).
Combination of the three data sets
First, the environmental factors (i.e. topsoil, profile and topographic variables) influencing canavalia biomass production were selected with a stepwise multiple regression, using the function lme in R (Pinheiro & Bates Reference Pinheiro and Bates2000). Right-skewed variables were log-transformed before the regression. Model simplification was done using stepAIC in R (Venables & Ripley Reference Venables and Ripley2002), which uses the Aikake information criterion (AIC) as automated selection tool according to maximum likelihood. The significance level chosen was P = 0·05.
Second, the principal component analysis (PCA) was used to link environmental properties to landscape positions from the profile groups. The PCA was performed using princomp in R (Mardia et al. Reference Mardia, Kent and Bibby1979). Variables were scaled and standardized before the PCA.
RESULTS
Biomass production of canavalia
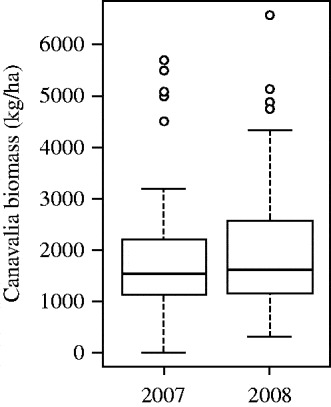
Canavalia above-ground biomass production per plot varied from 0 to 5700 kg/ha in 2007 and from 290 to 6570 kg/ha in 2008 (Fig. 3). It did not significantly differ between 2007 and 2008 (P = 0·740). The biomass removal treatments applied when cutting canavalia at the end of the growing season 2007 had no significant effect on the production in 2008 (P = 0·407). Therefore, for each plot, mean values of both years were used in the subsequent analysis. Within-site variation ranged from 0·25 (LP site) to 0·70 (AR site), whereas variation between sites was 0·32. Soil cover by canavalia varied from 0·13 to 0·96 of the soil surface, with a mean value of 0·53. It was positively correlated with canavalia biomass (cover (%) = 30 Ln (biomass (kg/ha))–171; R 2 = 0·78). An increase in biomass up to 3000 kg/ha also induced an important increase in soil cover, whereas beyond this yield the cover increased by only c. 0·05 for an increase of 1000 kg/ha biomass. Cover was not included in the multiple regression analysis because it was highly correlated with canavalia biomass production.
Canavalia above-ground biomass production on all sites in 2007 and 2008. The ends of the boxes are the upper and lower quartiles, the horizontal bold lines are the medians, the vertical lines are the full range of values, and the dots are outliers.

Topsoil properties
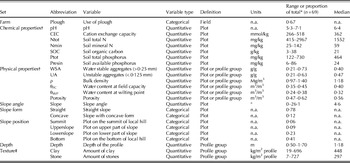
The ranges of values taken by the topsoil variables and their median are presented in Table 1. All quantitative variables except for water retention and pH took a broad range of values. In the plots, topsoil had no extreme pH values, indicating slightly acid to neutral soils. SOC ranged from 3 to 38 g/kg, and Ntot ranged from 415 to 2967 mg/kg. The median available P was 24 mg/kg.
Overview of the variable used in the statistical analyses

* Range is given for quantitative variables and proportion of total is given for categorical variables.
† Properties measured in the topsoil (0–0·1 m).
‡ Properties measured on the whole profile, for a volume of 1 m2 × profile depth.
n.a. = non applicable.
The regression on the topsoil data showed that Ntot, bulk density, pH, SOC and Nmin affected significantly canavalia biomass production (P = 0·003, 0·004, 0·007, 0·010 and 0·010, respectively), and explained 0·45 of the variation in canavalia biomass production.
Topographic properties
The ranges of values observed for the topographic variables are presented in Table 1. About 0·39 of the plots had slope angle of more than 11°. Most of the plots (0·78) had a straight slope form. Few plots (0·06) were located on a local summit, whereas 0·64 of the plots were on the lower part (0·23) or the bottom of the slopes (0·41). In the profiles, the amount of stones ranged from 7 to 727 kg/m2, whereas the amount of fine earth (i.e. all particles finer than 2 mm) ranged from 175 to 2328 kg/m2. The amount of fine earth per profile was highly correlated with depth (R 2 = 0·89).
The regression on topographic data only showed that topographic variables explained a significant proportion of the variation in canavalia biomass (0·32, P = 0·001), with slope position as main factor.
Soil profiles and rooting patterns
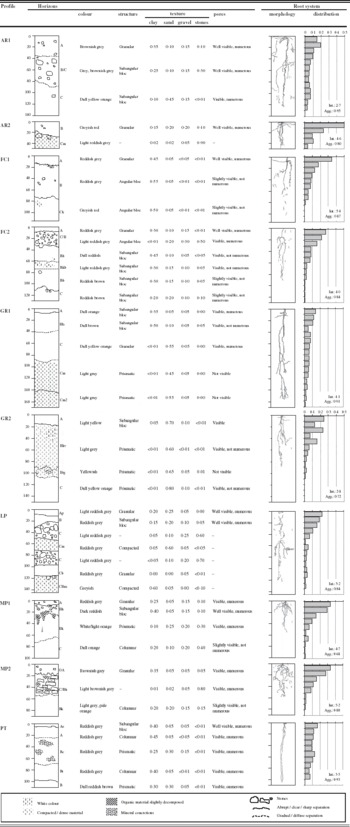
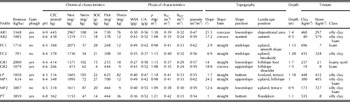
Description of soil profiles is presented in Table 2. The topsoil and topographic characteristics of the plots where profiles were made are presented in Table 3. Profiles on lower slope or bottom positions were deeper than profiles located on upper slope or summit positions. Stony or compacted layers affected root morphology. More than 0·20 of roots were counted in the first 0·2 m soil depth in the profiles with high amounts of organic matter as well as in the profiles where a stony layer hindered root growth. The root aggregation index for all profiles was between 0·6 and 1.
Profiles description, including horizons identification, soil colour, structure and fractions, as well as rooting patterns. Root distribution is the number of root points per depth, in proportion of total. Intensity (Int., number of root points/dm2) and aggregation index (Agg.) are given in the bottom right of each root distribution profile

Topsoil and topographic properties of the plots where profiles were described

ρ, bulk density; CEC, cation exchange capacity; SOC, soil organic carbon; Nmin, soil mineral N; Ntot, total soil N; θFC, water content at field capacity; θWP, water content at wilting point; Presin, available phosphorus; Ptot, total phosphorus; UA, unstable aggregates; WSA, water stable aggregates.
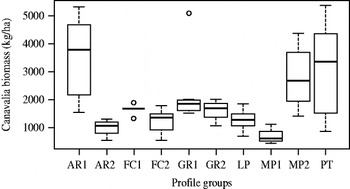
The biomass production of canavalia associated with each profile group is shown in Fig. 4. A one-way ANOVA showed that there were significant differences between the mean canavalia biomass production per profile group (P < 0·001).
Canavalia above-ground biomass production per profile group. The ends of the boxes are the upper and lower quartiles, the horizontal bold lines are the medians, the vertical lines are the full range of values, and the dots are outliers.

Combination of the three data sets
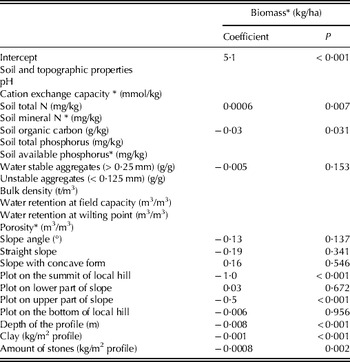
Results of the stepwise multiple regression indicated that the variables retained after the model reduction explained a significant proportion of the variation in canavalia biomass (0·61, P < 0·001). Estimated parameters of the reduced model and related P-values are presented in Table 4. The major factors influencing canavalia biomass production were (in order of decreasing significance): soil depth, total amount of clay in the profile, slope position, total amount of stones in the profile, topsoil SOC and Ntot.
Equation parameters of the reduced model assessing the relationship between canavalia biomass and soil and topographic properties, and their significance. Variables not retained by the model are left blank

* Variables log-transformed before the regression to approach a normal distribution.
The first four components of the PCA on the environmental properties accounted for 0·68 of the variation between the plots. Figure 5 gives a projection of the plots and of the environmental properties on the two first components. For the sake of clarity, only the variables from the reduced linear regression model are displayed. Plots from the same profile group were close to each other. Circles were drawn around them, and labelled according to the landscape position of the corresponding profile.
Projection of the environmental properties and the plots on the two first components. For the sake of clarity, only variables from the reduced regression model are displayed. Circles are drawn around the plots from the same profile group and labelled in grey with the corresponding landscape position. Variance explained by the components is given in parenthesis.

DISCUSSION
Biomass production, topsoil properties, topography and soil profiles
Canavalia biomass production was similar to the 230–6550 kg/ha observed when canavalia was planted at the end of the rainy season and grown during the dry season in on-station trials in Brazil (Burle et al. Reference Burle, Lathwell, Suhet, Bouldin, Bowen and Resck1999). SOC varied from an amount close to that measured on eroded soils in the Nicaraguan hillsides (Velasquez et al. Reference Velasquez, Lavelle and Andrade2007) to a C amount characteristic for arable soils. Soil water content at field capacity was comparable to the 0·42 m3/m3 reported by Maraux et al. (Reference Maraux, Lafolie and Bruckler1998) for a Nicaraguan silty loam soil, but the water content at permanent wilting point was slightly higher than the 0·25 m3/m3 reported by the same author. With a median of 24 mg/kg, available P levels were adequate to high for crop growth on most plots, while only 0·06 of the plots had less than 7 mg/kg, which is suggested as limiting by Cantarella et al. (Reference Cantarella, van Raij and Quaggio1998).
The proportion of the variation in biomass production explained by topsoil data was similar to the 0·50 obtained by Daellenbach et al. (Reference Daellenbach, Kerridge, Wolfe, Frossard and Finckh2005) when trying to explain total biomass production of a cassava-based cropping system with a set of topsoil properties. In the regression on topographic data, slope position appeared as a significant factor, which showed that indeed the landscape perspective was important in the present biomass study.
The soil profile descriptions (Table 2) reveal that profiles with no major obstacles hindering root growth had a relative homogeneous root distribution in depth and an aggregation index between 0·9 and 1, close to randomness (AR1, GR1 and PT). Profiles with obstacles (i.e. a stony or compacted layer in the upper part of the profile) had an irregular root distribution in depth and an aggregation index between 0·6 and 0·8, meaning that root pattern was slightly clustered (AR2, GR2, MP1 and MP2). The highest canavalia biomass production was obtained on profiles AR1 and PT, both with an aggregation index close to randomness, i.e. with no major obstacles to root growth (Fig. 4). GR1 also showed no major obstacles for roots, but it had a much more sandy texture and no more visible pores in depth compared with AR1 and PT, which translated into a lower biomass production due to poor aeration and water supply. After AR1 and PT, the next outstanding profile is MP2. Despite showing clear obstacles to roots, MP2 is a brown soil rich in organic matter. In soils with sandy texture and lower nutrient content, roots have to explore a larger soil volume to supply plants with water and nutrients, which renders obstacles more problematic (AR2 and GR2). Looking at profile data only, it is clear that soil fractions, especially stones, and organic matter content affected canavalia biomass production.
Environmental properties affecting canavalia biomass production
As is often the case some variables, such as Ntot and SOC, were typically correlated (Dharmakeerthi et al. Reference Dharmakeerthi, Kay and Beauchamp2005). However, for the stepwise multiple regression, dropping one variable deteriorated the model fit, so both were kept in the subset of variables. Likewise, replacing θFC and θWP with an estimation of available water content in the topsoil led to a loss of information and less reliable model, and both variables were maintained in the analysis. The proportion of the variation in canavalia biomass explained by this combined model (0·61) was less than the sum of variation explained by the topsoil and by the topographic properties separately (0·45 and 0·32, respectively). Trying to understand the variability of canavalia biomass production by looking at the data sets separately would have led to an overestimation of the variance explained, due to the existence of strong correlations between soil and topographic properties. About 0·40 of the variation in canavalia biomass production remained unexplained by the environmental properties. This is probably due to missing information such as nutrient and water content in layers deeper than 0·1 m. Moreover, the availability of some macronutrients, like potassium, calcium and magnesium, or of micronutrients, was not measured. Microtopography can also have a significant effect on crop yields (Wezel Reference Wezel2006). Finally, another significant factor for unexplained variation could be the farmers. All farmers managed the plots in a similar way, but not all entered the fields with the same frequency and the same care (Douxchamps et al. Reference Douxchamps, Humbert, van der Hoek, Mena, Bernasconi, Schmidt, Rao, Frossard and Oberson2010).
Environmental properties and landscape positions
The projection of the plots and of the environmental properties (Fig. 5) showed that deep soils were found on both lowland and depositional areas. Plots on lowland positions were characterized by high clay content. Upland and hillslope positions were characterized by steep slopes, as expected. From the perspective of the first two components, Ntot and SOC were associated with upland positions. However, plotting the third and fourth components of the PCA shows that the depositional area is also a sink for nutrients (data not shown). This is consistent with the results from Gandah et al. (Reference Gandah, Brouwer, Hiernaux and Van Duivenbooden2003) as well as Wezel (Reference Wezel2006) who found that SOC and N significantly decreased from upland to lowland, except in concave positions.
Landscape position favouring high canavalia biomass production
The best suitable soil for canavalia production was found to be deep, well-drained and rich in SOC and clay. The landscape positions presenting these characteristics are depositional areas, footslopes and floodplains. Canavalia cannot fully achieve its potential as a drought-tolerant legume on soils with low SOC content nor on shallow and stony soils that hinder deep rooting, as in summit positions. Land with some limiting characteristics can compensate with a few good ones, e.g. MP2, had high amounts of SOC in spite of high amounts of stones.
The characteristics of the best location for canavalia agronomic performance conform to what is commonly recognized as ‘good’ soil. Yield superiority at lower slope positions has been explained by increased available water, deposition of organic matter and nutrients by overland erosion and subsurface flow (Agbenin & Tiessen Reference Agbenin and Tiessen1995) and has been observed in many landscape studies (Stone et al. Reference Stone, Gilliam, Cassel, Daniels, Nelson and Kleiss1985; Rockström et al. Reference Rockström, Barron, Brouwer, Galle and de Rouw1999; Kravchenko et al. Reference Kravchenko, Bullock and Boast2000; Kravchenko & Bullock Reference Kravchenko and Bullock2002; Oswald et al. Reference Oswald, de Haan, Sanchez and Ccanto2009). Rockström & de Rouw (Reference Rockström and de Rouw1997) added that the effect of slope position on yields was reinforced during periods of water shortage. Butler et al. (Reference Butler, Goetz and Richardson1986) also found more biomass production on concave than on convex positions. However, lower slope position alone does not guarantee abundant canavalia production. If these soils are associated with low drainage properties, they may become partially flooded during the rainy season and be less suitable. Other legumes may be more suitable to poorly drained lands. For example, Desmodium ovalifolium would be a suitable option for periodically flooded and shallow soils (Schmidt et al. Reference Schmidt, Peters and Schultze-Kraft2001) if grazed at the beginning of the dry season, since it is not drought tolerant.
Except for the SOC, the characteristics of the locations favouring high canavalia biomass production are all directly related to drought proneness, suggesting that canavalia mainly tolerates drought due to its deep rooting ability. If soil conditions do not allow water to be tapped from deeper soil layers, growth and biomass production could be markedly reduced. Root system observation for different types of profiles at the end of the dry season would allow confirmation of this hypothesis.
The adaptation of canavalia to acid and P depleted soils, as reported by Peters et al. (Reference Peters, Franco, Schmidt and Hincapié2002), could not be tested in the present study because available P was not limiting at most sites and pH ranged from 5·3 to 7·1. The potential of canavalia to improve productivity on acid and/or low P soils would therefore need to be confirmed by further studies.
Perspective for integrating canavalia in the Nicaraguan hillsides
The purpose of introducing canavalia into the Nicaraguan hillsides was twofold: (i) to restore and maintain soil fertility of cropping areas and (ii) to increase the availability of feed to livestock during the dry season. Canavalia has the potential to improve the crop–livestock system as it can produce high amounts of biomass. It is important to note that even on less productive, shallow and stony soils canavalia could still make a contribution to improving soil cover and fertility and feed availability. However, a marked increase in agricultural production will not occur on these less productive areas in the short-term without additional inputs of mineral fertilizer or animal manure. If canavalia is used on slopes, it needs to be combined with other soil-conservation measures to restore soil fertility in the short to medium term, as advised by Vanlauwe et al. (Reference Vanlauwe, Bationo, Chianu, Giller, Merckx, Mokwunye, Ohiokpehai, Pypers, Tabo, Shepherd, Smaling, Woomer and Sanginga2010) to remove constraints of soils that are less responsive to soil fertility-management practices. Various measures have been documented for smallholder systems in hillside environment, for instance the incorporation of grass strips along contours or the promotion of soil macrofauna activities through maintenance of a litter cover (de Costa & Sangakkara Reference de Costa and Sangakkara2006).
Farmers will adopt canavalia only if the perceived benefits exceed the perceived costs. The cost of producing canavalia comes mainly from buying seed and labour, and amount to US$110–120/ha (Douxchamps et al. Reference Douxchamps, Mena, van der Hoek, Benavidez and Schmidt2011). Farmers need to recover this investment from an increase either in milk production or in maize yields, of which only the additional income from milk sales is perceived as a direct benefit. Improved crop residues with canavalia increase dry matter biomass production by 3000 kg/ha, leading to an additional dry season milk production of c. 5 kg/ha per day over c. 9 weeks, producing 300 additional litres of milk (CIAT 2008). This provides the farmers an extra income of c. US$100, with an average milk price of US$0.32/kg during the dry season. This approximate calculation suggests that growing canavalia is only of economic interest at a biomass production of 3600 kg/ha and upwards.
However, this does not take into account longer-term benefits such as soil improvement, weed suppression and maize yield increase. Furthermore, labour is generally provided by family members and opportunity costs are often lower than the costs assumed in the present analysis. More detailed socio-economic studies are still needed to assess the benefits of canavalia biomass production and the factors influencing its adoption by smallholder farmers.
Concluding remarks
Landscape position strongly affected canavalia biomass production in farmers’ fields in Nicaragua. Canavalia cannot fully express its potential as a drought-tolerant cover legume on soils with low organic matter content as well as on shallow and stony soils that hinder deep rooting ability of the legume. Under these conditions, canavalia should be combined with other soil fertility management practices in order to build up an arable layer over time. Biophysical and economic trade-off analyses are needed to identify the minimum biomass production at the whole farm level and on the long term for farmers to adopt canavalia as a legume option. There is also a need for evaluating other legume options for less productive areas to improve the productivity and profitability of smallholder farms that are variable in their soil fertility conditions.
The three data sets generated and used (profiles, topsoil characteristics and topography) in the present field study were complementary. From the profile description it was clear that biomass studies should consider not only the topsoil but also the deeper soil layers, especially for deep-rooted crops. The combination of chemical and physical soil properties with soil profile and topographic properties resulted in an integrated understanding of soil fertility heterogeneity and showed that a landscape perspective must be considered when assessing the benefits expected from the integration of multipurpose legumes in hillsides environments.
Supplementary Material Reference
Suppl Mat 1. Municipio de Condega. Subgrupos Taxonómicos. Journal of Agricultural Science, Cambridge 2012; Suppl. Mat1 (available at http://journals.cambridge.org/AGS).
We warmly thank the six farmers of Santa Teresa (Don Antonio Ruiz, Don Felipe Calderón, Don Gabriel Ruiz, Don Lorenzo Peralta, Don Marcial Peralta and Don Pedro Torres) who participated in the present study. We gratefully acknowledge fieldwork assistance by Alexander Benavidez (INTA) and François-Lionel Humbert (ETH). Jesus Hernando Galvis, Don Arnulfo and Fabrizio Keller are also warmly thanked for the analysis of soil physical properties, as well as Andrea Rizzi for the programming of rooting patterns. We acknowledge statistical advice from Werner Stahel, Sam Yeaman, Harry Olde Venterink, Marti J. Anderson and Petr Smilauer. Financial support was provided by the North-South Center of ETH Zurich, Switzerland.