1 Introduction
In the ageing world, pension systems' design frequently evolves towards systems that are based on actuarially neutral principle. This leads to the evolution of many pension systems towards defined-contribution (DC) principles. They are applied not only in the case of financial defined contribution (FDC) schemes but also in the case of non-financial schemes under the pay-as-you-go regimesFootnote 1. Non-financial defined contribution (NDC) schemes were introduced in Latvia, Sweden, Poland and Italy (Chłoń-Domińczak et al., Reference Chłoń-Domińczak, Franco, Palmer, Holzmann, Palmer and Robalino2012). The principles underlying the design of NDC schemes are discussed in Góra and Palmer (Reference Góra and Palmer2004). Holzman and Palmer (Reference Holzman, Palmer, Holzman and Palmer2009) describe the design features of the NDC that make them desirable, compared with the counterfactual design of the defined benefit (DB) scheme. First, NDCs are fair in a sense that two individuals from the same birth cohort who make the same contributions into the scheme in the same period can expect to receive the same pension. Second, a generic NDC is, in principle, financially sustainable. The system is geared to maintain long-run equivalence between assets and liabilities at an unchanged contribution rate. The former means that the NDC scheme is a mechanism for income allocation over the life-cycle, which has less distortive effect on the labour market. The latter feature is particularly important in the light of population ageing, when changing the age structure of the population will create an additional fiscal pressure on pension systems.
However, a shift towards NDC, or generally, a DC scheme, regardless of the financing mechanism, also means that the distribution of future pension to a large extent mimics the distribution of wages, as there is no income redistribution in the pension formula. As a result, those with lower wages and shorter working careers can expect pension that represents lower fraction of their earnings compared with most of the DB systems.
The elderly in Europe and worldwide are facing higher risks of poverty compared with the working-age population, but there is a large variation between countries (see for example OECD, 2009 and Zaidi, Reference Zaidi2010). In most of the OECD countries, there is also a significant gender gap in incomes of people above the age of 65 years (OECD, 2009). Although Poland belongs to the group of countries that still manages to protect its old-age population from poverty risk, this is likely to change in the future, as more people covered by the new pension system retire. Stronger link between contributions and benefits leads to potential reduction of income replacement for pensioners with lower earnings and shorter working careers, which will have implications for the level of incomes of future pensioners.
In that light, the need for a design of the mechanism in the pension system that can offer protection against poverty in the old-age becomes an important component of the overall pension-scheme design. Chłoń et al. (Reference Chłoń, Góra, Lubyova and Thomson2001) point out that there is an inherent conflict between the objective of reducing distortions caused by the pension system on the labour market and the goal of providing adequate income. This conflict forces each country to develop its own structural compromise, which reflects its own unique social history, economic situation and political preferences.
Social safety nets for old-age population and pensioners are organized in different ways – mainly through basic, resource-tested and minimum pension. The level of safety nets in the OECD countries ranges from some 15% to almost 40% of economy-wide average earnings, with the average of 27%. In Poland, this protection is slightly below the OECD average (OECD, 2009). However, the level of old-age poverty protection changes, depending on the rules applied to the modification of the existing income guarantees. Here the key question is whether the benchmark for assessing purchasing power risk should be the cost of living (that increases in line with prices) or standard of living (that increase can be approximated by wage growth). Before 1980s a full wage-growth indexation was a standard measure. In 1980s and 1990s, majority of OECD countries moved to a price indexation or a mixed price and wage indexation of pension in order to cut costs (Queisser and Whitehouse, Reference Queisser and Whitehouse2005). The indexation of minimum pension benefits on the other hand is still considered as a way of poverty reduction. Many countries maintain the constant ratio of a minimum pension to an average wage (replacement rate) in order to guarantee the minimum standard of living (Whitehouse, Reference Whitehouse2009). Such a policy affects often in the compression of retirement incomes and lead to the expansion of the coverage of the minimum pension.
Poland, on its way to reform the mandatory pension system from DB to DC based, also changed the design and role of its minimum pension guarantee (MPG). Yet, the level of an MPG and the rules for its uprating did not change. As a result, the relative value of the minimum pension to the economy-wide average wage is likely to fall below the OECD average. This means that with time, the population at risk of falling below the minimum pension level will decrease, not because of an adequate level of incomes, but mainly due to the decrease of the guarantee. In the paper, we aim to estimate the impact of individual characteristics (such as the length of working career and the wage history) as well as the minimum pension level on the probability of receiving the minimum pension. Contrary to most of the literature in this subject (OECD, 2009; Zaidi, Reference Zaidi2010; DG Employment and SPC, 2012), we take into account both wage and work duration and, based on the current wage and work experience profiles of pensioners, we estimate the share of population that could fall below the MPG threshold. We also apply various scenarios of the development of the MPG. As there are significant gender differences, our analysis is done separately for men and women so we can identify the impact of gender on future levels of income of Polish pensioners.
In section 2, we present the current design of the MPG in Poland. And, we present changes in the level of the minimum pension and changes in the recipiency rate over the past decade. We also compare the evolution of the minimum pension level with the average wage as well as the poverty threshold in Poland. In section 3, we present projections of the future level of minimum pension, depending on the development of the wage level. In this section, we also present results of microsimulations of future pension levels, with particular focus on the impact of wage level and work history as well as pension system's performance on the future pension level. We analyse, based on microsimulations, the potential risk of falling below the minimum pension level over time. Finally, we provide some conclusions and policy recommendations for labour market and pension policy, in particular related to the design of the MPG.
2 The minimum pension in Poland – current design, level and recipiency rate
In this section, we present the design of the MPG in the mandatory pension system for employees and self-employedFootnote 2. We also present the historical development of the value of minimum pension and number of pensioners receiving minimum pension in the past few years. These reflect mainly the result of guarantees in the old pension system, as all pensions granted until the end of 2008 were based on the old systems' rules.
The role of pension systems can be divided into income allocation over the life course as well as poverty protection at old age. While the general design of the pension system is focused on the former, the minimum pension or other forms of guarantees serve the latter.
The necessity of providing a minimum income is also confirmed by international standards. International Labour Organisation (ILO) in its conventions, including most importantly Conventions 102 and 128Footnote 3. The Conventions give a wide freedom of choice concerning through what mechanism (or combination of mechanisms) old-age pensions should be delivered: earnings related or a flat rate, contributory or non-contributory, means tested or not – what is important is the outcome in terms of benefit levels.
Countries deal with this problem through one of the five different approaches or some combination of them. These include: (i) citizens’ pensions; (ii) contributory, flat pensions; (iii) progressive benefit formulae; (iv) minimum pensions; and (v) income-tested supplements. The issue of providing adequate income protection for the old-age plays an important role in the international debate. Answers to that challenge depend highly on countries’ characteristics. This ranges from the issue of assuring the adequate coverage of pension systems, particularly in the developing countries, to the goal related to the adequacy of pension levels, which has been formulated in the pension strand of the social open method of co-ordination in the European Union.
According to the above-mentioned conventions, the minimum pension is paid at a flat rate, the amount should not be lower than 40% (45% in the case of disability pension) of prevailing levels of earnings of unskilled manual workers. This also applies to pension provided as means-tested benefits, but the level of such pension should also meet another criterion: they ‘shall be sufficient to maintain the family of the beneficiary in health and decency’. Amounts of all kinds of pension awarded originally to the beneficiaries should be reviewed regularly and adjusted accordingly following any ‘substantial changes’ in the general level of earnings or cost of living.
If the basic income security is to be provided mainly by the earnings-related pension, the minimum replacement rate should be guaranteed at least for those with earnings lower than prevailing, typical or average levels. The Convention 102 requires that the minimum replacement rate in old-age earnings-related pension of lower income beneficiaries to be at least 40% of pervious earning after 30 years of contributions.
2.1 Design of the MPG in the mandatory pension system in Poland
The reform of the pension system in Poland, introduced in 1999, changed the rules of financing and functioning of the mandatory pension system, including the design and financing of the minimum pension. The old system was a traditional, pay-as-you-go, DB scheme, with a income redistribution function in the pension formula. The new system is a DC scheme, which means that the future pension levels will be linked only to lifetime contributions, with earned interest. The financing of the new pension system also changed. The old-age contribution (19.52% of wage) was split into two accounts: a non-financial and a financial one.
The NDC account is held in the Social Insurance Institution (ZUS). Initially, the contribution of 12.22% of wage is recorded on the individual account in the NDC scheme and earns an interest rate equal to the change in the overall contribution revenue, which represents the changes in the covered wage bill growth. The second one, FDC account, is held in an open pension fund (OFE) that invests in assets on the financial market. Until 2011 each month, a contribution of 7.3% of wage is transferred to the chosen pension fund. The FDC account earns a rate of return that is linked to the financial market performance.
The Polish pension system is in the process of continuous changes. From May 2011 there was a major change of the design and financing of the pension system. The FDC pillar was downsized – initially to 2.3% of wage and gradually going up to 3.5% of wage by 2017. The remaining part of the former FDC contribution (5% of wage, decreased gradually to 3.8% in 2017) is credited to a new quasi-non-financial account, which earns an interest rate based on quarterly GDP growth.Footnote 4 Thus, those that are fully covered by the new system have currently three separate pension accounts. The change has not modified the DC principle of the Polish pension system.
The resulting old-age pension is calculated based on the value of capital accumulated in all accounts and unisex life expectancy at the retirement age. Thus, there is no progressivity or redistribution in the pension formula, apart from the one resulting from differences in life expectancy of men and women. The minimum retirement age is different for men and women. Until 2013, women could retire at age 60 and men at age 65Footnote 5. This means that the individual replacement rate for persons retiring at the same age, whose individual pension relative to average pension was relatively stable, is constant. For example, those who earn 50% of average wage and those who earn 200% of average wage can expect to receive the same proportion of their earnings at retirement. As a result, the distribution of the pension level should follow the distribution of earnings, and potential differences will be due to different wage levels, length of work and differences in retirement age. It should be noted that different retirement age of men and women can lead to a significant disproportion of men's and women's pension. Women, retiring five years earlier will have not only lower retirement age but also a shorter working career.Footnote 6 Combining that with the lower wage level, due to a gender wage gap, the risk of low pension benefits will be higher for women in the future, until retirement ages are equalized.
The new pension system covers workers and self-employedFootnote 7 born in 1949 or later. In this group, those born between 1949 and 1968 had an option either to split their contribution between NDC and FDC account or have only NDC account. All pension rights accrued before the end of 1998 (prior to the reform implementation) were recalculated into the initial capital, and credited to the NDC account.
In the new pension system, the MPG is detached from contributory financing and moved to the state budget and general revenue financing. If the total pension (a sum of NDC and FDC pension) is below the minimum level, the pension is topped-up by the MPG, which is financed from the state budget. The guarantee subject to the eligibility criteria, which are achieving the minimum retirement age and a work experience of 20 years for women and 25 years for men (this requirement for women will increase with a rise of the retirement age).
As a result, the two objectives of the pension system: income allocation over the lifecycle and providing protection against poverty at old age are separated and also based on separate financing. The latter has a broader base, similar to other benefits targeted at income support of low-income citizens.
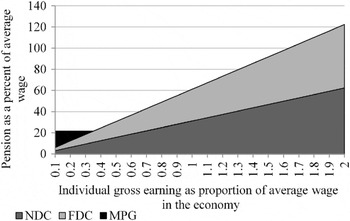
Thus, there are three potential sources of financing the old-age pension in the new system: MPG from the general revenue, NDC pension financed from the pay-as-you-go system revenues and FDC pension financed from assets accumulated in OFEs, which is illustrated in Figure 1.
Gross relative pension level by sources of financing in the new pension system. Source: Authors’ calculations based on OECD (2009). Note: The figure presents simulations before 2011 change.

As one can see, the projected pension level in the new pension system in Poland is proportional to the level of earnings, which is typical for DC systems. Following the split of contribution between NDC and FDC accounts, the future retirees in Poland can expect a little more than half of their pension from NDC part and almost half of their pension from FDC part. This is a different proportion than the contribution split, which is a result of assumed differences in the levels of rate of returns (the detailed description of the assumptions used in the simulations is presented in OECD (2009)).
In the old DB system, the MPG was built into the general pension system formula. The benefit formula was progressive with a constant component equal to 24% of the average wage. Each year of work increased the pension level by 1.3% of individual's wage component, which was calculated based on the best wage in 10 years chosen from past 20 years of wage history, adjusted for changes in inflation and average wage levels. As a result, the distribution of pension was more concentrated that wage distribution, which reduced the risk of falling below the minimum pension level.
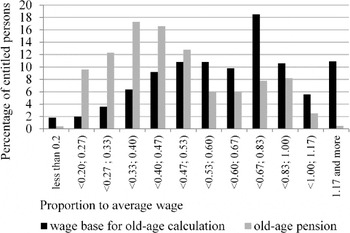
However, if an accrued pension was below the minimum level and the eligibility criteria were met, the pension was increased to the minimum level. Financing of the minimum pension was from the social security system's revenue (from contributions and state budget subsidies). Eligibility criteria for receiving the minimum old-age pension were similar to the ones in the new system. There are two general factors of individual's work history that have significant impact on the risk of minimum pension. These include the lifetime wages covered by the social security work tenure. Figure 2 presents the observed distribution of average wage levels of people retired in 2008 as well as the distribution of old-age pension levels in the same year. The distribution of wages is more dispersed compared with old-age pension. This is due to the re-distributional features of the old DB pension scheme. In the new system, as shown in Figure 1, the distribution of pension would follow the wage distribution, which would lead to higher risks of lower pension levels.
Distribution of wage base for pension calculation and old-age pension levels in 2008 (as a share of average wage). Source: Own calculations based on Social Insurance Institution and Central Statistical Office data.

We should also note that the distribution of wage base for pension calculation in the old system (as shown in Figure 2) takes into account wage developments from the past 20 years of work history. As one can see, the distribution of the pension level is concentrated around the average value of about 40–50% of average wage in the economy (PLN 1 471 per month), while the distribution of the wage level for pension calculation is more dispersed compared with the average of about 70% of average wage in the economy in 2008 (PLN 2 128). Labour market developments in the past few decades will have a significant impact on the total length of work covered by social security. According to the author's calculations using Labour Force Survey (LFS) data, around 30% of persons at retirement age can have total work experience below the minimum period required for the minimum pension. If we take into account Polish Structure of Earnings Survey (SES) data that cover persons who still work at the retirement age, this share reduces to some 10%. As a result, the risk of poverty among persons in the retirement age, not eligible for MPG increases.
2.2 Evolution of the minimum pension level
In the course of the past two decades, the minimum pension level evolved following ad hoc changes at the beginning of 1990s and followed by regular indexations of pension benefits from mid 1990s. In our analysis, we focus on the period from 1995, when the inflation level and indexation mechanisms stabilized after the transition volatility. Minimum pensionincreased at the same rate as all pensions. Currently, indexation is conducted annually, following the inflation rate increased by a fifth of the real wage growth. The indexation factor can be increased, if it is agreed in the Tripartite Committee. This indexation principle was implemented in Poland from 1999, with a break between 2005 and 2008. In these years, pensions were indexed according to the inflation growth. The current indexation mechanism leads to a gradual reduction of the relation between minimum pension and average wage. Given that the pension system is perceived as a source of income replacement after retirement, reduced relation between minimum pension and average wage means that with time it will be covering less workers as the wage level necessary to fall below the minimum pension threshold will be decreasing.
In order to assess the role of the MPG as a mechanism to protect against poverty, we compare it with the subsistence minimum calculated by the Institute for Labour and Social Affairs. The subsistence minimum (also called the biological minimum) is perceived as the lowest poverty threshold. This is understood as a level, below which there is a biological risk of adverse life and psycho-physical development of an individual (Deniszczuk and Sajkiewicz, Reference Deniszczuk, Sajkiewicz and Golinowska1997; Kurowski, Reference Kurowski2002). The basket for calculating the subsistence minimum was developed by the experts of the Institute of Labour and Social Affairs in 1995. It covers only expenditure that allows for maintaining the subsistence level, such as housing needs and food. The need for social activities is not included in this basket.
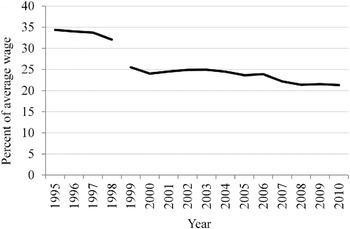
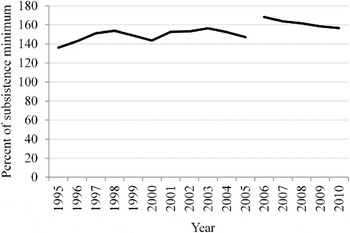
The evolution of the minimum pension relative to the average wage and the subsistence minimum for pensioners is presented in Figures 3 and 4, respectively. Due to differences in the tax wedge on wages and pensions – the former are subject to social security and health care contributions and personal income tax, while the latter are subject to health care contribution and income tax – we should focus on the direction of changes and not the absolute level of this indicator. The same applies to the comparison with subsistence minimum, which is calculated on the net level.
Minimum pension relative to average wage. Note: Discontinuity between 1998 and 1999 due to the one-time recalculation of gross wages due to the split of social insurance contribution between employee and employer. Source: Own calculations based on Social Insurance Institution and Central Statistical Office data.

Minimum pension relative to subsistence minimum*. Note: Discontinuity between 2005 and 2006 due to the change in the methodology of calculation of subsistence minimum. *Subsistence minimum calculated for a single pensioner's household. Source: Own calculations based on Social Insurance Institution and Institute for Labour and Social Affairs data.

As one can see, there is a visible reduction in relation between the minimum pension and the average wage, which decreased by more than 4 percentage points between 1999 and 2010. This indicates the risk of increase of relative poverty of old-age pensioners receiving minimum pension, given that the relative poverty threshold follows the median income influenced highly by wage developments. The relation between the minimum pension and the subsistence minimum also changed with time. Between 2003 and 2010 it reduced, indicating that the level of protection offered by the minimum pension is getting closer to the extreme poverty level. If the gross minimum pension falls below 120% of subsistence minimum, this would mean that the guarantee can only cover the survival needs of pensioners. Thus, the evolution of the minimum pension level should be observed whether it still serves its protection purpose.
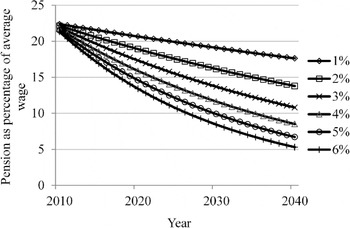
Further changes in the relation of the minimum pension to the average wage are determined by pension indexation mechanism. Given the 20% share of average wage growth, with time the relation of minimum pension to average wage will fall. The faster is the wage growth, the faster is the reduction of this relation. This is illustrated in Figure 5. Assuming the moderate real increase of the average wage of 3% annually, the minimum pension will fall below 15% of the average wage in 2027. If the real wage grows by 5% annually, this threshold will be achieved by 2020.
Simulation of future minimum pension as per cent of average wage depending on the average wage increase. Source: Authors’ calculations.

These simulations show that with time, under no policy change scenario, the minimum pension level may not guarantee appropriate income protection for the elderly and can lead to an increase of relative poverty rates among old-age pensioners.
2.3 Pensioners with minimum pension
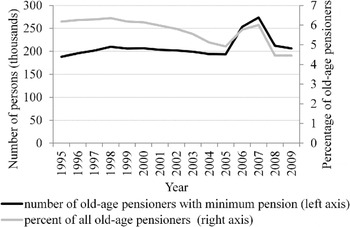
The level of minimum pension has also impact on the number of beneficiaries who receive the minimum pension (Figure 6). Between 1995 and 2009 the total number of pensioners receiving this benefit remained relatively stable (with the increase between 2005 and 2008 due to the transfer of disability pensioners above retirement age to the old-age scheme). At the same time, the total number of old-age pensioners increased, which means that the relative share of pensioners receiving old-age pensions fell. We can assume that with further relative decrease of minimum pension compared with average wage, there will be a further drop of share of old-age pensioners receiving minimum pension, as discussed in the previous section.
Minimum pension beneficiaries – number and per cent of all old-age pensioners. Source: Own calculations based on Social Insurance Institution data.

It is also important to take into account the gender distribution of minimum benefits. Between 2005 and 2009 some 84% of all old-age pensioners receiving minimum benefits were women. This was caused by several factors, which include: lower retirement age, shorter working careers as well as wage gap between men and women. As discussed earlier, such differences, already present in the case of the old pension system, can even deepen in the new pension system.
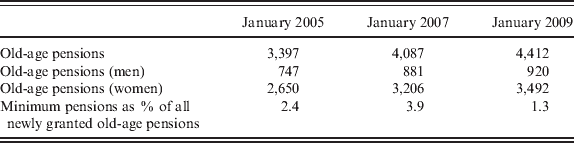
The number of pensioners receiving minimum pension changes due the differences between inflow of new pensioners and outflow, caused by increases of pensions due to increase of pensions (e.g. by adding new working periods after retirement) or, more frequently, due to natural causes. The inflow of new pensioners with a minimum level is shown in Table 1.
Newly granted minimum pension benefits in 2004, 2006 and 2008 (data for January of the next year)

Without pensions of those who have a right to farmers' benefit and without pensions paid based on international agreements.
Source: Social Insurance Institution.
In recent years, the annual inflow of new old-age pension was at around 4,000 benefits per year, which represented less than 5% of all new old-age pensions granted. The inflow of new pensioners with minimum pension is below the average share of those receiving minimum old-age pensions in all pension payments. This indicates that in the future the share of pensioners receiving minimum pension should further decrease. Of all new minimum old-age pensions granted in the analysed years, around 80% were granted to women, as expected given the differences in labour market histories and pensionable ages of men and women.
2.4 Poverty among pensioners
Changes in the number and share of minimum pension recipients can be confronted with the evolution of poverty among pensioners. There are two thresholds that we use to monitor poverty: subsistence minimum as well as the relative poverty threshold, which is taken at the level of 50% of average equalized expenditure of households (the national relative poverty line in Poland).
As discussed in previous sections, pension indexation mechanism, including changes in the minimum pension level leads to the reduction of the relation between the minimum pension and the average wage, while the relation to the subsistence minimum is expected to be more stable.
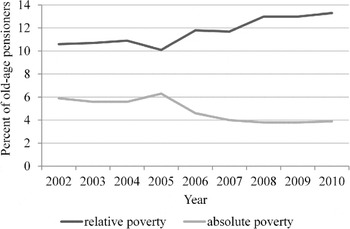
The widening gap between absolute and relative poverty is a result of the method used to calculate poverty thresholds (Figure 7). While the relative poverty takes into account changes in average expenditure of households, which increases with wage growth, the absolute poverty is based on the value of a basket of the most necessary goods and services. As a result, the risk of absolute poverty is decreasing (though part of the decrease is due to change in the methodology of threshold calculation), while the risk of relative poverty is increasing, as wage increases and other changes in income of Polish households lead to real increases of the average expenditure.
Relative and absolute poverty of old-age pensioners in Poland. Source: Central Statistical Office, Households' Budget Survey.

In the future, if minimum pensions are increased following the current mechanism, we can expect a further widening of this gap. This phenomenon can have further social consequences. Namely, an increase of the relative poverty of pensioners leads to increased inter-generational differences in income levels and a dissatisfaction of older generations. It may lead to a rising pressure to increase the incomes of pensioners, in particular the lowest ones.
3 Coverage of the minimum pension in the future
In the new pension system, future pension benefits depend on a pension capital collected during the whole working life from contributions, levels of indexation in the NDC public pillars and returns from capital in the privately managed FDC pillar. The aim of the simulation exercise is to determine which combinations of tenure and wages can generate a pension capital that would be too small to assure a pension higher than the minimum pension defined according to the two proposed rules of indexation 20% (current one) and 100% of the wage growth (hypothetical maximum indexation). Simulations cover pensions of people who started their labour market careers in the year 2010.
In the first part of the section, we present long-term macroeconomic assumptions and microeconomic assumptions of the simulation. We also define what is the no policy change scenario in the simulation. In the second part of the section, we explain of the method of simulation presented using the baseline scenario. The third part presents the sensitivity analysis based on different policy scenarios that allow assessing reliability of the results and the influence of policy changes on the coverage of pensioners by the MPG.
3.1 Assumptions of the simulation
The simulation aims to determine which combinations of tenure and wage levels result in insufficient retirement savings under different assumptions concerning other parameters that have an impact on the overall pension level or the minimum wage level. The long-term simulation is based on the long-term macroeconomic assumptions prepared by the Working Group on Ageing (European Commission, 2009) in 2009 (including the Eurostat population projection published in 2008). The choice of this approach is justified by the comparability of our results with long-term assessment of public finance in Poland. In addition, this set of assumptions takes into account structural changes in the future economy that are supposed to result, among others, from the population ageing. The macroeconomic assumptions based on the production function approach that takes into account the influence of the ageing process on labour supply and as a consequence on GDP growth. According to these assumptions in the next 50 years, the average annual real GDP growth will amount to 1.6% y-o-y, the annual real wage growth (equal to labour productivity growth in the production function) will amount to about 2.4%, and the average annual wage fund growth in the economy amount to about 1.5% and the real interest rate in the whole period amount to 3.0%. It should be also mentioned that according to the EUROSTAT projection consistent with the macro assumptions (EUROSTAT, 2008) the long-term trends in the life expectancy (unisex life tables) would lead in the next 50 years to the increase in the life expectancy of persons aged 60 years by 6.4 years and persons aged 65 years by 6.2 years. This change has crucial influence on the ratio of future pension to wages in the DC system.
The baseline scenario included in the simulation assumes no changes of current policy, after the change introduced in 2011 (retirement age of 60 years for man and 65 years for women). It means that in the long term there will be three accounts with contribution divided in following proportions: 12.2%, 3.8% and 3.5%. Other scenarios are presented in the sensitivity tests. We also present the results of calculations after the recently introduced increase of retirement age to 67 years for both men and women.
In the simulation, we assume that there will be no significant change in the intensity of labour market participation of workers. Our baseline assumption is based on the data on retirement ages and work experience of individuals retiring between 2004 and 2008. The change in the work experience that we assume is only linked to the increase in the retirement ages, due to the elimination of early retirement as well as increase in legal retirement age. We do not take into account the potential increases in labour force participation related to the incentives that are created by a shift from DB to the DC system. Although such incentives are obviously created, it is difficult to assess their magnitude. First, we still do not have observations on changes in labour market participation of workers that could be attributed to the pension system change. Second, research shows that Polish citizens still have strong preferences for earlier retirement and do not react to the incentives in the new pension system (see for example Liwiński et al. (Reference Liwiński, Giza-Poleszczuk, Góra and Sztanderska2008)). We should also note that individuals retiring at the beginning of the century still had significant parts of their working careers during the pre-transition time, characterized by official high employment levels. Finally, as presented simulations aim to estimate the potential scale of recipiency of minimum pension, presented approach allows for prudent assessment of the analysed risk.
3.2 Simulation method and baseline results
The simulation is made for stylized work histories. It is assumed that people can only work between 15 years of age and official retirement age (p_age). The simulated pension is calculated for the official retirement age before the year 2013 (in the baseline: 60 years for women and 65 years for men), so the maximum work tenure (t_max) for women in the simulation is 45 years and for men is 50 years. We assume a flat wage profile during the whole working life to keep the simplicity of the interpretation, but wages increase with time reflecting the real wage growth in the economy.
All calculations were made in real terms to assure the comparability of purchasing power of wages in the whole period of simulation. Regarding the tenure, the total assumed tenure is divided into equal parts between all years until retirement age. It means, for example, that man who worked 40 years before retirement out of 50 maximum possible in the simulation is assumed to work 4/5 of each of 50 years.
The formula used in the simulation of new pension that is a sum of benefits from three accounts (NDC 1, NDC 2 and FDC) is presented below:
 $$p\lpar t\comma wage\comma p\_age\comma e_{p\_age} \comma r_{{\rm account}} \rpar \equals {\mathop{\sum}\limits_{{\rm account} \equals \setnum{1}}^{\setnum{3}} {{{\sum\nolimits_{i \equals \setnum{15}}^{p\_age} {\left( {{t \over {t\_\max }}wage_{i} } \right)\lpar 1 \plus r_{account} \rpar ^{p\_age \minus i}} } \over {e_{p\_age} }}} $$
In the simulation, the only difference between accounts is the assumption regarding the return to assets on these accounts (raccount): the wage fund growth (wf) in the NDC 1 part, the rate of indexation of the accounts in NDC part of the system (g) in the NDC 2 part and the interest rate (r) in the financial part (FDC) of the system. In order to assess the consequences of ‘no policy change’ scenario and the full wage indexation calculations were made in two variants: the current rule of minimum pension indexation (index=20%) and the constant relation of the minimum pension to the average wage in the economy (index=100%). In the simulation, future pensions were calculated for combinations of annual wages (wage) and tenure (t) required to outline the scope of pension below minimum calculated on the basis of the current value of minimum pension and rules of indexation mentioned above. The value of the first pension received in the pension age (p_age) is calculated by dividing the fund collected during the lifecycle by unisex life expectancy at pension age (ep age), which is different for men and women.
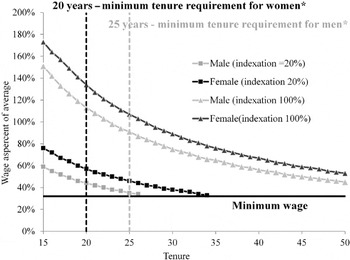
Under the assumption of ‘no policy change’ the real value of the minimum pension level will be indexed only to 20% of the real wage-growth combinations of tenure and wages insufficient to obtain pension higher than the minimum are relatively limited (Figure 8 – combinations of tenure and wages below the curves). This result shows that if the current mechanism of minimum pension increases will be kept in the next 50 years almost all persons who fulfil the requirements concerning a minimum tenure will have pensions higher than the minimum pension. As a result, the minimum pension will no longer be a viable social policy instrument. This result is an effect of increasing difference between the level of the minimum pension and the average wage in the economy (see Figures 3 and 5). If we assume that the minimum pension will increase to maintain the relation between the minimum pension and the average wage on the constant level (i.e., 100% wage indexation), then the minimum pension will remain as a tool of income protection for men and women with relatively low wages.
Comparison of the influence of the combinations of tenure and wages that lead to minimum pension (the fields below the lines) under current rule of pension indexation (20% of wage growth) and 100% wage indexation. Source: Own calculations.

Women with the lowest wages (earning between the minimum wage and 50% of average wage in the economy) can expect pension below the minimum level even without changes in the current rule of the minimum pension increases. If the minimum pension would be constant relative to wages the risk of falling below the minimum pension level increases to a larger set of combinations of wage and tenure.
The aim of our analysis in this part is to determine the percentage of population under the risk of the minimum pension in the two scenarios: under the scenario of the current rule of pension indexation and under the scenario of the 100% wage indexation. In order to achieve that goal we used the data about currently observed combinations of wage and tenure of new pensionersFootnote 8. Our analysis was based on the data for pensioners retiring in 2008 at age of 55–59 years (women) and 60–64 years (men) that is the dominant age group in the population of new pensioners. We limited our analysis to these age cohorts in order to exclude the persons who were entitled to non-standard retirement conditions.
The figures below combine the information about the distribution of the tenure and wages of pensioners in 2008 (presented in section 2.2) with the results of simulations concerning the combinations of tenures and wages that would lead to a minimum pension right in the future (Figure 8). It is important to mention that such a method of analysis produces the projection of the future minimum pension coverage under the assumption that the work ‘biographies’ of persons in the new system were similar to those observed recently. Results of the simulation should not be taken as a forecast as the assumptions mentioned above are unlikely – for example, because of the changing labour market situation. Figures are designed to reflect the distribution of the currently observed combinations of tenure and wage.
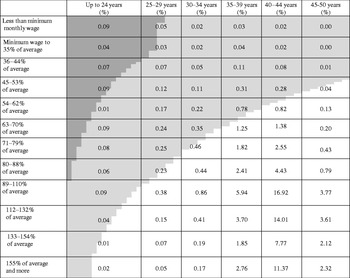
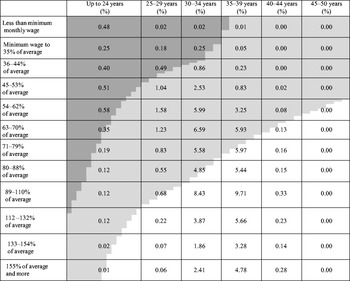
Results show that under the current rule of indexation the minimum pension would have a marginal role in the future (Figures 9 and 10 dark grey colour). It would cover about 0.5% of men with extremely short tenure (the exemptions from the basic rules usually due to their occupation) and lowest wages and about 3.4% of women with short tenure and relatively low wages.
Risk of pension under minimum for men aged 65 years on the basis of the data concerning wage and tenure distribution of new retirees in 2008. Current wage indexation scenario (dark grey) and 100% wage indexation scenario (light grey). *Calculations under the assumption that minimum tenure cannot be lower than 15 years. Source: Own calculations.

Risk of pension under minimum for women aged 60 years on the basis of the data concerning wage and tenure distribution of new retirees in 2008. Current wage indexation scenario (dark grey) and 100% wage indexation scenario (light grey). *Calculations under the assumption that minimum tenure cannot be lower than 15 years. Source: Own calculations.

Results of the scenario with the full wage indexation of the minimum pension (Figures 9 and 10 – light grey colour) assume that the ratio of minimum pension to average wage remains constant. In such a scenario 4.4% of men with relatively the lowest wages would be covered by minimum pension. Relatively short tenure significantly increases the risk of minimum pension, but due to the requirements concerning minimum tenure and pension age of men the share of men with short tenure is relatively low. Results for women are significantly different. Under the full wage indexation, 45.3% of women would be covered by the minimum pension. Such a large percentage is a result of the relatively lower pension age, shorter average tenures and wages and high frequencies of both relatively low wages and short tenure.
Figures 9 and 10 suggest that differences in the risk of minimum pension between men and women are caused not only by the lower retirement age reflected by the results of simulation but have more to do with in general shorter tenures and lower wages of women. It is also important that results show positive relation between average wages and tenure (diagonal accumulation of the cells with higher percentages). There is a significant differentiation of work experience according to wage levels, which means that those with lower wages also tend to have shorter total work experience, which concerns particularly women. The positive relation between the observed wage and tenure may reflect many reasons. Usually a wage level depends positively on a work experience. The higher labour force participation and wages can be also connected with a higher level of human capital or can result from labour market segmentation. Simultaneous lower wages and work experience can be also a result of discrimination of certain groups. The more visible correlation of tenure and wages between men and women can be also a result of the differences in family roles of men and women.
3.3 Sensitivity tests and policy analysis
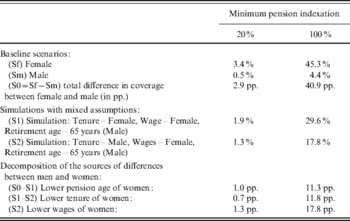
Results of the baseline simulation indicate that despite using unisex life tables one could expect significant differences between the minimum pension coverage of men and women. In the simulation, there are three parameters that reflect differences between men and women: differences in pension age, differences in tenures and differences in wages. The contribution of each of these factors to the total difference can be assessed by the simulations with changes of the single parameter with all others unchanged (Table 2). The decomposition made on the basis of these simulations shows that one of the sources of differences in coverage by the minimum pension benefit is the difference in pension age between women and men. It explains 1.0 percentage point from a total of 2.9% of coverage difference under the indexation rule of 20% of real wage growth and 11.3 percentage points out of the total difference of 40.9% under the indexation rule of 100% of real wage growth. It suggests that the equalization of pension ages should significantly increase pension benefits of women even without changes in their labour force participation (i.e., without increasing average tenure or wages). However, the remaining policy issue in such a situation would be the increase of poverty in pre-retirement age.
Results of simulation – the sources of higher coverage of new minimum pension among women

Source: own calculations.
Increase in the labour force participation and employment rate of women to the ones of men would result in the reduction of the gap in the coverage by minimum pension by 0.7 pp. under the indexation rule of 20% and by 11.8 pp. under the indexation rule of 100%. The remaining difference can be attributed to the influence of the differences in average lifetime wages of women and men and explains 1.3 pp. and 17.8 pp. of the gap and it seems to be the main source of differences in the minimum pension coverage.
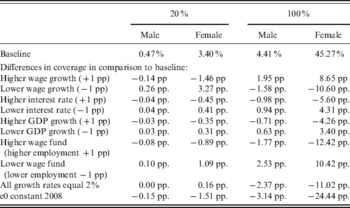
The main conclusion of baseline results is that the role of the minimum pension under current benefit indexation rule is relatively minor for both sexes and in the case of men also under the indexation rule of 100%. We can expect a high coverage of retired women under indexation rule the 100% without any other policy changes. The macroeconomic assumptions influence the results (Table 3), but do not change main conclusions.
Sensitivity tests of results using different assumptions

Source: own calculations.
The assumption about wage growth has the biggest impact on the obtained results. The higher the wage growth, the wider is the coverage of minimum pension among women under the assumption of full wage indexation. This parameter influences both the sum of contributions collected during the whole career and the minimum pension threshold. An increase by 1 pp. (to 3.4%) leads to a growth higher than returns from all pension accounts (g=1.6%, wf=2.5%, r=3%) and it means a significant increase of the minimum pension coverage in the full wage indexation scenario, but also to a decrease of coverage under current indexation scenario as the faster wage increase contributes more to accumulation of pension savings than to increase of minimum pension threshold. The decrease of an annual wage growth by 1pp. (1.4%) leads to a growth lower than returns from two pension accounts (g=1.6%, r=3%). The indexation of remaining account directly depends on a wage growth and decreases to wf=0.5%. As a result, the coverage sharply decreases in the full wage indexation scenario, but there is an increase in coverage in current indexation scenario due to mechanisms explained above. Changes in an interest rate influence the amount of capital accumulated in FDC pillar. Higher rate of return decreases the coverage of minimum pension in all scenarios. The higher/lower GDP growth (exogenous to other variables) means higher/lower returns to NDC accounts created in 2011 and as a consequence lower/higher coverage of minimum pension in all scenarios. On the other hand, increase in wage fund growth because of an employment growth that is assumed as neutral to other macro variables influence only funds accumulated in the first NDC pillar and proportionally decreases the coverage of first pension by the minimum pension supplement. The AWG assumptions based on the extrapolation of past trends and the differences in growth of different macro variables can be seen as far from steady state. The simulation that assumes r=g=wf=2% shows that even under the assumption that the real rate of GDP growth is equal to the real interest rate and the real wage fund growth, the main conclusions of the simulation holds.
An increase in longevity is one of the most important factors explaining the decrease of the value of future pension in relation to the average wage. According to the Eurostat (2008) projection the life expectancy at pension age is going to increase by more than 6 years. Without the changes in life expectancy the risk of very low benefits in the DC pension system would be less severe in the scenario with full wage indexation.
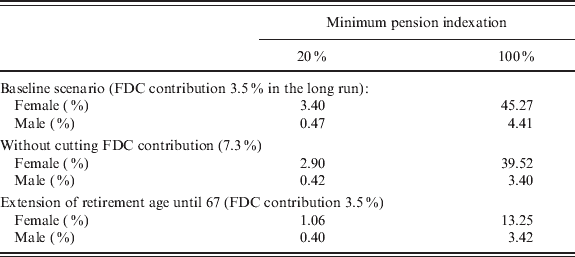
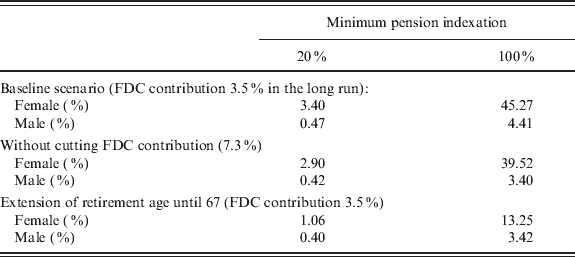
The Polish pension system is still under the process of changes. One of them, namely the introduction of additional NDC account and reduction of FDC contribution was implemented in 2011, another (increase of retirement age for men and women to 67 years by the year 2040 was announced at the end of 2011 and comes into force from 2013. Table 4 presents how those changes influence the percentages of pensioners covered by minimum benefits in our simulations.
The comparison of the projections of the minimum pension coverage – future effects of recently introduced policies
Source: own calculations.
In the simulation, it is assumed that the rate of return on financial instruments will be higher than GDP growth and wage fund growth. Under such assumptions lower contribution to FDC account and higher to NDC accounts means lower returns on the total pension capital. This explains the increase in the coverage of minimum pension after the reform introduced in 2011 (shift of the part of the inflow of contributions from the FDC pillar to NDC pillar).
The simulation of the increase of the retirement age based on the assumption that the differences between men and women in terms of wages remain but the same pension age of 67 years after reform should lead to the same tenure distribution of men and women in the pension age equal to those observed recently for men. This scenario seems to be conservative as it assumes no influence of the extension of pension age on tenure for men and limited influence for the higher tenure of women. The results show that equalization of the retirement age of men and women could solve to large extent the problem of very low pension benefits to woman. The increase of retirement age to 67 years both for women and men under the full wage indexation of minimum pension can decrease the percentage of future women pensioners covered by minimum pension from nearly 45% to about 13%.
4 Summary and conclusions
The aim of our analysis was to investigate current and potential future influence of the pension system parameters on the role of the minimum pension provision in Poland as well as the assessment of coverage of minimum pension for future retirees. The new pension system based on the DC mechanism reduces almost entirely the income redistribution within the pension system. That means that the MPG is the principal mechanism of income protection of old-age pensioners in the future.
Currently the minimum pension in Poland is at a level of some 22% of average wage and 52% of the minimum wage. This relation has been decreasing, following relatively fast development of the average wage on the one hand and the pension indexation that included only up to a fifth of the real wage growth on the other hand. Assuming further productivity and wage growth in Poland, we can expect that a no policy change in the minimum pension indexation will lead to a further decrease of the share of the minimum pension in the average wage and the minimum wage. According to the ILO requirements defined in Convention 102 ratified by Poland and not ratified Convention 128 a minimum pension benefit should not be lower than 40% of a minimum wage (Hagemejer Reference Hagemejer, Holzmann, Robalino and Takayama2009). Under the assumption that the ratio between the minimum wage and the average wage in Poland will be stable in the future, the current indexation of the minimum pension will lead to erosion of the minimum pension threshold below ILO requirements by mid 2020 when it will amount to about 15% of the average wage.
The level of the minimum pension relative to wages has an impact on the actual scope of this guarantee. We can already observe that in the past decade the number of minimum pension beneficiaries in Poland has been falling, which can be partially explained by changes in the minimum pension level and partially by a general growth of wages leading to higher levels of new pension granted. Evolution of the minimum pension level influences also the risk of poverty among pensioners. In particular, the risk of relative poverty increases, as the poverty thresholds is related to median-equalised income changes, which take into account, among others, the development of wage levels.
Results of presented simulations show that maintaining the current rules of pension indexation will greatly reduce the number of potential combinations of wage and tenure at retirement age that can lead to the minimum pension.
Introduction of longevity changes to the simulations show that under current rule of the indexation of minimum pension, the coverage of minimum pension beneficiaries in the future will be marginal. This scenario means that the minimum pension will not serve the purpose of relative poverty protection. Maintaining the current relation of the minimum pension to the average wage can provide adequate protection, which can apply to a high percentage of elderly women.
This leads to the conclusion that the current MPG in Poland does not provide a stable guarantee of (relative) poverty protection for the old-age, in particular for persons with low wages and low work experience in the future, particularly for women.
The change of the rule of minimum pension indexation to the full wage indexation without changing other parameters of the pension system can on the other hand lead to the huge increase of the coverage of the minimum pension especially among women and as a result could increase budget expenditures.
According to the results of simulations, the increase of retirement age or required tenure of men and women can be a necessary condition for the reforms to keep the adequacy of the pension without boosting public expenditures which can make them unsustainable. Another solution that can help decrease the share of future pensioners covered by minimum pension is the policy aimed at increasing employment and especially the reconciliation of work and family life by women. The results of simulations show that a higher employment rate decreases the share of pensioners with incomes lower than the minimum pension threshold. Some other simulations (Kotowska et al., Reference Kotowska, Stachura and Strzelecki2008) show that differences in employment rates of women and men due to the different models of labour market and family life reconciliation are important determinants of possible low pension of women in DC system.
In the light of the analysis and simulations presented in the paper, several policy recommendations can be formulated. First, the future adequacy of pensioners’ income highly depends on the labour market participation and wage levels. There are significant differences between men and women – the latter tend to have both lower wages and shorter work careers. These factors combined lead to significantly lower pension of women and higher risks of falling below the level of pension guarantee. Thus, countries with their pension systems based on DC principle or more generally those that have strong links between contributions and benefits should implement labour market policies that support longer working lives and higher wages, particularly for women.
The historical data and results of simulations for Poland show that the role and design of the minimum income guarantees for the old-age pensioners has long-term implications. Thus, such mechanisms should not be assessed only from the perspective of current pensioners, but also future ones. Under the economic and fiscal crisis, many countries apply rules of indexation of minimum benefits, which were designed to reduce current government expenditures. Such policies may not be sustainable in the long run. Policies should aim to find a balance between the need to prevent poverty of older persons and stability of public finances in the future. In the case of Poland, MPG should not be subject to simple price-index indexation just as pension in payment, but its level should also take into account the existing poverty thresholds – both absolute and relative, in order to maintain the desired level of social cohesion, particularly in the inter-generational context.