The survey practitioner’s toolkit has changed significantly over the last decade. Although the decline in response rates and the growth in the number of households with no landline phone have made it increasingly difficult to obtain representative samples via telephone surveys, many survey researchers have turned to internet surveys. Internet-based studies are accompanied by several concerns, however. The limitations of opt-in internet samples for characterizing population-level parameters are well documented (e.g., Malhotra and Krosnick Reference Malhotra and Krosnick2007; American Association for Public Opinion Research (AAPOR) 2010) and even probability-based internet sampling faces challenges in ensuring that groups that lack online access are adequately represented (Yeager et al. Reference Yeager, Krosnick, Chang and Javitz2011). Mixed-mode surveys, which use multiple data collection methods in sample recruitment and survey administration, are a potential solution to this problem, especially if particular modes are used to reach populations that are more difficult to target.
However, mode may systematically affect the ways participants respond to survey instruments. Variation in levels of cognitive engagement or the use of satisficing strategies, perhaps induced by the presence or absence of an interviewer or the differences between verbal and visual description of response options, could generate mode effects if these patterns are correlated with the mode of survey administration. Failing to account for such differences, then, could lead to inaccurate comparisons of subjects across different modes.
In this paper, we build upon and extend research by Chang and Krosnick (Chang and Krosnick Reference Chang and Krosnick2009; Chang and Krosnick Reference Chang and Krosnick2010) to investigate mode effects in survey responses, paying special attention to the conditions under which mode effects are more or less consequential. We use the 2011 Youth Participatory Politics (YPP) survey, a study administered in the United States to a nationally representative sample of 2920 young adults either online or over the phone, and investigate the presence of differences across in response patterns and data quality, and examine the substantive consequences of these differences for studying self-reports of political attitudes.
Our results provide consistent evidence of mode effects. First, we find that the internet sample exhibited starkly higher rates of item non-response and use of “no opinion” response options, and lower levels of differentiation in their use of scales. Although these findings appear to run counter to Chang and Krosnick (Reference Chang and Krosnick2010), further investigation reveals that both the magnitude and direction of the mode effects vary across question type; that is, whereas some sorts of questions appear to lead to greater satisficing among online respondents, other types are associated with greater satisficing among telephone respondents. Moreover, the differences across mode are robust to accounting for the process by which respondents selected the mode of survey administration. We then illustrate the substantive consequences of mode as they apply to self-reported racial attitudes and political knowledge. The results of our study highlight important trade-offs in survey data collected over the phone versus on the internet, and have important implications for the design and analysis of multi-mode surveys.
Inferential Issues in Survey Research
Generalizing from survey research to broader populations of interest often presents a number of challenges. The “total survey error” framework (for a recent review, see Groves and Lyberg Reference Groves and Lyberg2010) elaborates the conditions under which survey results accurately characterize population-level parameters for constructs of interest. These error components stem from two sources (Groves et al. 2004): measurement (owing to the validity of the instrument, the precision with which the core concept is measured, and how accurately responses are processed) and representation (owing to non-response bias and how well the sampling frame represents the target population). These potential sources of error threaten the accuracy of the survey statistic with respect to the population of interest.
Concerns about the representativeness of samples obtained via random digit dialing (e.g., Brehm 1993; Curtin, Presser and Singer 2000; Holbrook, Green and Krosnick Reference Holbrook, Green and Krosnick2003; Berinsky Reference Berinsky2004; Groves 2006; Keeter et al. Reference Keeter, Kennedy, Dimock, Best and Craighill2006; Blumberg and Luke Reference Blumberg and Luke2007; Keeter et al. Reference Keeter, Kennedy, Clark, Tompson and Mokrzycki2007) have led many researchers to turn to internet-based surveys, though evidence is mixed about whether online surveys adequately remedy these concerns about representativeness.Footnote 1 Though the use of opt-in internet panels generates serious concerns about survey sampling and representativeness (see AAPOR 2010), they are not the only potential sources of error in internet surveys, nor are they the only possible explanation for differences that arise between surveys administered over the internet or, for instance, over the phone. For instance, Malhotra and Krosnick (Reference Malhotra and Krosnick2007) compare the 2000 and 2004 American National Election Studies administered over the phone with responses obtained from internet-based samples, and find significant differences between the samples. However, they cannot identify whether differences between various administrations of the same survey are due to differences in sampling or the form in which the surveys were administered. Likewise, mixed-mode studies that allow respondents to select the mode by which they complete the survey are unable to distinguish mode effects from selection effects. Although the former refers to the differential measurement error present in the mode of administration, the latter is the result of the distinctive characteristics of the groups of respondents that choose to take the survey in a certain mode.
Mode Effects in Survey Research
Survey mode may affect survey responses in several important ways. First, mode may affect respondents’ level of engagement with the survey, and better-engaged respondents may provide more accurate responses. Verbal surveys likely induce higher levels of engagement because the interviewer’s voice can communicate enthusiasm and stimulate interest (Cannell, Miller and Oksenberg Reference Cannell, Miller and Oksenberg1981; Chartrand and Bargh 1999). Although internet surveys allow respondents to complete the survey on their own time and at their own pace, the lack of engagement with an interviewer and the inability to monitor the respondents’ attentiveness to the survey could decrease respondents’ interest in the survey, and thus the quality of the responses they provide.
Though verbal interviews may increase respondent engagement, satisficing theory (Krosnick Reference Krosnick1991; Holbrook, Green and Krosnick Reference Holbrook, Green and Krosnick2003) suggests that the cognitive burden associated with answering questions may be greater in verbal interviews, and thus decrease data quality (Tourangeau and Smith Reference Tourangeau and Smith1996). For instance, questions with five-point response scales (i.e., “strongly agree” to “strongly disagree”) require the respondent to listen to each of the five categories before responding, which could encourage greater satisficing and thereby decrease the quality of the answers. In contrast, interviews conducted over the internet display visually each of the five response options.Footnote 2
Variation in levels of engagement or uses of satisficing strategies across survey mode could produce several observable implications. First, survey mode could affect response patterns. Survey participants who are not well engaged may demonstrate higher levels of item non-response and skip those items in which they are less interested. If phone surveys induce higher levels of engagement, we would expect greater levels of item non-response among internet survey respondents. In addition, survey mode can affect the likelihood of a respondent choosing a no opinion response when the option is provided.Footnote 3 Holbrook, Green and Krosnick (Reference Holbrook, Green and Krosnick2003) attribute this to the lower level of satisficing present in the face-to-face interview situation. Thus, internet respondents may answer more survey questions with “don’t know” compared with phone respondents.Footnote 4
Furthermore, if predominantly visual surveys, such as internet questionnaires, and predominantly aural surveys, such as telephone interviews, induce different cognitive burdens on survey respondents, response quality could vary systematically across modes.Footnote 5 Satisficing could manifest in, for instance, an abnormally large number of “somewhat disagree” responses to questions that use five-point Likert scales, or an increased propensity to rate political figures as a “50” on items that use 101 point feeling thermometers.Footnote 6 Thus, levels of item differentiation may differ across modes.
Survey mode could also affect the substantive responses that are provided by survey participants, especially for questions that are cognitively more difficult or ask about attitudes or behaviors that could be influenced by social desirability.Footnote 7 Respondents have appeared to be more willing to admit to undesirable attitudes and behaviors in self-administered modes (e.g., Tourangeau and Yan Reference Tourangeau and Yan2007; Chang and Krosnick Reference Chang and Krosnick2009; Kreuter, Presser and Tourangeau Reference Kreuter, Presser and Tourangeau2009; Chang and Krosnick Reference Chang and Krosnick2010). Thus, internet respondents may feel fewer pressures from social desirability because they are not directly interacting with another individual, suggesting that we may find higher rates of what may be considered socially undesirable attitudes and behavior among internet respondents.
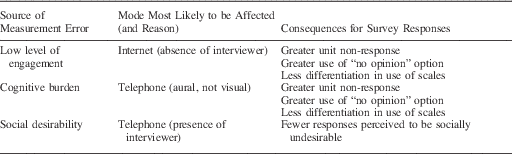
Our discussion above identifies a variety of ways in which survey mode may affect response patterns and response quality. Table 1 summarizes these expectations more formally. With respect to response patterns such as unit non-response, the use of “no opinion” options, and differentiation in the use of scales, we have competing expectations as to which mode, telephone or internet, will lead to the greatest measurement error. By contrast, we have a clear expectation that social desirability biases should be greatest among telephone respondents owing to the presence of a live interviewer.
Summary of Expectations

In addition, survey instruments themselves may condition the magnitude and direction of mode effects. Just as surveys administered across various modes may impose varying cognitive demands of varying strength, the instruments used to elicit survey responses also vary in the cognitive burdens they place on respondents. Moreover, the cognitive burdens of these instruments may vary across modes. For instance, standard “feeling thermometer” questions may be relatively easier for internet respondents, as these questions are typically accompanied by a visual representation of a thermometer or scale along which the respondent evaluates the attitude object. Lacking such a visual, these questions may induce greater cognitive demands for phone respondents, and thus lead to higher levels of satisficing. Thus, mode effects may be greater for this question type compared with survey instruments that present respondents with simple “yes” or “no” response options. Generally, the magnitude of mode effects may vary across different survey instruments, depending on the cognitive difficulties associated with the instrument and how these cognitive burdens differ across mode.
Data
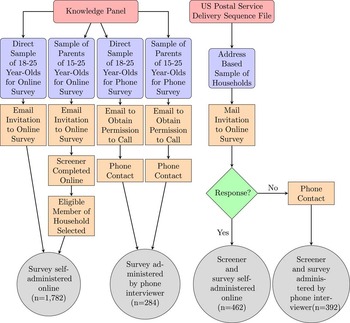
The 2011 YPP survey was administered by Knowledge Networks (KN) through online and telephone modes in both English- and Spanish-language versions from February 9 to July 14, 2011. The target population for the survey comprised young people between 15 and 25 years of age living in the United States from four ethnic/racial groups: non-Hispanic whites, non-Hispanic blacks, non-Hispanic Asians, and Hispanics of any race. Figure 1 describes the sampling procedures, where the sample of this population was drawn from two sources: KN’s probability-based internet panel and an address-based sample (ABS).Footnote 8 The KN panel was used to draw a direct sample of persons aged 18–25 from the four racial/ethnic groups, as well as to draw a sample of parents with offspring between the ages of 15 and 25. From the latter group, the parent was asked to identify the race and ethnicity of each person aged 15–25 in the household, and if any individuals belonged to the target population, one eligible household member was selected into the sample. In all, 993 completed surveys were obtained online from the KN direct panel and another 789 online surveys were administered to respondents recruited through the panel of parents. In all, 65 percent of individuals sampled from the KN panel to receive the internet survey completed the screener survey, and among those who qualified for the main survey, the completion rate was 95 percent. An additional 284 phone interviews were obtained from a separate sample drawn from the KN panels. In all, 50 percent of those sampled completed the screener, and of those who qualified for the main survey, the completion rate was 42 percent. The most salient characteristic of the samples drawn from the KN panels was that both the internet and telephone samples were drawn from the same underlying pool of potential respondents, though, as discussed in greater depth below, the different response rates for the two modes raises the possibility that the two samples could differ in ways that might affect their response patterns.
Overview of sampling procedures

The KN sample was supplemented by an ABS in order to over-sample minority groups. The sample frame was drawn from the US Postal Service’s Delivery Sequence File, which was combined with additional database sources to over-sample households believed to contain members of the targeted racial/ethnic and age groups. Targeted households were sent a letter inviting eligible household members to participate in the web survey. Households that did not respond to the initial invitation or follow-up were contacted by professional interviewers who attempted to administer the screener and main survey by telephone. Ultimately, 14 percent of selected households completed the screener and 47 percent of qualified individuals completed the main survey. In all, 462 individuals selected through the ABS sample completed the survey online and 392 took the survey over the phone. Unlike the KN samples, the distinguishing feature of the ABS sample was that respondents had the opportunity to select into their mode of administration.
Results
Table 2 displays the summary statistics for an analysis of three kinds of response patterns to the substantive questions asked in the survey: item non-response, “no opinion” responses, and scale differentiation. Consistent with our expectations, item non-response is greater among internet respondents. Across 124 unique closed-ended questions asked of all respondents, the average non-response rate among phone respondents is 0.8 percent, but is more than doubled (1.9 percent) for internet respondents. On average, phone respondents did not answer 1.0 question, whereas internet respondents left blank 2.3 questions.Footnote 9 Non-response rates are greater for online respondents in 108 of the 124 items, and are statistically significant for 86 of them.Footnote 10
Summary Indicators of Survey Response Patterns by Survey Mode

We find further evidence of mode effects when evaluating the frequency of “no opinion” responses. Ten questions in the survey provided respondents with a response option that allowed them to avoid providing an answer.Footnote 11 For all ten items, the proportion of online respondents choosing the no opinion option far exceeded the proportion of telephone respondents who gave that answer. As reported in the second row of Table 2, averaging across the ten questions, online respondents answered “don’t know” or “not sure,” 31 percent of the time compared with an average no opinion rate of 8 percent among phone respondents.Footnote 12 Thus, whereas differences in non-response across mode are substantively quite modest, the sizable differences across modes in the frequency of relatively uninformative responses could be consequential when comparing survey results across different modes.
As a final indicator of the varying patterns of survey responses across the two modes, we calculated the differentiation index (McCarty and Shrum Reference McCarty and Shrum2000) for each set of items in which the same response choices are presented in at least three consecutive questions. This index ranges from approximately 0 to 1, with values close to 0 indicating a tendency to use the same answer choice to all items within a battery and larger values indicating greater differentiation.Footnote 13 Altogether there were 11 such batteries of questions in the survey, comprising 80 individual questions.
Consistent with expectations, the phone mode elicited greater differentiation in rating scales than the online mode. As seen in the last row of Table 2, the average differentiation for the 11 batteries is significantly higher for phone respondents than for online respondents (p<0.001 for a two-sample t-test with equal variances). In addition, for nine of the 11 batteries tested, the differentiation index is significantly higher for the phone mode than for the online mode.Footnote 14 In substantive terms, phone respondents tended to make fuller use of the range of options provided them, whereas online respondents often gave the identical responses to all items within a battery. For example, in a commonly used battery measuring the “Big Five” personality traits, 6 percent of online respondents selected the midpoint (“neither agree nor disagree”) for all ten items, whereas not a single phone respondent displayed this pattern.
Our focus on item differentiation is closely related to other research across a variety of disciplines on scale usage heterogeneity (e.g., Aldrich and McKelvey 1977; Rossi, Gilula and Allenby 2001; King et al. 2003). In particular, different survey respondents with the same latent traits may report those traits in different ways when using ratings scales. For instance, some individuals may tend to use only the upper or lower ends of a rating scale; alternatively, some respondents may make use of a wide range of the scale, whereas others’ responses are more tightly clustered around some subset of the scale’s range. Following the Bayesian hierarchical approach recommended by Rossi, Gilula and Allenby (2001), we recovered estimates of the “spread” of each respondent’s use of the “Big Five” rating scales, where larger estimates indicate that survey respondents used a more expansive range of the scales. Consistent with the results above on item differentiation, we again find that telephone respondents exhibited much greater “spread” than online respondents (1.20 compared with 1.02; p<0.001).Footnote 15
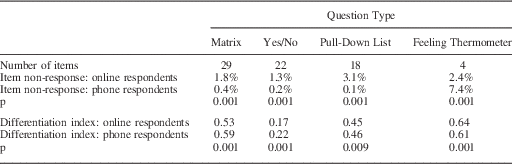
Although the findings reported in Table 2 indicate the presence of significant mode effects, they may conceal important differences in response patterns across various types of surveys question. If the increased rates of unit non-response and decreased differentiation in scales observed among internet respondents are the result of greater satisficing, then we would expect to find these patterns to be strongest for survey items that induce the greatest cognitive demands. We grouped items from the YPP survey into four general categories based on their online format: “matrix” items that presented internet respondents with a grid containing multiple questions in the rows and multiple answer choices in the columns, requiring the respondent to click a radio button to choose one answer for each question; “yes/no” questions that were similar in design to the “matrix” questions, with the exception that there were only two answer choices; “pull-down lists,” in which online respondents had to click their mouse on a button to display the list of answer choices before selecting the appropriate response; and “feeling thermometer” items, in which online respondents were presented with an instrument that allowed them either to click their mouse on the desired point on the thermometer or to type in the number, which would then be represented visually as a horizontal red bar immediately above the number.Footnote 16 Contrastingly, for all four types of questions, phone respondents had the answer choices read aloud to them by an interviewer. The first three types of questions might be expected to result in greater satisficing among online respondents, as the presentation of multiple questions on a single webpage might be cognitively challenging, compared with a telephone respondent, who was read each item individually. By contrast, the feeling thermometer ratings might place more cognitive demands on telephone respondents, who were asked to place themselves along the 101-point scales without any sort of visual assistance.
Table 3 reports the results of the average non-response and differentiation across modes for each of the four question types. The difference in the relative rates of item non-response across modes is greatest for those items that online respondents answered using a pull-down list. The average non-response rate for internet respondents for these questions was 3.1 percent, more than 20 times the rate for telephone respondents (0.13 percent). All but eight telephone respondents (99 percent) answered all 18 of these questions, and only three failed to answer more than one item. By contrast, 16 percent of online respondents did not answer at least one of these questions and 2 percent failed to answer nine or more. The general pattern of reduced non-response among telephone respondents also holds for the matrix items and yes/no questions. However, we observe the opposite pattern for the four feeling thermometer ratings. The average non-response rate for these items is three times higher among telephone respondents (7.4 percent) than it is for online respondents (2.4 percent).Footnote 17 A similar pattern of results across the four types of questions is obtained for the differentiation index. For the matrix items, pull-down lists, and yes/no questions, telephone respondents exhibit greater average differentiation in scales than do internet respondents. However, for the feeling thermometer ratings, online respondents tend to use a wider range of values. This is further indication that question type may condition both the direction and magnitude of mode effects. This finding is consistent with the hypothesis that a given survey item may be more cognitively demanding in one mode than another, which results in differential rates of satisficing behavior among respondents across modes.
Differences in Mode Effects by Question Type

Survey Mode and Self-Selection
An alternative explanation for the apparent mode effects that we observe is that the respondents opting to take the survey online differ systematically from those who were administered the survey over the phone. That is, the observed differences might reflect differences in the attributes of the samples administered the survey via the two modes, not differential measurement error between the online and telephone modes. In particular, because respondents recruited through the ABS sample were asked to take the survey online before being contacted by phone, it might be expected that individuals who have the greatest access to and comfort with personal computers would be most likely to select the online mode.
To assess this possibility, we can compare the distributions of variables relating to computer use and internet access across the two modes for the ABS sample. As the sample was stratified by race and age, and because different strata selected into the online mode at different rates, t-tests are conducted separately for each of three age categories for both African Americans and Asian Americans.Footnote 18 As a point of comparison, the t-tests are also performed for a group that did not have the opportunity to select into mode: whites recruited from the KN Direct Panel.Footnote 19
We find systematic differences within the ABS sample between online and phone respondents. Most notably, as expected, online respondents reported using personal computers much more frequently than did phone respondents. The differences in means between online and phone respondents are statistically significant for each race/age stratum from the ABS sample except 22–25-year-old Asians. Similarly, among 15–17-year-old African–Americans, a higher percentage of online respondents than phone respondents reported having access to the internet at home. This difference is not statistically significant for any other group, largely because there is little variation in this variable (more than 90 percent of all groups reported having internet access).Footnote 20 By contrast, the differences across survey modes for both of these variables are small and not statistically significant for white respondents from the KN Direct Panel. This last finding supports the conclusion that the differences in these variables observed between online and phone respondents in the ABS sample were the result of selection into mode, not of differential measurement error.Footnote 21
To further investigate the possibility that self-selection is responsible for the differences across modes, we estimate ordinary least squares (OLS) regressions with three dependent variables: the number of unit-missing responses, the average rate of no opinion responses, and the average differentiation index. The key independent variables assessing mode effects and selection effects are dummy variables indicating whether the survey was administered by phone and whether the respondent was recruited from the ABS sample, as well as an interaction term indicating an ABS phone respondent. In addition, dummy variables indicating the 12 race/age strata and whether the survey was administered in Spanish were also included in the equation as controls.
If mode effects are present, then we would expect to observe less non-response, fewer no opinion responses, and more differentiation in responses among phone respondents. If selection effects are present, then we would expect to see that the difference between ABS online respondents (indicated by the ABS dummy variable) and ABS phone respondents (indicated by the interaction term between sample source and survey mode) will be greater than the difference between KN online and phone respondents (indicated by the survey mode dummy variable). In addition, because the phone interviews were obtained from only those households that did not respond to the initial invitation to take the survey online, this group of respondents is likely to be more like non-responders than are the online respondents. The key assumption of this analysis is that, although the sampling procedures mean that the phone and online respondents from the ABS sample differ systematically in other ways besides the mode of survey administration, these differences should be minimized in the KN samples as the phone and online samples were drawn independently from the same pool of potential respondents. The key concern is that respondents’ latent interest in completing the survey is associated with the mode in which they completed it. However, supplementary analyses reveal that online respondents in the KN sample had considerably more experience completing surveys via their participation in the KN panel; thus, our finding that internet respondents engaged in higher rates of unit non-response and use of “don’t know” response options and lower levels of item differentiation cannot be explained by differences across modes in the average level of respondent interest or “quality.”Footnote 22
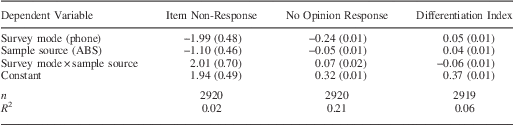
For all three dependent variables, as Table 4 shows, mode has a statistically significant relationship with response patterns.Footnote 23 Among respondents drawn from the KN panels, phone respondents skip fewer questions, are less likely to provide a “don’t know” or “not sure” answer, and score higher on the differentiation index. These findings are consistent with the hypothesis that online respondents engage in more satisficing and/or are less cognitively engaged than phone respondents.
OLS Regression Models of Response Patterns by Survey Mode and Sample Source

Note: Entries are linear regression coefficients with standard errors in parentheses. Dummy variables indicating race/age strata and survey language are also included in the estimated equations, but not shown here (see Table S-6 for full results).
OLS=ordinary least squares; ABS=address-based sample.
Selection into survey mode also affects response patterns and quality, as the ABS online respondents (the group that selected into the online mode) provided less item non-response, fewer no opinion responses, and greater differentiation than the KN online respondents. More importantly, the interaction term has a statistically significant effect in the opposite direction from the mode and sample source effects for all three dependent variables.Footnote 24 This indicates that the ABS phone respondents (the group that declined the opportunity to take the survey online) scored lower than other respondents on our measures of response patterns and quality after accounting for sample source and survey mode. Interestingly, the effect of survey mode far outweighs that of selection on the proportion of no opinion responses, but for both the item non-response and differentiation index measures, the magnitude of the estimated effect of the interaction term is very similar to that of the effect of survey mode. Thus, within the ABS sample, there are no real differences across mode in the amount of item non-response and differentiation in ratings scales because the effects of mode and self-selection cancel out one another. Although we detect the presence of both mode effects and selection effects, these effects would have been obscured for two of the three measures if we had only performed the tests on the sample that was allowed to select into survey mode.
The Substantive Consequences of Survey Mode
Thus far, our results provide some evidence of differential survey response patterns across mode. In this section, we demonstrate how survey mode affects the substantive responses elicited from the respondents for two different types of questions. First, we explore the effects of mode for questions about racial attitudes in which social desirability biases may influence response patterns. Second, we examine the presence of mode effects for fact-based questions in which respondents are asked to provide answers that are subsequently used to assess their knowledge in a given domain.
Racial Attitudes
Social desirability bias refers to conditions in which respondents feel pressure to answer survey questions in socially acceptable ways, and research on racial attitudes has found that social desirability may lead respondents to over-report levels of racial tolerance (e.g., Kuklinski, Cobb and Gilens Reference Kuklinski, Cobb and Gilens1997). In an experimental design that assigned survey respondents to mode, Krysan (Reference Krysan1998) finds that whites interviewed face to face tend to report more racially liberal attitudes than whites who completed a mail survey. Social desirability biases may play a smaller role for internet respondents because the anonymity of the online survey condition could reduce the pressure respondents feel to misrepresent behaviors or attitudes that are perceived as less socially desirable. We analyze response patterns to two short batteries of questions to examine this possibility. We examine responses from white respondents only, as it is less straightforward to identify the socially desirable response options among respondents of color. The first set of questions assesses views about racism, racial minority groups, and immigrants. In particular, we asked respondents to indicate the extent to which racism is an important problem in contemporary society,Footnote 25 whether the increase in population among people of color strengthens or weakens the country, and whether they believe that immigrants take jobs, housing, and health care away from native-born citizens. If the importance of social desirability bias varies across mode in the way we outlined above, we expect to see higher levels of racially liberal responses among phone respondents than among internet respondents.
The second set of questions addresses the racial composition of respondents’ interpersonal interactions. These questions asked respondents whether they interacted with “mostly whites,” “mostly blacks,” “mostly Hispanics/Latinos,” “mostly Asian,” or “mostly multiracial people” at work or school, in social settings, and in groups or organizations to which they belonged. The dependent variable in this analysis is an indicator for whether respondents reported interacting with “mostly whites” for each of the five questions, as we believe that the socially desirable response is for whites to indicate that they interact with people from a variety of races.Footnote 26
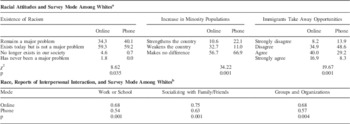
Across both sets of analyses, we find strong, consistent, and robust evidence that mode is associated with racial attitudes and self-reported behaviors. The top panel of Table 5 shows that phone respondents provided more racially liberal responses than did online respondents.Footnote 27 Online respondents reported that racism is less of a problem in contemporary society, were more likely to report that the increase in minority populations weakens the country, and were more likely to agree that immigrants take away jobs, health care, and housing from native-born citizens. For each question, the distributions of responses are statistically distinguishable by mode. Moreover, these differences hold up when examining them in a multivariate context. When regressing the survey responses on survey mode and a battery of demographic controls (education, age, gender, geographic region, and metro/non-metro residence), the coefficient for mode is statistically significant in each model.Footnote 28 Thus, we find that phone respondents provided the socially desirable response option at considerably higher rates than online respondents, even while controlling for other factors that might also influence racial attitudes.
Social Desirability and Survey Mode

Note: aWhite respondents only. Entries are the percentages of survey respondents who report a given response. The text of the question for the first set of results is: “Some people say that racism no longer exists in American society and politics. Would you say that...?” The second question is: “As you may know, Hispanics/Latinos, Blacks, Asians, and other minorities are expected to make up more than half the U.S. population by the middle of this century. Do you think this increase in minority populations...?” The text of the third question is: “Please indicate how much you agree or disagree with the following statement. Immigrants, especially immigrants from Latin America, Asia, and Africa, take jobs, housing, and healthcare away from people who were born in the United States.” Data are unweighted, but similar results are found when weights are applied.
b White respondents only. Entries are the percentages of survey respondents who reported interacting mainly with other whites at work or school, when socializing with friends and family, and when they are participating in groups and organizations of which they are a member. Data are unweighted, but substantively identical results are obtained when weights are applied.
Similar results emerge when examining questions that ask respondents to report the racial composition of their interpersonal interactions. The bottom panel of Table 5 shows the proportions of white respondents who reported that they interact mostly with other white people. Across all three contexts, phone respondents were at least ten percentage points less likely than online respondents to report interacting mostly with other white people. All of these differences are statistically significant. Furthermore, when regressing a dichotomous indicator for whether respondents reported interacting mostly with other whites on survey mode and demographic controls, the coefficient for survey mode is negative and statistically significant, indicating that phone respondents were considerably more likely than online respondents to report that their social interactions occurred with a more racially diverse set of individuals.Footnote 29
These analyses consistently indicate that interviews conducted over the telephone generate more racially liberal and socially desirable survey responses compared with the responses elicited via internet surveys. Although we are unable to directly test whether these patterns are a result of social desirability bias, they are exactly the patterns we would expect to find if social desirability pressures lead phone respondents to report artificially liberal racial attitudes and behaviors. That these modal differences are robust to accounting for other demographic characteristics that are also associated with racial attitudes suggests that analysts should take mode into consideration when comparing responses to questions that may be susceptible to social desirability.
Political Knowledge
The presence of a live survey interviewer might also introduce another sort of bias that results in mode effects even for fact-based questions. Specifically, phone respondents seeking to oblige an interviewer or to conceal their ignorance may eschew “don’t know” responses to questions that test knowledge of political facts and offer an answer choice even when they do not actually know the answer (Luskin Reference Luskin2011). The consequence of this measurement error is that the level of political knowledge of phone respondents may be overestimated relative to that of online respondents. We evaluate these patterns using a standard battery of five political knowledge questions that are commonly asked in survey research.Footnote 30
As shown in Table 6, we find that phone respondents provided correct responses to a larger number (3.03) of these questions compared with internet respondents (2.85). This difference is especially interesting because the effects of self-selection that we outlined above would suggest that internet respondents (particularly from the ABS sample) would demonstrate higher levels of political knowledge. Moreover, the internet sample is more highly educated (44 percent attended or graduated from college) than the phone sample (36 percent attended or graduated from college). However, the difference in political knowledge observed across modes can be attributed to differential response patterns. Summing the number of “don’t know” answers and non-responses for the five political knowledge items, we see that phone respondents were much more likely to provide an answer: on average, online respondents did not attempt to answer 1.43 questions, compared with a mean of 0.51 for phone respondents. Moreover, the mean number of incorrect responses among phone respondents (1.46) is twice that of online respondents (0.73).Footnote 31
Responses to Political Knowledge Questions by Survey Mode

We also estimated multinomial logistic regressions of responses on mode and demographic controls.Footnote 32 We again find that phone respondents are less inclined than internet respondents to give a non-answer (“don’t know” or unit-missing) for all five questions. Further, among respondents who answered the questions, online respondents were usually much more likely to supply the correct answer, which suggests that phone respondents were more likely to guess if they did not know the answer to the question, thus, inflating estimates of their political knowledge.Footnote 33
To assess how this differential propensity to guess affects the estimation of levels of political knowledge across survey mode, we conduct a Monte Carlo simulation of the distribution of correct answers had all respondents given substantive responses to all five knowledge questions. Specifically, following the recommendation of Mondak (Reference Mondak1999), we randomly assign all “don’t know” and missing responses to one of the three substantive answer choices provided for each question. We then sum the number of correct responses and calculate the means for online respondents and for telephone respondents. We repeat this procedure 10,000 times to obtain our estimates of political knowledge by survey mode. As shown in the last row of Table 6, once this correction is made, online respondents display higher levels of political knowledge than do phone respondents (a mean of 3.32 “correct” answers calculated across the 10,000 simulations compared with 3.20).Footnote 34 In all 10,000 simulations, online respondents were estimated to provide more correct answers than phone respondents, and the “average” p-value associated with the difference in means across the 10,000 simulations is 0.049.
Discussion and Conclusion
Internet surveys offer a number of important advantages over more traditional telephone surveys. The relative ease of reaching large numbers of respondents enables researchers to quickly and efficiently compile sizable data sets. They are likely to be especially valuable in researching populations, like the youth surveyed in the YPP study, for which representative samples are increasingly difficult to obtain by telephone. As survey research moves increasingly onto the internet, though, it is important to understand how this change affects the quality of the data that is collected and the inferences they generate. These changes have important implications not just for mixed-mode surveys such as ours but also for any internet surveys that seek to compare their results to those of earlier studies administered via an interviewer.
In particular, the mode of administration appears to have substantial consequences for general response patterns and data quality. Online respondents are more likely than phone respondents to skip survey items and choose the “don’t know” or “no opinion” response option. Online respondents also exhibit less differentiation in their use of rating scales, again suggesting that internet surveys may engender less active cognitive involvement. The latter finding appears to stand in contrast to Chang and Krosnick (Reference Chang and Krosnick2010), who find that computer respondents display greater differentiation than respondents who were administered their survey aurally over an intercom. However, it should be noted that their study measured differentiation with respect to eight feeling thermometer ratings; similarly, when we compared response patterns across different types of survey questions, a battery of feeling thermometer ratings stood out as an exception in which online respondents exhibited greater differentiation and less unit non-response than phone respondents. For these questions, it is likely that the task of providing a rating along a 101-point scale without visual assistance meant that a phone respondent faced a much more cognitively demanding challenge than did an online respondent, who saw a visual representation of the thermometer that changed as she moved her mouse. This is entirely consistent with the interpretation that greater satisficing will lead to less differentiation, and it seems that which survey mode tends to induce more satisficing will depend critically on the format of the question. Generally, future research could more fully examine how question format influences the relative level of satisficing, whether non-response is associated with particular kinds of questions or particular question wordings, and whether instruments can be devised to reduce respondents’ tendencies to use the “no opinion” response option.
Our results show that both the selection process and the mode itself are responsible for differences in response patterns. Our findings echo previous work that warns against making population-level inferences using opt-in internet panels (AAPOR 2010). In particular, among respondents who were allowed to select into their survey mode, we find that online respondents appear to be systematically different from telephone respondents in characteristics associated with access to and facility with personal computers and the internet. The differences in response patterns between online and phone respondents, controlling for the effects of selection, indicate that even when comparing or combining the results from probability-based internet samples, such as the KN panels analyzed here, with those from phone samples, analysts should be attentive to the differing levels of measurement error across mode.
Our substantive findings regarding mode effects and inferences about racial attitudes and political knowledge highlight the need to take mode effects seriously. Although internet surveys may reduce the effects of social desirability biases for questions on sensitive topics such as racial attitudes, online respondents’ greater propensity to answer “don’t know” may artificially depress evaluations of their political knowledge relative to that of phone respondents. Future research could further explore how various question wordings may help alleviate modal differences in how social desirability is encoded in the responses provided by internet and phone responses.
The findings presented in this paper do not refute the validity of either internet or telephone survey research. Rather, they indicate that telephone responses tend to perform better on some criteria (e.g., less item non-response), whereas internet responses seem superior on others (e.g., alleviating social desirability biases). Mixed-mode surveys may indeed be the best solution to negotiating the trade-offs associated with each mode, and we have highlighted some of the considerations researchers will want to engage when comparing responses with the same survey instrument collected across different modes. Some issues can be addressed in the survey design stage. Specifically, thinking carefully about the format of question responses, the ways in which questions are presented to respondents, and the process by which samples are recruited can all help to improve comparability between responses elicited across different modes. Even still, our evidence suggests that survey mode is likely to have considerable effects on patterns of response. Consequently, analysts of mixed-mode surveys should account for mode effects, especially if their variables of interest are confounded by selection into mode. This is only possible if the sampling and survey administration procedures provide some leverage to distinguish mode effects from selection effects, as in the YPP survey analyzed here.
Finally, additional research is needed to investigate whether the mode effects observed here are generalizable to other populations. Given the characteristics of the sample used in this study, the differences we uncovered may understate the potential magnitude of mode effects when surveying a sample from the general population. To the extent that the young people in our sample grew up in the Internet Age, we suspect that they will tend to be more comfortable in taking surveys online than are older generations. Thus, we suspect that the magnitude of any differences would be even larger when examining mode effects across a wider range of age groups. On the other hand, it is also possible that young people’s facility with quickly accessing internet content (and, perhaps lower levels of experience with telephone surveys) could have manifested in larger mode differences than would be observed in the general population. Examining how patterns of media usage condition the effects of survey mode is an important question for future research. As internet surveys become increasingly common, it is essential for survey researchers to know whether generational differences in survey responses are owing to genuine shifts in attitudes or are the artificial product of differential measurement error between groups with varying levels of comfort with online surveys.
Supplementary Material
To view supplementary material for this article, please visit http://dx.doi.org/10.1017/psrm.2015.28