I. INTRODUCTION
In recent years, multijunction III–V solar cells have attracted increasing attention due to their very high conversion efficiency, and they generate many potential applications as a truly clean source of energy. The efficiencies can reach higher than 40% by triple-junction solar cell approaches. Reference King, Law, Edmondson, Fetzer, Kinsey, Yoon, Sherif and Karam1–Reference Luque4 The multilayered metamorphic or lattice mismatched epitaxial semiconductor system is usually used in a multijunction solar cell design. The key for the improvement of the material quality of the multilayered semiconductor thin film is the strain relaxation during the thin film growth process. In the strained multilayered heterostructure, threading dislocations or other defects generated by the strain relaxation can influence on the quality of the thin film. The compositional step graded buffer layers, as a very frequently used relaxation technology, can decrease the density of threading dislocations caused by the strain relaxation. The buffer structure introduces graded interfaces for the edge dislocations lying in the interface plane with the Burger's vector in the x–y direction Reference Dunstan5 ; therefore, it provides a high quality layer with a new lattice constant for the rest of the subcells to be grown on. In addition, buffer thickness has some relationships with the surface morphology and its root-mean-square (RMS) roughness. The buffer thickness has been proved to be an important factor of high quality thin films in many experimental works. Reference Zhang, Zhao, Wang, Wang, Chen, Liu and Yang6–Reference Luo, Wang, Guo, Xiao, Wang, Ran, Li and Li8 Wang et al.'s Reference Wang, Zhao, Li, Gong, Yang and Liang7 SEM and optical measurement shows that a best surface morphology and lowest RMS roughness is achieved with a 20-nm buffer layer. Luo et al.'s Reference Luo, Wang, Guo, Xiao, Wang, Ran, Li and Li8 work shows that there is a significant decrease of RMS roughness during the initial stage of increasing buffer layer thickness. On the other hand, the surface morphology of the buffer layer has strong influence on the thin film quality. Nakamura Reference Nakamura9 shows that the optimum thickness of the buffer layer is around 20 nm, thicker or thinner buffer layer can reduce the quality of the epitaxial thin film. Gonzalez et al. Reference Gonzalez, García, García, Briones, Martínez-Pastor and Ballesteros10 demonstrate that the surface morphology of the buffer layer affects the surface of the thin film and the photovoltaic properties. Piquette et al. Reference Piquette, Bridger, Beach and McGill11 observed that the surface morphology of the thin film is strongly dependent on the conditions of buffer layer deposition. In the crystal growth process, a buffer layer structure design has two main advantages: (i) avoid the high misfit strain between the top thin film and the substrate and (ii) decrease the defect density induced by the misfit strain, including both edge/screw dislocations and point defects. However, to fundamentally understand the physical mechanism in the buffer layers, the strain distribution in the step graded multilayers and its influence on the surface roughness are required. Thus, the optimized thickness for buffer layers can be predicted based on theoretical studies, but only few studies are done on the mesoscopic simulations.
In thermodynamics and kinetics theory, the stress-driven surface of a thin film grown on a substrate shows instabilities, which have been analyzed by Asaro and Tiller, Reference Asaro and Tiller12 and Grinfeld Reference Grinfeld13 (ATG). The formation of surface undulations led to an increase in surface energy but reduced the elastic energy in the stressed thin film. The ATG theory, as a linear theory, is able to predict the critical wave length Reference Srolovitz14,Reference Gao15 for surface undulations or critical island size Reference Tersoff and LeGoues16 for the nanodot structure. The critical wave length/island size plays an important role in the surface morphology evolution of a thin film. Recently, further theoretical development of the critical wave length/island size was developed by Krishnamurthy and Srolovitz, Reference Krishnamurthy and Srolovitz17 and Liu and Lu Reference Lu and Liu18,Reference Liu19 The ATG theory also can be investigated for the case of solid/solid interfaces (e.g., thin film/buffer layer interface) and the island formation process during the thin film growth. Reference Wang, Zhang and Liu20,Reference Hu, Gao and Liu21 However, it does not provide information on the surface morphology evolution, strain distribution evolution, and the detailed interactions between them.
Phase-field models have been proved to be a powerful tool to simulate self-assembled quantum dots and thin film structures. Reference Wang, Jin and Khachaturyan22–Reference Takaki, Hirouchi and Tomita25 In the previous studies, the phase-field method is proposed to investigate the stress-induced surface instabilities, the surface morphologies, the elastic strain/stress distributions, and the spontaneous formation mechanisms during the heteroepitaxial growth process. In this work, we used the phase-field method to simulate a multilayered heterostructure of a 1-eV junction as a bottom junction in the solar cell system. The 1-eV junction is theoretically predicted to be an optimal option for increasing the triple-junction solar cell efficiency. Reference Kurtz, Myers and Olson26,Reference Friedman, Geisz, Norman, Wanlass and Kurtz27 We chose In0.3Ga0.7As thin film grown on the GaAs substrate to be the 1-eV junction, Reference Geisz, Kurtz, Wanlass, Ward, Duda, Friedman, Olson, McMahon, Moriarty, Kiehl, Romero, Norman and Jone28 with a relatively large lattice misfit strain of ∼2%. Reference Sze29,Reference Pillai, Kim, Ho and Barnett30 Such a large misfit strain will induce nonideal growth due to the alloy layer relaxation by introduction of high dislocation density or the formation of three-dimensional islands. Reference Matthews and Blakeslee31,Reference Millunchick and Barnett32 To relax the misfit strain in In0.3Ga0.7As thin film on the GaAs substrate, an In0.15Ga0.85As buffer layer is introduced as a buffer layer. Therefore, our current work focuses on the investigation of the top surface roughness with multilayered heterostructures. The main purpose of this current paper is to explore the interplay between the buffer layers and the surface morphology through the strain distribution and revealing the effect of the thickness on the surface morphologies and roughness. In particular, the optimum buffer thickness based on our current phase-field model for the best surface quality is discussed. The strain distribution and the RMS roughness of the thin film surface are studied by addition of a buffer layer with its thickness ranged from 1 to 12 nm. The simulation results help us better understand the intrinsic mechanism of the strain relaxation by the multilayered thin film structures and improve the thin film quality with optimized buffer layer thickness.
II. SIMULATION METHOD
In this letter, we present a phase-field model taking into account the effect of the buffer layer between the thin film and the substrate. Figure 1 illustrates a schematic model of the system: to grow an In0.3Ga0.7As thin film on the GaAs (001) substrate, a buffer layer of In0.15Ga0.85As is introduced into the thin film/substrate interface. In this model, we used four conserved order parameters η1, η2, η3, and η4 to describe the volume fractions of the gas phase, In0.3Ga0.7As thin film, (001) GaAs substrate, and the In0.15Ga0.85As buffer layer. The total volume fraction of the system is fixed, i.e., η1 + η2 + η3 + η4 = 1.
The schematic of a thin film deposited on the substrate with a buffer layer structure.

For a conserved system, the temporal evolution of the surface morphology of the In0.3Ga0.7As thin film is governed by nonlinear Cahn–Hilliard equations. As we assume the substrate phase (η3) is static for simplicity, both the order parameters of the thin film (η2) and the buffer layer (η4) are chosen as independent phase field; thus the kinetic equations are:
 $${{\partial {{\rm{\eta }}_{\rm{2}}}} \over {\partial t}} = \nabla \left[ {M\nabla \left( {{{{\rm{\delta }}{F_{{\rm{tot}}}}} \over {{\rm{\delta }}{{\rm{\eta }}_{\rm{2}}}}}} \right)} \right]\quad ,$$
 $${{\partial {{\rm{\eta }}_{\rm{4}}}} \over {\partial t}} = \nabla \left[ {M\nabla \left( {{{{\rm{\delta }}{F_{{\rm{tot}}}}} \over {{\rm{\delta }}{{\rm{\eta }}_{\rm{4}}}}}} \right)} \right]\quad ,$$
where M is the phase-field mobility, t is the time, F tot is the total free energy of the multiphase system, including bulk chemical energy (F chem), surface/interface energy (F inter), and elastic energy (F elas). In our current model, we assume that mobility is a constant and neglect the difference between the bulk and surface diffusivities. The C–H equation describes the dynamics controlled by bulk diffusion. For simplicity, the value of mobility M is assumed to be the same for the thin film and the buffer layer.
The total free energy can be expressed by
 $${F_{{\rm{tot}}}} = {F_{{\rm{chem}}}} + {F_{{\rm{inter}}}} + {F_{{\rm{elas}}}}\quad .$$
The Landau-type coarse-grained bulk chemical free energy is
 $${F_{{\rm{chem}}}} = \int { - \left[ {\mathop\sum\limits_{i \ne j} {{{\rm{\omega }}_{ij}}{\rm{\eta }}_i^2{\rm{\eta }}_j^2} } \right]} {\rm{d}}V\quad i,\,j = 1,\,2,\,3,\,4\quad ,$$
where ω ij is the height of the double well potential, V is the total volume of the system.
The interface between order parameters η i and η j is denoted as γ ij . For a four-order-parameter system, there are six possible interfaces: γ12, γ13, γ14, γ23, γ24, and γ34. The interfacial energy between the order parameters in the system can be written as
 $${F_{{\rm{inter}}}} = \int { - \mathop\sum\limits_{i \ne j} {{\rm{\alpha }}_{ij}^2\nabla {{\rm{\eta }}_i} \cdot \nabla {{\rm{\eta }}_j}{\rm{d}}V} \quad i,\,j = 1,\,2,\,3,\,4\quad ,}$$
where α ij is the gradient energy coefficient. The elastic energy of the thin film at a given strain state is calculated by using Khachaturyan's Reference Khachaturyan33 microelastic theory:
 $${F_{{\rm{elas}}}} = {1 \over 2}\int \!\!{\left[ {{C_{ijkl}}\left( {{{\rm{\varepsilon }}_{ij}} - {\rm{\varepsilon }}_{ij}^0} \right)\left( {{{\rm{\varepsilon }}_{kl}} - {\rm{\varepsilon }}_{kl}^0} \right)} \right]} {\rm{d}}V\quad ,$$
where C
ijkl
is the second order elastic tensor, the ε
ij
is the total strain in the microelastic theory, and
 ${\rm{\varepsilon }}_{ij}^0$
is the eigenstrain of the material,
 $${\rm{\varepsilon }}_{ij}^0 = \mathop\sum\limits_{p = 1}^3 {{{\rm{\eta }}_p}\left( {\bar r} \right)} {\rm{\varepsilon }}_{ij}^{0,{{\rm{\eta }}_p}}\quad ,$$
where
 $\bar r$
is the coordinate. The final total free energy is calculated as the sum of the elastic energy, chemical energy, and the interface energy by Eq. (3). Equations (1) and (2) can be simultaneously solved by the semiimplicit Fourier-spectral method.
Reference Chen and Shen34
III. RESULTS AND DISCUSSION
In the simulations, by considering a one-dimensional stationary equilibrium problem of the phase-field parameter, the gradient energy coefficients and the chemical energy parameters can be determined as
 $${{\rm{\alpha }}_{ij}} = \sqrt {{{6{\rm{\delta }}{{\rm{\beta }}_{ij}}} \over b}} \,\,{\rm{and}}\,\,{{\rm{\omega }}_{ij}} = {{6{{\rm{\beta }}_{ij}}b} \over {\rm{\delta }}}\quad ,$$
where δ is the interface thickness, β ij is the surface or interface energy between phases i and j, and b is a constant. The interface thickness is chosen to be 5Δx, the surface energies for the InGaAs/GaAs system are β12 = β13 = β14 = 0.5 N/m, and the interfacial energies are β23 = β24 = β34 = 0.26 N/m. Reference Kurilo and Guba35,Reference Anan, Nishi and Sugou36 b is chosen to be 2.2, for simplicity, we chose β as the average of β ij , i.e., β = 0.38 N/m; thus the calculated height of the double well potential ω ij = 1.0 × 10⁹ N/m2, and the gradient energy coefficient is α ij = 7.2 × 10⁻⁵ N1/2. The elastic coefficients given in Ref. Reference Chuang37 are used here: for GaAs substrate: C 11 = 11.879 × 10¹¹ N/m2, C 12 = 5.376 × 10¹¹ N/m2, and C 44 = 5.94 × 10¹¹ N/m2; for In0.15Ga0.85As buffer layer: C 11 = 11.345 × 10¹¹ N/m2, C 12 = 5.2485 × 10¹¹ N/m2, and C 44 = 5.6415 × 10¹¹ N/m2; for In0.3Ga0.7As thin film: C 11 = 10.811 × 10¹¹ N/m2, C 12 = 5.121 × 10¹¹ N/m2, and C 44 = 5.343 × 10¹¹ N/m2. The pseudocubic lattice parameters for GaAs, In0.15Ga0.85As, and In0.3Ga0.7As at room temperature are set to be 5.6419, 5.70436, and 5.76682, respectively. Reference Chuang37,Reference Mariager, Lauridsen, Dohn, Bovet, Sørensen, Schleputz, Willmott and Feidenhans'l38 The mobility M is chosen to be 1.0 × 10⁻²⁷ m5/(J s). 256Δx 1 × 64Δx 2 discrete grid points are employed in this work with periodic boundary conditions applied along x 1 axes, where Δx 1 = Δx 2 = 1.0 nm. All the calculations are taken by 5000 time steps with a time step for integration of Δt = 0.1. The initial surface morphology is described by the thin film thickness h(x), which is assumed to be a simple, static sinusoidal plane wave
 $$h(x) = {h_0} + {\rm{\beta sin(}}kx + \varphi {\rm{)}}\quad {\rm{,}}$$
where h 0 is the initial average thin film thickness, β is the amplitude, k is the wave number, and φ is the initial phase.
To describe the surface roughness of a solid thin film, the most common statistic used is the RMS roughness, which is defined as Reference Pelliccione and Lu39
 $${\rm{RMS}} = \sqrt {\left\langle {{{\left[ {h(x) - \bar h} \right]}^2}} \right\rangle } \quad ,$$
where <…> represents the average value of …, and
 $\bar h$
is the mean height of the thin film surface. In the phase-field model, we suggest the distance between the point where η1 = η2 = 0.5 and η4 = η3 = 0.5 as the height of the surface.
As our current simulations did not include any defect mechanism, the thickness of the thin film and buffer layer must be below the critical thickness. According to the well known work of Matthews and Blakeslee's (M&B's) theory, Reference Matthews and Blakeslee40 the critical thickness of the In x Ga1−x As expitaxial thin film can be written as Reference Bertolet, Hsu, Agahi and Lau41
 $${h_{\rm{c}}} = {4 \over {{\rm{\pi }}{{\rm{\varepsilon }}_{{\rm{mf}}}}}}{{(1 - {\rm{\nu }}/4)} \over {(1 + {\rm{\nu }})}}\left( {\ln {{{h_{\rm{c}}}} \over {\rm{4}}} + 1} \right)\quad .$$
where h c is the critical thickness, ν is the poission ratio, εmf is the misfit strain between the thin film and substrate which can be defined as
 $${{\rm{\varepsilon }}_{{\rm{mf}}}} = {\rm{(}}{a_{\rm{f}}} - {a_{\rm{s}}}{\rm{)/}}{a_{\rm{s}}}\quad ,$$
where a f and a s are the lattice parameters of the thin film and the substrate, respectively. For the GaAs/InGaAs system, ν is chosen to be 0.312. Reference Krieger, Sigg, Herres, Bachem and Kohler42,Reference Hoke, Kennedy and Torabi43 For an In0.15Ga0.85As thin film as the buffer layer grown on the GaAs substrate, the misfit strain between the buffer layer and the substrate εmf = 0.011, the critical thickness by M&B's theoretical prediction is around 470 Å. For an In0.3Ga0.7As thin film grown on the buffer layer, as we assumed that the In0.3Ga0.7As thin film is under fully commensurate constraint and the buffer layer is coherently trained to have the same lattice constant as the substrate, the misfit strain between the thin film and the buffer layer is calculated by εmf =(a f − a b)/a b = (a f − a s)/a s = 0.022, where a b is the lattice parameter for the buffer layer In0.15Ga0.85As, which implies the critical thickness of the top thin film is around 200 Å. Thus, the system with a total thickness under 670 Å (i.e., 67 nm) can be assumed to be defect free. The critical thickness measured in experimental works is somehow smaller than theoretical predictions. The experimental results in Refs. Reference Orders and Usher44–Reference Zhang, Briot, Gil and Aulombard46 show that the critical thickness of the In0.15Ga0.85As monolayer thin film will not exceed 15 nm. In our simulations, we used 12 nm maximum for the In0.15Ga0.85As buffer layer and an average thickness of 10 nm for the In0.3Ga0.7As thin film, then the total thickness of the heterostructure is far below the critical thickness.
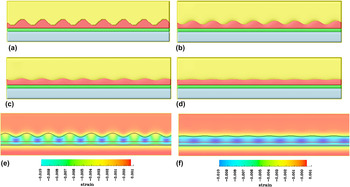
The simulated sequence of surface morphology evolution of the multiphase system is shown in Figures 2(a)–2(d). The initial profile of a sinusoidal wave surface morphology is used with the average thin film thickness h 0 = 10 nm and the amplitude β = 5 nm. The thickness of the buffer layer is assumed to be 5 nm. Figure 2(a) plots the prepared initial morphology of the thin film surface. Figures 2(b)–2(d) describes the thin film surface with the buffer layer at a time step of 1000, 3000, and 5000, respectively. It is clearly demonstrated that the surface morphology continues to smooth out from the initial profile with an In0.15Ga0.85As buffer layer. The sinusoidal-wave-shaped surface morphology can still be seen in the initial 1000 steps, as shown in Fig. 2(b). It can be seen that the amplitude of the sinusoidal wave continues to decrease and the surface smoothes out to relax the internal strain. Finally, only several small fluctuations are observed.
The time evolution of the surface morphology: (a) initial sinusoidal wave surface, (b–d) the surface morphology after 1000, 3000, and 5000 steps evolution. (e) and (f) represents the strain distribution of 1000 steps (b) and 5000 steps (d), respectively. The black, red, and blue lines in the strain distributions represent the gas/thin film, the thin film/buffer layer, and buffer layer/substrate interfaces, respectively.

To better understand the details of the strain relaxation mechanism with the buffer layer, the strain distributions at t* = 1000 and t* = 5000 are shown in Figs. 2(e) and 2(f). For initial sinusoidal-wave-shaped morphology, it can be seen that the strain becomes more compressive at the bottom of the wave but even tensile on the top of the wave, which is similar to the previous simulation results of nanodot coarsening. Reference Hu, Gao and Liu21 Also, we note that the compressive strain is relaxed in the buffer layer, which proved the influence of the graded buffer. As there exists a buffer layer, a smooth surface morphology is favorable than nanodot shaped structures due to the strain relaxation in the buffer structure. The relaxation is confirmed by the strain distributions shown in Fig. 2(f). An average strain of around −0.011 is observed both in the thin film layer and the buffer layer. Finally, as the surface morphology went smooth, we see the decrease of the surface RMS roughness.
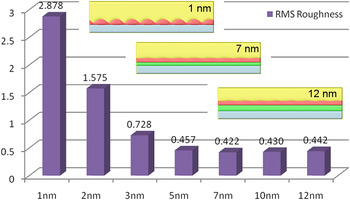
To investigate the influence of the buffer layer thickness on the roughness of the surface morphology, the buffer layer thickness in the range from 1 to 12 nm on the substrate is used in this work. Figure 3 shows the measured RMS roughness at different buffer layer thicknesses. It can be seen that the RMS roughness sharply reduced when increasing the buffer layer thickness. One interesting feature is observed in the surface morphology with 1-nm buffer layer, as shown in the inset of Fig. 3. The surface morphologies perform nanodot structures due to the very thin buffer layer structure. The compressive strain did not relax, and the surface morphology grows and coarsens, which induced a high RMS roughness. When the thickness of the buffer layer increases further, we see a significant decrease in the RMS roughness. When the thickness exceeds 3 nm, the RMS roughness decreased below 1. An optimal thickness of 7 nm is observed in these simulation results, the surface morphology is shown in the inset of Fig. 3. Only a slight increase of the RMS roughness is observed with a high buffer layer thickness, and a similar surface morphology is received.
The RMS roughness of the surface morphology with different buffer thicknesses varies from 1 to 12 nm. The inset morphology figures represent the buffer thickness of 1, 7, and 12 nm, respectively.

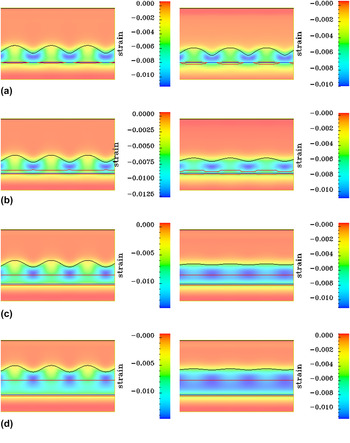
To understand the interplay between the buffer layers and the surface morphology through the strain relaxation with the buffer layer thickness, we performed the evolution of simulated strain distributions with several different values of buffer layer thickness. Figures 4(a)–4(d) represent the strain distribution with buffer layer thicknesses of 1, 2, 7, and 12 nm, respectively. The left column is the strain distribution after 1000 steps of evolution, and the right column is the strain distribution after 5000 steps of evolution. It is seen that the surface roughness decreases when larger buffer layer thickness is used. It is interesting to observe that the surface roughness decreases very fast when the thickness varies from 1 to 3 nm, which suggest that the surface morphology is highly sensitive to the thickness of the buffer layers. The observation of the distribution from Fig. 4(a) shows a strong compressive strain at the trough of the wave of the surface morphology. As the buffer layer thickness is rather small, the internal strain is still nonuniform after 5000 steps evolution, which introduced a high RMS roughness of the surface and a slight perpetuation of the substrate/buffer interface in the simulation. The nonuniform strain distribution led to a nanodot structure and the surface roughening process, which implies that the increased surface area results in an increase in the surface energy but in a greater reduction of the elastic energy and the total free energy of the system. Reference Liu19,Reference Wang, Zhang and Liu20 After the buffer layer thickness reaches 2 nm, a gradual change of the strain was clearly seen on the thin film/buffer layer interface under the trough of the sinusoidal wave of the surface morphology at early times, and then the strain distribution uniformity increases, which led to a sharp decrease of the surface roughness. With a further increase in the buffer layer thickness [Fig. 4(c)], the strain distribution is almost uniform and a high quality thin film is received. If a higher buffer layer thickness is assumed, such as 12 nm, a small increase in RMS roughness is obtained, which can be explained by the internal strain that needs some more time to reach the uniform state when the thickness increases. The simulation results revealed that the surface roughness of the epitaxial bilayer thin film is strongly correlated with the buffer layer thickness. The strain distribution for different buffer layer thicknesses well explained how the buffer layers work to decrease the surface roughness by strain distribution uniformity.
(a–d) The strain distribution evolution of the GaAs/InGaAs heterostructures with a buffer layer thickness of 1, 2, 7, and 12 nm, respectively. The black, red, and blue lines represent the gas/thin film, the thin film/buffer layer, and buffer layer/substrate interfaces, respectively.

Based on these simulation results shown above, it was found that the buffer layer thickness was a key parameter to affect the surface morphology and the quality of the epitaxial thin film. However, a very small thickness, which is similar to the case of no buffer layers, makes the surface morphology coarsen due to the fact that the thin film relaxes its internal stress via forming the nanodot structures. As a buffer layer is added between the thin film and the substrate, internal compressive strain can be relaxed through the buffer layer structures. There exists an optimal thickness of 7 nm in the buffer structures, which is also observed in some III–V semiconductor experimental studies. Reference Wang, Zhao, Li, Gong, Yang and Liang7 Similar simulation results are received by an initial random small fluctuation of surface morphology profile, which is popularly used in previous phase-field works. Reference Hu, Gao and Liu21–Reference Ni, He and Soh24 With further increase in the buffer layer thickness, the high buffer layer generates a stable surface for the rest of the thin film to grow on; while the thickness of the thin film remains constant, the In0.3Ga0.7As thin film is likely to grow on the In0.15Ga0.85As substrate with a new lattice parameter, which may induce a slight increase of the RMS roughness. It should be noted that, in experimental, the thickness of a buffer affects the growth mode, structural and optical properties, and the density of defects of the epitaxial thin film. Reference Zhang, Zhao, Wang, Wang, Chen, Liu and Yang6–Reference Luo, Wang, Guo, Xiao, Wang, Ran, Li and Li8 Especially the defects, like point defects or dislocations, may affect the surface morphologies and its RMS roughness. To understand the influence of the defects on the surface morphology, the phase-field model needs to be extended to include the defect mechanism both in the thin film and the buffer layers.
IV. CONCLUSION
In summary, a phase-field model is developed to simulate the In0.3Ga0.7As thin film grown on the GaAs substrate with In0.15Ga0.85As buffer layer structures. The evolution of the surface morphology, RMS roughness, and the strain distribution is examined in the current phase-field model. The coarsened nanodot structure is observed with a very thin buffer layer. It is found that the RMS roughness sharply reduced with an increase in the buffer layer thickness. However, the roughness slightly increases at a high buffer thickness. An optimal buffer layer thickness of 7 nm is predicted. The model with the role of defect mechanism is under development, which will be included in the future works.
ACKNOWLEDGMENTS
This work was supported by National Key Basic Research Project of China (Grant No. 973 Project), National Science Foundation of China (Contract Nos. 51002052 and 51372001), and Key Project in Science and Technology of Guangdong Province (Contract No. 2011A080801018). P. W. also would like to acknowledge funding from China Postdoctoral Science Foundation No. 2013M531840.