INTRODUCTION
Assessments of genetic diversity are important to further our knowledge on organismal behaviours, natural histories and population demographic factors highly relevant to conservation efforts (Avise, Reference Avise1998). Unfortunately, mitochondrial DNA (mtDNA), usually a source for markers for shallow level phylogenetic reconstructions in Metazoa, is in many sponge lineages too conserved to be suitable for phylogeographic studies (Shearer et al., Reference Shearer, van Oppen, Romano and Wörheide2002; Huang et al., Reference Huang, Meier, Todd and Chou2008). Thus, selecting a suitable molecular marker for resolving sponge intraspecies relationships is a crucial matter.
Introns constitute non-coding regions of genes between their exons. As their mutation rates are considerably higher compared with their flanking exons, nuclear introns are used as markers for intraspecific studies (Thomas et al., Reference Thomas, Welch, Woolfit and Bromham2006). A central challenge in utilizing introns is the identification of regions with sufficient variability and with flanking exon regions sufficiently conserved to facilitate PCR primer binding for a wide range of target taxa (see review in Zhang & Hewitt, Reference Zhang and Hewitt2003; Thomson et al., Reference Thomson, Wang and Johnson2010). Usage of markers with exon flanking regions as binding sites for the primers and a sufficiently variable intron (=EPIC, Exon-Primed, Intron-Crossing) represents a method of choice (see Palumbi & Baker, Reference Palumbi and Baker1994; Zhang & Hewitt, Reference Zhang and Hewitt2003; Thomson et al., Reference Thomson, Wang and Johnson2010).
In sponges, only a few phylogeographic studies utilize nuclear introns. The second intron of the Adenosine Triphosphate Synthase β subunit (referred to as ATPSβ in the following, see Jarman et al., Reference Jarman, Ward and Elliott2002) has successfully been utilized for the detection of geographic breaks in two species of calcareous sponges (Bentlage & Wörheide, Reference Bentlage and Wörheide2007; Wörheide et al., Reference Wörheide, Epp and Macis2008). Likewise ATPSβ has been used for detection of species complexes in the verongid Hexadella spp. (Reveillaud et al., Reference Reveillaud, Remerie, van Soest, Erpenbeck, Cardenas, Derycke, Xavier, Rigaux and Vanreusel2010) and the haplosclerid Xestospongia testudinaria (Lamarck, 1815) (Swierts et al., Reference Swierts, Peijnenburg, de Leeuw, Cleary, Hörnlein, Setiawan, Wörheide, Erpenbeck and de Voogd2013). Establishing an intron marker for a new species, however, is frequently hampered due to a small number of copies in the genome compared with mitochondrial (mt) or ribosomal RNA markers, and their variable intron length in combination with unpredictable resolution on population level. Consequently, a broader choice of nuclear intron markers for demosponge population studies is desirable.
This study aims to introduce the Lysidyl Aminoacyl Transfer RNA Synthetase intron (LTRS) as an intron marker for demosponges. LTRS is one of several nuclear intron markers for metazoans as suggested by Jarman et al. (Reference Jarman, Ward and Elliott2002), and was the only one of this suite successfully amplified for our testing species Neopetrosia chaliniformis (Thiele, 1899) in the course of this study. Neopetrosia chaliniformis (Demospongiae: Haplosclerida) is known as the ‘smooth-brown sponge’ (Lim et al., Reference Lim, de Voogd, Tan and Singapore2008) and abundantly distributed in the Indonesian archipelago (van Soest, Reference van Soest1989; de Voogd & Cleary, Reference de Voogd and Cleary2008) where it is the focus of several biochemical studies and therefore constitutes a relevant subject for phylogeographic studies (e.g. Orabi et al., Reference Orabi, El Sayed, Hamann, Dunbar, Al-Said, Higa and Kelly2002; de Almeida Leone et al., Reference de Almeida Leone, Carroll, Towerzey, King, McArdle, Kern, Fisher, Hooper and Quinn2008; Abdillah et al., Reference Abdillah, Nurhayati, Nurhatika, Setiawan and Heffen2013a, Reference Abdillah, Wahida Ahmad, Kamal Muzaki and Mohd Noorb). Using Neopetrosia chaliniformis we compare the suitability of LTRS with mtDNA markers previously suggested for intraspecies studies of sponges (Rua et al., Reference Rua, Zilberberg and Sole-Cava2011).
MATERIALS AND METHODS
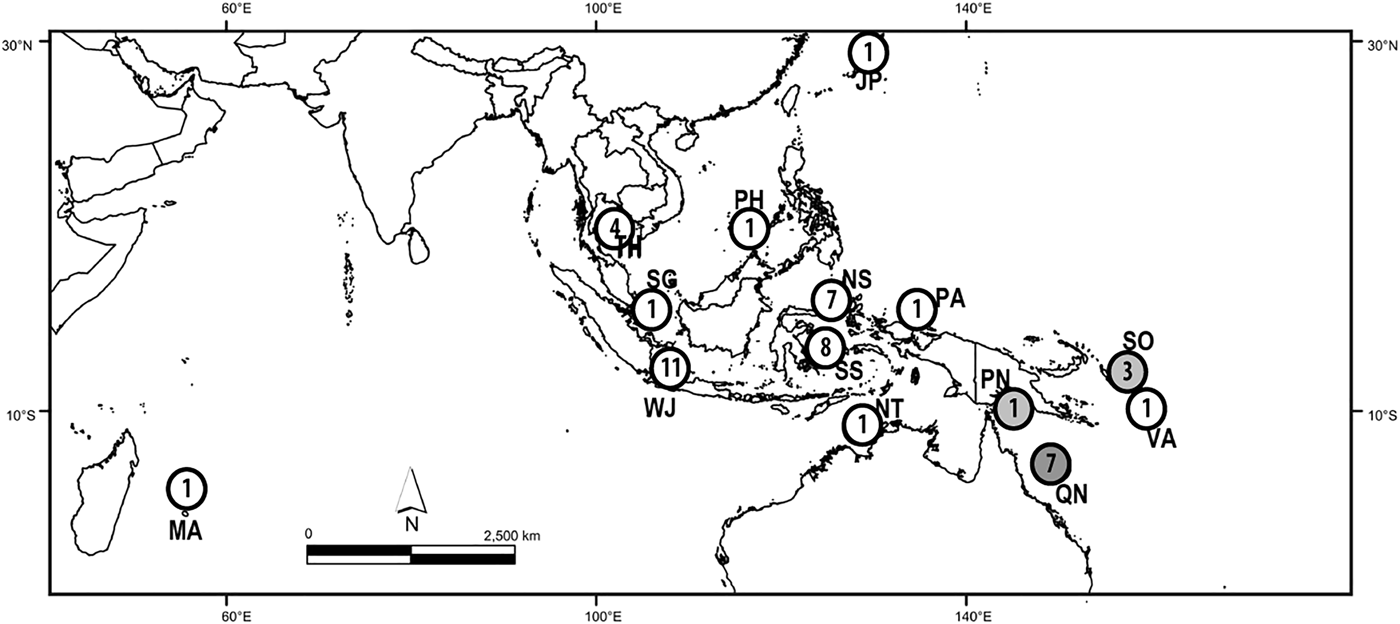
Specimens of N. chaliniformis were collected by scuba diving in depths ranging from 0–30 m in localities of West Java, North and South East Sulawesi. Directly after collection, samples were cut, rinsed and soaked for 24 h in 99% ethanol before they were finally preserved in fresh 99% ethanol. Additional samples from localities of Thailand, The Philippines, Japan, Mauritius and Singapore were provided by the Naturalis Biodiversity Center, Leiden, the Netherlands. The Queensland Museum Brisbane, Australia provided samples from other localities in the Australasia region (e.g. Queensland, Solomon Islands, Papua New Guinea, Palau and Vanuatu, see Figure 1 and Supplementary Material 1).
Localities with numbers of Neopetrosia chaliniformis samples used in this study. JP, Japan, MA, Mauritius; NS, North Sulawesi; NT, Northern Territory; PA, Palau; PH, Philippines; PN, Papua New Guinea; QN, Queensland; SG, Singapore; SO, Solomon Islands; SS, South Sulawesi; TH, Thailand; WJ, West Java; VA, Vanuatu.

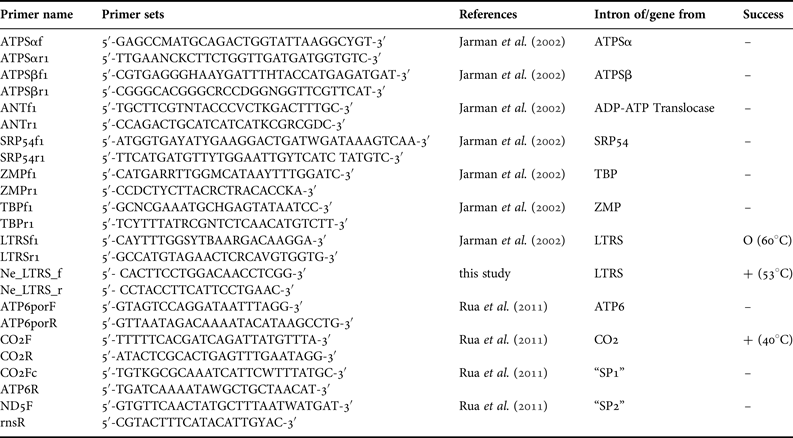
For DNA extraction, we used a method previously established for sponge barcoding (Vargas et al., Reference Vargas, Schuster, Sacher, Büttner, Schätzle, Läuchli, Hall, Hooper, Erpenbeck and Wörheide2012). Polymerase Chain Reaction (PCR) was performed with annealing temperature gradients to determine the optimal annealing temperatures for primers of the selected mitochondrial markers CO1 (following the protocols of Erpenbeck et al., Reference Erpenbeck, Breeuwer, van der Velde and Soest2002; Swierts et al., Reference Swierts, Peijnenburg, de Leeuw, Cleary, Hörnlein, Setiawan, Wörheide, Erpenbeck and de Voogd2013), ATP6, CO2 and the intergenic regions ‘SP1’ and ‘SP2’ (between ATP6 + CO2, and ND5 + rns, respectively, see Rua et al., Reference Rua, Zilberberg and Sole-Cava2011) and the intron markers ATPSα, ATPSβ, ANT, SRP54, LTRS, TBP and ZMP (see Table 1 and Jarman et al., Reference Jarman, Ward and Elliott2002). The 25 µL PCR mix consisted of 5 µL 5× green GoTaq ® PCR Buffer (Promega Corp, Madison, WI), 4 µL 25 mm MgCl2 (Promega Corp, Madison, WI), 2 µL 10 mm dNTPs, 1 µL each primer (5 µm), 9.8 µL H2O, 5–50 µg DNA template and 0.2 µL GoTaq ® DNA polymerase (5u μL−1) (Promega Corp, Madison, WI). The PCR regime comprised an initial denaturation at 94°C for 3 min, 35 cycles of 30 s denaturation at 94°C, 20 s annealing temperatures (cf. Table 1) and 60 s elongation at 72°C each, followed by a final elongation at 72°C for 5 min.
Primers utilized in this work; Success: –, no PCR product; O, amplification failed for most samples, particularly old museum specimens (annealing temperature); +, amplifications successful for all specimens (annealing temperature).
Distinct PCR products were cleaned by ammonium acetate precipitation (Sambrook et al., Reference Sambrook, Fritsch and Maniatis1989). Sequencing of forward and reverse strands was performed using the PCR primers with the ABI BigDye v3.1 chemistry (Applied Biosystems, CA, USA) following the manufacturer's protocol on an ABI 3730 Automated Sequencer in the Genomic Sequencing Unit of the LMU Munich. Sequences were assembled, analysed with Geneious version 6.1.7 (available from http://www.geneious.com/) and subsequently trimmed. MUSCLE version 3.5 (Edgar, Reference Edgar2004) as implemented in Geneious was used under default settings to align sequences. A BLAST test against GenBank (http://www.ncbi.nlm.nih.gov/) was performed in order to check for contaminations. Sequences are deposited at NCBI GenBank under accession numbers KM030095, KMC030097, KM030109 (mtDNA haplotypes) and KM030146–KM030169 (LTRS intron haplotypes).
SeqPHASE (Flot, Reference Flot2010) was used to determine the haplotypes of alleles when nucleotide reads were ambiguous. Haplotype numbers and genetic diversity indices (π) were calculated by Dna SP v. 5.10.01 (Librado & Rozas, Reference Librado and Rozas2009). Analysis of molecular variance (AMOVA) and the calculation of pairwise F ST values were performed in Arlequin v 3.5.1.2 (Excoffier et al., Reference Excoffier, Laval and Schneider2005) with a permutation test under 10,000 replicates. The significance of F ST values was amended following a Bonferroni correction (Rice, Reference Rice1989). Regional samples were pooled and categorized prior to analysis of genetic structure, as follows: West Java (WJ, N = 11), North Sulawesi (NS, N = 7), South Sulawesi (SS, N = 8), and Queensland (QN, N = 7). The samples from Japan (JP, N = 1), Mauritius (MA, N = 1), Northern Territory (NT, N = 1), Palau (PA, N = 1), Philippines (PH, N = 1), Papua New Guinea (PN, N = 1), Singapore (SG, N = 1), Solomon Islands (SO, N = 3), TH = Thailand (TH, N = 4), and Vanuatu (VA, N = 1), contained less than five samples and were therefore not included in the AMOVA test.
Phylogenetic patterns were analysed by reconstruction of Maximum-likelihood (ML) and Bayesian inference (BI) phylograms. The ML phylogram was generated by RAxML v. 7.0.4 in raxmlGUI v. 1.3 (Silvestro & Michalak, Reference Silvestro and Michalak2012) with 1000 rapid bootstrap replications (Stamatakis et al., Reference Stamatakis, Hoover and Rougemont2008). Conversely, the Bayesian phylogram was generated by MrBayes v. 3.2.1 (Ronquist et al., Reference Ronquist, Teslenko, van der Mark, Ayres, Darling, Höhna, Larget, Liu, Suchard and Huelsenbeck2012) under the ML model of evolution (see below). Each analysis consisted of two independent runs of four Metropolis-coupled Markov-chains under default temperatures with trees sampled at every 1000th generation. Analyses were terminated automatically when the chains converged significantly as indicated by an average standard deviation of split frequencies <0.01. The F81 model for the CO2 and SYM + I for the LTRS intron were suggested by the hierarchical likelihood ratio test as implemented in jModeltest v. 2.1.3 (Darriba et al., Reference Darriba, Taboada, Doallo and Posada2012) under the Akaike Information Criterion (Akaike, Reference Akaike1974). As SYM + I and F81 models are not implemented in the RAxML, ML analyses under the GTR model equivalents were applied respectively (see Stamatakis, Reference Stamatakis2008).
RESULTS AND DISCUSSION
LTRS intron of N. chaliniformis
Among the intron primers suggested by Jarman et al. (Reference Jarman, Ward and Elliott2002) only LTRS yielded distinct bands for N. chaliniformis as visualized by agarose electrophoresis. Neither usage of different PCR additives such as BSA, nor variable MgCl2 and DNA concentrations or variation in the PCR temperature profile improved the results for the other markers considerably.
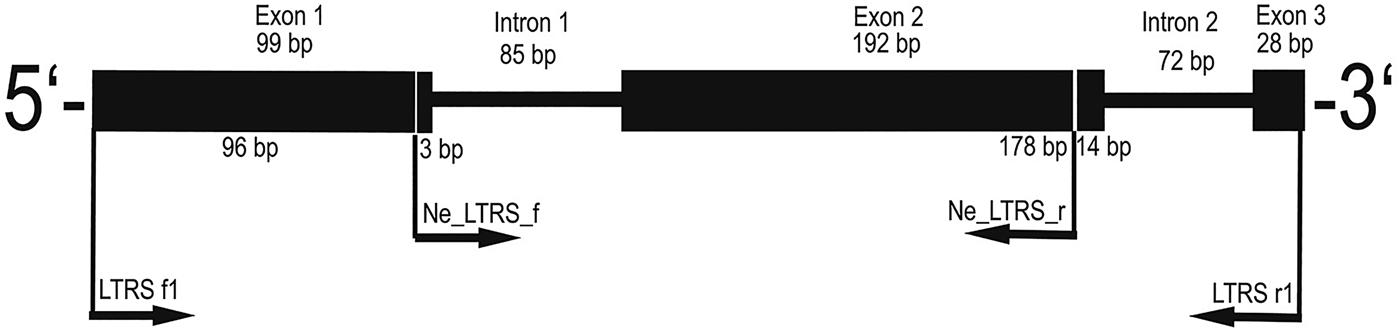
Only a subset of the N. chaliniformis DNA extracts could be amplified with the LTRS primers LTRSf1 and LTRSr1 (Jarman et al., Reference Jarman, Ward and Elliott2002). The resulting sequences constituted of 99 bp exon 1, 85 bp intron 1, 192 bp exon 2, 72 bp intron 2 and 28 bp exon 3 (see Figure 2). Out of this sequence information a pair of primers was designed with the capability to amplify all N. chaliniformis specimens. The new reverse primer was designed for binding in exon 2 instead of exon 3 in order to obtain a shorter LTRS fragment, which is easier amplifiable from museum material with potentially degraded DNA.
Primer map and intron splicing site of the LTRS fragment amplified by the universal LTRS intron primers from Jarman et al. (Reference Jarman, Ward and Elliott2002) (LTRS f1 and LTRS r1) and the newly designed specific LTRS intron primers for Neopetrosia chaliniformis (Ne_LTRS_f and Ne_LTRS_r).
For primer design, the consensus sequence from successful LTRS intron amplifications was queried in BLAST against GenBank (http://www.ncbi.nlm.nih.gov), which indicated the highest similarity to a predicted protein sequence of LTRS from Amphimedon queenslandica Hooper & van Soest, 2006, currently the only sponge genome published (accession number XP_003383808). This confirmed that the targeted LTRS gene was indeed from sponge origin and not from a sponge-associated organism. The intron splicing site was annotated with Geneious to distinguish both exon and intron regions. Exons were recognized by their amino acid translation according to their open reading frame (ORF). In accordance to the general splicing site motifs (Clancy, Reference Clancy2008), the intron region of the LTRS gene starts with GT in the 5′ splice site (the donor site), and possesses a branch site with pyrimidine nucleotides, and AG at the 3′ splice site (acceptor site).
The newly designed LTRS intron primers anneal in the first and second exons of the gene and therefore amplify a fragment 210 bp shorter than the fragment amplified with the original primers (Jarman et al., Reference Jarman, Ward and Elliott2002). The resulting 266 bp fragment constituted of 3 bp exon 1, 85 bp intron 1 (with 12 polymorphic sites) and 178 bp exon 2 (with 11 polymorphic sites, see details in Figure 2). In total 54 samples were used for subsequent analyses, which comprised 24 different haplotypes (see Supplementary Material S1). Furthermore, six samples (=11% of all taxa) displayed PHASE values lower than 0.900, which indicated that their haplotypes could not be distinguished unambiguously (Flot, Reference Flot2010) and were excluded.
Comparison to mitochondrial markers of N. chaliniformis
Of the mitochondrial primer sets suggested by Rua et al. (Reference Rua, Zilberberg and Sole-Cava2011) only cytochrome oxidase 2 (CO2) sequences were yielded in numbers that allowed a comparison with LTRS, which clearly diminished comprehensive marker comparison possibilities in this study. The low amplification success for different mtDNA fragments parallels the low success in intron amplification (see above) and highlights that even allegedly ‘universal’ primers may not be suitable for all taxa, and may require thorough testing and optimization. Particularly for Haplosclerida a comparatively high variability for nuclear (although ribosomal) genes was reported earlier (Erpenbeck et al., Reference Erpenbeck, McCormack, Breeuwer and van Soest2004).
CO2 is suggested as a mitochondrial marker with potential suitability for phylogeographic analysis of sponges (Rua et al., Reference Rua, Zilberberg and Sole-Cava2011), but in our study CO2 displays less variability in Neopetrosia chaliniformis compared with the LTRS intron. The corresponding CO2 sequences had a length of 350 base pairs (bp) with only two variable sites and an uncorrected p-distance of 0.58% (π = 0.00104).
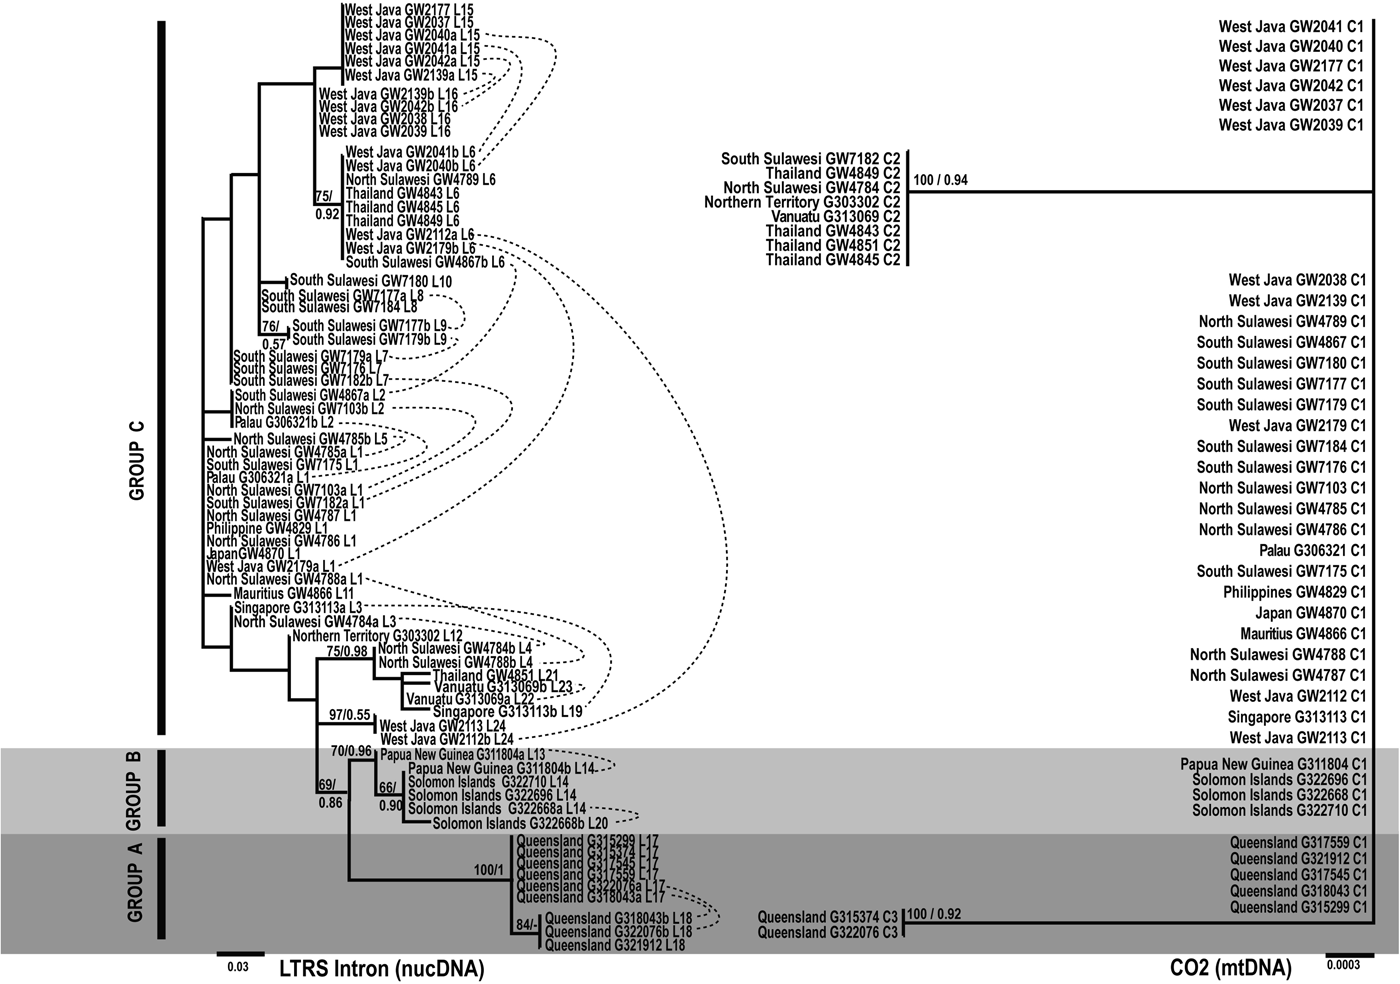
Figure 3 displays the phylogenetic trees reconstructed for both fragments. The LTRS tree, based on the whole amplified LTRS fragment, displays more resolution due to the higher number of different haplotypes, however most of the clades are unsupported. In the LTRS tree three clades are evident (in the following called Groups A, B and C) based on (i) support of bootstrap and posterior probabilities, (ii) reciprocal monophyly, i.e. the distribution of heterozygote alleles in the tree, and (iii) Bootstrap analyses with heterozygote allele states recoded as polymorphic sites (not shown).
Unrooted Maximum-likelihood phylogram from N. chaliniformis LTRS intron and CO2 mtDNA sequences. Numbers on the branches represent Maximum likelihood bootstrap proportions (BP)/Bayesian inference posterior probabilities (PP). Scale bars indicate the number of substitutions per site, whereas dashed lines combine haplotypes of one heterozygote individual as detected by SeqPHASE. C1–C3: CO2 haplotypes; L1–L26: LTRS intron haplotypes.
Group A contains all specimens from the Great Barrier Reef of Northern & Central Queensland, Group B contains all specimens from Solomon Islands & Papua New Guinea. Group C, the largest group, contains sequences of all other localities in the Indonesian Archipelago (West Java, North Sulawesi, South Sulawesi) and Thailand, including single samples from Mauritius, Japan, The Philippines, Singapore, Northern Territory, Palau and Vanuatu. The separation of Group C from A and B is also supported by 28S data (Setiawan et al., in preparation).
The CO2 data set is based on three haplotypes, each differing by one base pair only. One haplotype, C1, is dominant and corresponds to taxa of the LTRS groups A, B and C. The CO2 tree is largely unresolved and does not support any of the three LTRS groups. Instead CO2 recovers two clades, which in turn do not contradict any of the supported clades in LTRS (Figure 3). Our results indicate a higher resolution power of the LTRS intron compared with the other markers applied in the present study, but similarly remind that phylogenetic reconstructions based on nuclear and mtDNA may differ considerably (see Moore, Reference Moore1995). Shallow level phylogenetic analyses based on nuclear intron data should therefore be analysed in combination with additional markers (Wiens et al., Reference Wiens, Kuczynski and Stephens2010). Also, as high levels of substitutional saturation have been found in barnacle LTRS intron data (Wares et al., Reference Wares, Pankey, Pitombo, Gómez Daglio and Achituv2009), the suitability of this marker in population studies should be verified in every analysis.
LTRS case study on Indo-pacific N. chaliniformis
Both exon and intron parts possessed an uncorrected p-distance of 8.65% (π = 0.01912). This is higher than the uncorrected p-distances for Atlantic Hexadella in ATPSβ, the only other intron used for demosponge population analyses so far, measured in a range of 8700 km (1.3–6.3%, see Reveillaud et al., Reference Reveillaud, Remerie, van Soest, Erpenbeck, Cardenas, Derycke, Xavier, Rigaux and Vanreusel2010). In comparison with ATPSβ data of calcareous sponges the p-distance in the current LTRS data set is in the range of populations of Pericharax heteroraphis Poléjaeff, 1883 sampled in a range of more than 3000 km (8.3%; Bentlage & Wörheide, Reference Bentlage and Wörheide2007) and Leucetta chagosensis Dendy, 1913 sampled in a range of more than 10,000 km (9.57%, π = 0.03524; Wörheide et al., Reference Wörheide, Epp and Macis2008).
AMOVA revealed a F ST value that indicated genetic structuring among the pooled populations of West Java, North Sulawesi, South Sulawesi and Queensland (0.20816, P < 0.05 after Bonferroni correction). A spatial analysis showed that the Queensland population was strongly and significantly different from West Java, North Sulawesi and South Sulawesi (F ST between 0.28205 and 0.33134, P < 0.05 after Bonferroni correction). Genetic structuring was absent between populations of North and South Sulawesi (see Table 2).
Pairwise F ST values between populations (N > 5) of N. chaliniformis (LTRS intron/CO2).
*significant values at P < 0.005 after Bonferroni corrections.
Nevertheless, the sample size of the N. chaliniformis data set is low and a higher sample size and corroboration from additional markers is needed to formulate a robust phylogeographic conclusion. However, the current LTRS pattern for Groups A and B not only comprise geographically distinct groups, their close relationships would resemble previous findings among sponges in the Indo-Australian Archipelago: using rDNA and ATPSβ of Leucetta chagosensis, several instances of closely connected lineages of this genetically deeply divergent species between the Great Barrier Reef and Papua New Guinea were recovered (Wörheide et al., Reference Wörheide, Epp and Macis2008). A phylogeographic break between Great Barrier Reef (group A) and Sulawesi (group C) sequences was also recovered for Pericharax heteroraphis (Bentlage & Wörheide, Reference Bentlage and Wörheide2007). An East–West barrier has not been detectable for N. chaliniformis with the current data set (see also Becking et al. Reference Becking, Erpenbeck, Peijnenburg and de Voogd2013). At present, there are no geographically comprehensive studies on sponges in the Indonesian archipelago, which is in contrast to other marine invertebrates, which revealed distinct biodiversity patterning in this area (see review in Hoeksema, Reference Hoeksema and Renema2007). The lack of geographic separation in Group C, however, might be based on dispersal factors. Long-distance dispersal events are occasionally observed in some sponge taxa (e.g. Wörheide et al., Reference Wörheide, Sole-Cava and Hooper2005, Reference Wörheide, Epp and Macis2008; Lopez-Legentil & Pawlik, Reference Lopez-Legentil and Pawlik2009; DeBiasse et al., Reference DeBiasse, Richards and Shivji2010; Xavier et al., Reference Xavier, van Soest, Breeuwer, Martins and Menken2010). This ability of sponges to disperse asexual fragments in currents or to raft on various floating material (Wulff, Reference Wulff1995; Maldonado & Uriz, Reference Maldonado and Uriz1999) might result in the absence of genetic separation between two isolated localities, as proposed by Wörheide et al. (Reference Wörheide, Epp and Macis2008) for Leucetta chagosensis. Neopetrosia chaliniformis possesses a variable shape of mostly encrusted form and sometimes has branches including a structure like turrets. The consistency of N. chaliniformis is compressible and extremely brittle. Such morphological characteristics may facilitate the dispersal of asexual parts through water current or some floating materials. Therefore, asexual reproduction with dispersal ability by floating is a likely explanation for the absence of a phylogeographic signal in Group C, however, a more comprehensive taxon sampling is required for further conclusions. As with all phylogenetic analyses, the results of the LTRS data should be corroborated with additional, preferably independent markers (Wiens et al., Reference Wiens, Kuczynski and Stephens2010).
CONCLUSION
The LTRS intron is an alternative nuclear marker for shallow-level phylogeny and phylogeographic studies in N. chaliniformis. LTRS intron data recover several reciprocal monophyletic groups among Indo-Pacific N. chaliniformis and outperform mitochondrial CO2 sequences in terms of variability. Although assessments from other demosponge species are required to confirm for broader taxonomic applications, and next-generation sequencing techniques such as SNP and RADSeq appear the methods of choice in the future, the LTRS intron provides an additional nuclear EPIC intron marker for demosponge phylogeographic analyses.
SUPPLEMENTARY MATERIAL
To view supplementary material for this article, please visit http://dx.doi.org/10.1017/S0025315415001721.
ACKNOWLEDGEMENTS
The laboratory assistance from Astrid Schuster, Gabriele Büttner and Simone Schätzle (Molecular Palaeobiology research groups in LMU Munich), constructive criticism from Rob van Soest (The Naturalis Biodiversity Center, Leiden, the Netherlands), and two anonymous reviewers are highly appreciated as well as sampling collections from Ratih Aryasari (Biology Faculty, Gadjah Mada University Indonesia) and Merrick Ekins (the Queensland Museum, Brisbane, Australia). In addition, ES also acknowledges Jean-François Flot (MPI for Dynamics & Self-Organization, Biological Physics and Evolutionary Dynamics, Göttingen, Germany) for the assistance on SeqPHASE tutorial, and Thomas T. Putranto (Hydrogeology, RWTH Aachen, Germany) for contributions to the geographical map in this manuscript.
FUNDING
ES would like to thank the DAAD (German Academic Exchange Service) for the PhD Fellowship. Furthermore, ES acknowledges the Martin Fellowship from the Natural Biodiversity Center.