1 Introduction
Coalescence dynamics of a drop in a liquid pool has been a fascinating subject of research for many centuries due to its relevance in natural phenomena (Thomson & Newall Reference Thomson and Newall1886; Worthington Reference Worthington1908) and industrial applications (Stone, Stroock & Ajdari Reference Stone, Stroock and Ajdari2004). The subject has caught the attention of many researchers recently due to its complex nature and rich underlying physics (Morton, Rudman & Jong-Leng Reference Morton, Rudman and Jong-Leng2000; Thoroddsen & Takehara Reference Thoroddsen and Takehara2000; Chen, Mandre & Feng Reference Chen, Mandre and Feng2006a ; Gilet et al. Reference Gilet, Mulleners, Lecomte, Vandewalle and Dorbolo2007; Ray, Biswas & Sharma Reference Ray, Biswas and Sharma2010; Zhang et al. Reference Zhang, Thoraval, Thoroddsen and Taborek2015; Deka et al. Reference Deka, Ray, Biswas and Dalal2018). Consequently, different regimes from partial/complete coalescence (at low impact velocity) to splashing (at high impact velocity) have been identified. In partial coalescence, a satellite drop pinches off, which undergoes a cascading process until the satellite drop is completely merged on the liquid pool.
When a drop comes in contact with the free surface of a liquid pool at a low velocity, it floats until the surrounding fluid trapped between the drop and the free surface is drained out. After this, coalescence occurs, forming a neck at the contact point of the drop and the free surface, which expands rapidly due to high capillary pressure near the contact region. This results in upward moving capillary waves and thereby the formation of a liquid column, followed by a necking process near the contact region. The diameter of the neck reduces with time due to the inward pull exerted by surface tension and a satellite drop pinches off (Blanchette & Bigioni Reference Blanchette and Bigioni2006; Ray et al. Reference Ray, Biswas and Sharma2010). The pinch-off process is influenced by the competition between the vertical and horizontal collapse rates of the liquid column. When the vertical collapse is sufficiently delayed by the upward pull exerted by the capillary waves, the horizontal collapse succeeds in merging the neck and producing a satellite drop. Charles & Mason (Reference Charles and Mason1960) reported that the partial coalescence of a drop is a consequence of an inviscid instability (Rayleigh Reference Rayleigh1878) of the liquid column that forms after coalescence. Later, it was revealed that the dynamics of partial coalescence is primarily governed by gravity, viscosity and interfacial tension (Thoroddsen & Takehara Reference Thoroddsen and Takehara2000; Chen, Mandre & Feng Reference Chen, Mandre and Feng2006b ).
Chen et al. (Reference Chen, Mandre and Feng2006b
) delineated gravity, inertio-capillary, viscosity-dominated regimes for the coalescence of a drop in a liquid pool. The coalescence phenomenon is driven by gravity at higher values of the Bond number, given by
 $Bo=\unicode[STIX]{x1D70C}_{1}gD^{2}/\unicode[STIX]{x1D70E}$
, wherein
 $D$
denotes the drop diameter,
 $g$
represents the acceleration due to gravity,
 $\unicode[STIX]{x1D70E}$
denotes the interfacial tension, and
 $\unicode[STIX]{x1D70C}_{1}$
is the density of the drop. The viscous effect becomes dominant at lower values of
 $Bo$
. At intermediate values of
 $Bo$
, the coalescence phenomenon is driven by inertia and capillary forces. Partial coalescence is primarily observed in the inertio-capillary regime. The effect of the physical properties of the fluids on the coalescence process has been reviewed by Kavehpour (Reference Kavehpour2015). Yue, Zhou & Feng (Reference Yue, Zhou and Feng2006) also investigated the coalescence dynamics of a drop in Newtonian and viscoelastic fluids. All these previous studies considered ‘simple’ drops.
The aim of the present study is to investigate the coalescence dynamics of a compound liquid drop in a deep pool of the same liquid. The study of compound drops is relevant in several applications, such as targeted drug delivery and advanced material processing (Terwagne et al. Reference Terwagne, Gilet, Vandewalle and Dorbolo2010). Aston (Reference Aston1972) investigated the dynamics of a gas-filled hollow raindrop in the presence of aerosols. Subsequently, several researchers (Gulyaev et al. Reference Gulyaev, Solonenko, Gulyaev and Smirnov2009; Kumar et al. Reference Kumar, Gu, Tabbara and Kamnis2013; Li et al. Reference Li, Duan, Zheng and Liu2018) have investigated the impact of a compound drop on solid surfaces due to its importance in painting, coating and printing technologies. Terwagne et al. (Reference Terwagne, Gilet, Vandewalle and Dorbolo2010) studied the coalescence of a compound drop on a vertically vibrated bath for a different configuration and observed the formation of a double emulsion above a threshold frequency. Heat transfer characteristics during the impact of a compound drop on a heated surface have also been investigated (Zheng et al. Reference Zheng, Li, Qiu and Cui2017; Li et al. Reference Li, Duan, Zheng and Liu2018). Gao & Feng (Reference Gao and Feng2011) numerically investigated the spreading behaviour of a compound drop on a partially wetting solid substrate. They observed various flow regimes depending on the radius ratio of a compound drop. However, to the best of the authors’ knowledge, the partial coalescence dynamics of a compound drop has not yet been investigated, and is the subject of the present study.
We investigate the effect of radius ratio,
 $R_{r}$
(the ratio of the inner radius to the outer radius of the compound drop), while maintaining a constant volume in the outer shell equal to that of a ‘simple’ drop of radius
 $R_{eq}$
. The influence of fluid properties on the satellite drop formation has been studied in terms of the governing dimensionless numbers. The mechanism of the coalescence behaviour has also been addressed. We observed that the location of the inner bubble after coalescence plays an important role in the pinch-off process of the satellite drop.
The paper is organized as follows. The problem is formulated in § 2, wherein the governing equations, numerical method and validation of the present solver are discussed. The results are presented in § 3 and concluding remarks are given in § 4.
2 Formulation
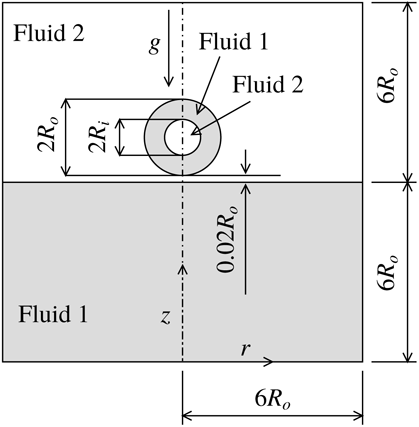
Schematic diagram showing the initial configuration of a compound drop placed near the free surface of a liquid pool with zero initial velocity.

The coalescence dynamics of a compound liquid drop in a liquid pool is investigated via axisymmetric numerical simulations using Gerris (Popinet Reference Popinet2009), which is based on the volume of fluid (VoF) method. The schematic diagram showing the initial configuration of the drop is presented in figure 1. The drop and the liquid in the pool are designated by fluid ‘1’, while the surrounding medium is designated by fluid ‘2’. The dynamic viscosities and the densities of fluid ‘1’ and fluid ‘2’ are
 $(\unicode[STIX]{x1D707}_{1},\unicode[STIX]{x1D70C}_{1})$
and
 $(\unicode[STIX]{x1D707}_{2},\unicode[STIX]{x1D70C}_{2})$
, respectively. The fluids are assumed to be Newtonian and incompressible.
A cylindrical coordinate system
 $(r,z)$
is used to model the flow dynamics, such that
 $z=0$
represents the bottom of the computational domain and
 $r=0$
is the axis of symmetry. Gravity
 $(g)$
acts in the negative
 $z$
direction. The inner and outer radii of the compound drop are
 $R_{i}$
and
 $R_{o}$
, respectively. The size of the computational domain is
 $6R_{0}\times 12R_{0}$
, such that the initial height of the liquid pool is
 $6R_{o}$
. The computational domain considered in the present study is large enough to have negligible boundary effect. For all the results presented in the study,
 $t=0$
represents the instant at which the drop touches the free surface of the pool. However, the simulations are started with the quiescent drop resting above the interface with a small gap (
 ${\approx}0.02R_{o}$
) between the two interfaces, as shown in figure 1.
2.1 Governing equations
The continuity and the Navier–Stokes equations govern the flow dynamics, which are given by
 $$\begin{eqnarray}\displaystyle & \displaystyle \unicode[STIX]{x1D735}\boldsymbol{\cdot }\boldsymbol{u}=0, & \displaystyle\end{eqnarray}$$
 $$\begin{eqnarray}\displaystyle & \displaystyle \unicode[STIX]{x1D70C}\left[\frac{\unicode[STIX]{x2202}\boldsymbol{u}}{\unicode[STIX]{x2202}t}+\boldsymbol{u}\boldsymbol{\cdot }\unicode[STIX]{x1D735}\boldsymbol{u}\right]=-\unicode[STIX]{x1D735}P+\unicode[STIX]{x1D735}\boldsymbol{\cdot }\left[\unicode[STIX]{x1D707}\left(\unicode[STIX]{x1D735}\boldsymbol{u}+\unicode[STIX]{x1D735}\boldsymbol{u}^{T}\right)\right]+\unicode[STIX]{x1D70E}\unicode[STIX]{x1D705}\hat{\boldsymbol{n}}\unicode[STIX]{x1D6FF}_{s}(\boldsymbol{r}-\boldsymbol{r}_{f})-\unicode[STIX]{x1D70C}g\hat{\boldsymbol{e}}_{z}, & \displaystyle\end{eqnarray}$$
where
 $\boldsymbol{u}(u,v)$
is the velocity field, wherein
 $u$
and
 $v$
represent the components of velocity in the radial
 $(r)$
and vertical
 $(z)$
directions, respectively;
 $\unicode[STIX]{x1D705}$
is the mean curvature;
 $\hat{\boldsymbol{n}}$
is the unit normal vector at the interface pointing towards fluid ‘2’;
 $\hat{\boldsymbol{e}}_{z}$
is the unit normal vector in the
 $z$
direction;
 $\unicode[STIX]{x1D6FF}_{s}(\boldsymbol{r}-\boldsymbol{r}_{f})$
is a delta distribution function, which is zero everywhere except at the interface, where
 $\boldsymbol{r}=\boldsymbol{r}_{f}$
;
 $t$
denotes time.
The following advection equation for the volume fraction
 $c$
of fluid ‘
 $1$
’, whose value is taken as 1 and 0 for fluid ‘1’ and fluid ‘2’, respectively, is solved in order to track the interface separating the two fluids:
 $$\begin{eqnarray}\frac{\unicode[STIX]{x2202}c}{\unicode[STIX]{x2202}t}+\boldsymbol{u}\boldsymbol{\cdot }\unicode[STIX]{x1D735}c=0.\end{eqnarray}$$
The density,
 $\unicode[STIX]{x1D70C}$
, and the dynamics viscosity,
 $\unicode[STIX]{x1D707}$
, are calculated as
 $$\begin{eqnarray}\displaystyle & \displaystyle \unicode[STIX]{x1D70C}=\unicode[STIX]{x1D70C}_{1}c+\unicode[STIX]{x1D70C}_{2}(1-c), & \displaystyle\end{eqnarray}$$
 $$\begin{eqnarray}\displaystyle & \displaystyle \unicode[STIX]{x1D707}=\unicode[STIX]{x1D707}_{1}c+\unicode[STIX]{x1D707}_{2}(1-c). & \displaystyle\end{eqnarray}$$
2.2 Boundary conditions
The governing equations (2.1)–(2.3) are solved using the following boundary conditions. The symmetry boundary condition is used at
 $r=0$
and the free-slip boundary condition is employed at the side boundary (
 $r=6R_{0}$
). No-slip and no-penetration boundary conditions are used at the bottom wall
 $(z=0)$
and the Neumann boundary condition is used at the top of the computational domain (
 $z=12R_{0}$
).
2.3 Non-dimensionalization
The governing equations and the boundary conditions are non-dimensionalized using the equivalent radius of the compound drop,
 $R_{eq}(\equiv (R_{o}^{3}-R_{i}^{3})^{1/3})$
as the length scale,
 $V_{s}(\equiv \sqrt{\unicode[STIX]{x1D70E}/\unicode[STIX]{x1D70C}_{1}R_{eq}})$
as the velocity scale, and
 $t_{s}(\equiv \sqrt{\unicode[STIX]{x1D70C}_{1}R_{eq}^{3}/\unicode[STIX]{x1D70E}})$
as the time scale, such that
 $$\begin{eqnarray}\displaystyle \left.\begin{array}{@{}c@{}}(z,r)=R_{eq}(\widetilde{z},\widetilde{r}),\quad (u,v)=V_{s}(\widetilde{u},\widetilde{v}),\quad \unicode[STIX]{x1D707}=\unicode[STIX]{x1D707}_{2}(\widetilde{\unicode[STIX]{x1D707}}),\quad \unicode[STIX]{x1D70C}=\unicode[STIX]{x1D70C}_{1}(\widetilde{\unicode[STIX]{x1D70C}}),\\ P=\unicode[STIX]{x1D70E}/R_{eq}(\widetilde{P}),\quad t=t_{s}(\widetilde{t}),\end{array}\right\} & & \displaystyle\end{eqnarray}$$
where tildes designate the dimensionless variables, which are dropped hereafter while presenting the results. The dimensionless numbers used to describe the results are the Bond number,
 $Bo(\equiv \unicode[STIX]{x1D70C}_{1}gR_{eq}^{2}/\unicode[STIX]{x1D70E})$
, the Ohnesorge numbers associated with fluid ‘1’ and fluid ‘2’, which are given by
 $Oh_{1}(\equiv \unicode[STIX]{x1D707}_{1}/\sqrt{\unicode[STIX]{x1D70C}_{1}\unicode[STIX]{x1D70E}R_{eq}})$
and
 $Oh_{2}(\equiv \unicode[STIX]{x1D707}_{2}/\sqrt{\unicode[STIX]{x1D70C}_{1}\unicode[STIX]{x1D70E}R_{eq}})$
, respectively, the Atwood number,
 $At(\equiv (\unicode[STIX]{x1D70C}_{1}-\unicode[STIX]{x1D70C}_{2})/(\unicode[STIX]{x1D70C}_{1}+\unicode[STIX]{x1D70C}_{2}))$
, and the radius ratio,
 $R_{r}(\equiv R_{i}/R_{o})$
.
2.4 Numerical method and validation of the solver
A VoF-method-based open source solver Gerris (Popinet Reference Popinet2009), which incorporates a height-function-based balanced-force continuum-surface-force formulation for the inclusion of the surface tension term in the Navier–Stokes equations is used. A dynamic adaptive grid refinement is incorporated that provides a large number of grid points/cells in the interfacial region and regions with velocity gradient. The numerical scheme is second-order accurate in space and time. Extensive validation exercises of the current numerical methodology have been performed in our previous studies (see for instance, Tripathi, Sahu & Govindarajan (Reference Tripathi, Sahu and Govindarajan2015)). In addition, we have also validated the present solver by comparison with the experimental result of Blanchette & Bigioni (Reference Blanchette and Bigioni2006) for a ‘simple’ drop.
Figure 2 shows the comparison of the coalescence dynamics of a ‘simple’ ethanol drop of radius
 $R_{eq}=0.535$
mm obtained from the present numerical simulation (red coloured profiles) with the experiment of Blanchette & Bigioni (Reference Blanchette and Bigioni2006). The corresponding dimensionless numbers are
 $Oh_{1}=1.09\times 10^{-2}$
,
 $Oh_{2}=2.08\times 10^{-4}$
,
 $At=0.997$
and
 $Bo=0.09$
. In the experiment of Blanchette & Bigioni (Reference Blanchette and Bigioni2006), an ethanol drop was deposited onto the surface of a pool containing ethanol and the dynamics were captured using a high-speed camera. The coalescence starts at
 $t=0$
. For
 $t>0$
, the drop starts to drain into the pool (see
 $t=0.53$
, 1.15 and 1.4 ms). This generates a cylindrical column whose height is higher than that of the initial drop (
 $t=2.62$
ms). The neck of this column narrows down due to the inward pull of the surface tension, and a satellite drop is pinched off (
 $t=3.57$
ms). It can be seen in figure 2 that the dynamics obtained from our numerical simulation at different time instants are in good agreement with the experiment of Blanchette & Bigioni (Reference Blanchette and Bigioni2006). Note that in the Gerris solver, the pinch-off of satellite drop is decided by the smallest cell size. However, it is shown below that after a certain refinement level the results do not change.
Comparison against the experiment of Blanchette & Bigioni (Reference Blanchette and Bigioni2006) presenting the partial coalescence phenomenon of an ethanol drop of radius 0.535 mm in air. The present numerical results are shown in red, whereas the background images are the experimental results of Blanchette & Bigioni (Reference Blanchette and Bigioni2006). The times (in ms) are written on each image. The corresponding dimensionless parameters are
 $Oh_{1}=1.09\times 10^{-2}$
,
 $Oh_{2}=2.08\times 10^{-4}$
,
 $At=0.997$
and
 $Bo=0.09$
.

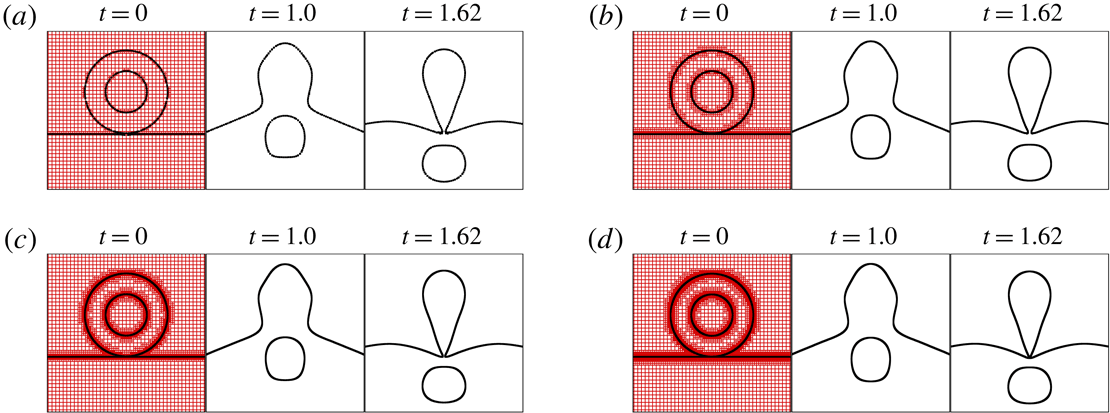
A grid convergence test is conducted in figure 3 for a compound ethanol drop of
 $R_{r}=0.5$
coalescing into an ethanol pool. The volume of the outer shell of the compound ethanol drop is kept the same as that of the ‘simple’ drop, as considered in figure 2. Thus the dimensionless numbers are the same as those used to generate figure 2. The simulations are performed with four different meshes using the adaptive mesh refinement feature of Gerris (Popinet Reference Popinet2009). This provides the finest cells in the interfacial region and in the region having a velocity gradient. The smallest (dimensionless) cell sizes,
 $\unicode[STIX]{x1D6E5}$
, used are 0.049 (figure 3
a), 0.023 (figure 3
b), 0.012 (figure 3
c), and 0.006 (figure 3
d). The corresponding values of
 $R_{s}/R_{eq}$
,
 $R_{s}$
being the radius of the satellite drop, are 0.617, 0.61, 0.607 and 0.606. It can also be seen in figure 3 that the coalescence dynamics obtained using different meshes are qualitatively similar. The percentage difference between the values of
 $R_{s}/R_{eq}$
for
 $\unicode[STIX]{x1D6E5}=0.012$
and 0.006 is approximately 0.13 %. Thus,
 $\unicode[STIX]{x1D6E5}=0.012$
has been used to generate the rest of the results presented in the present study.
Grid convergence test for the coalescence dynamics of an ethanol compound drop of radius ratio,
 $R_{r}=0.5$
: (a)
 $\unicode[STIX]{x1D6E5}=0.049$
, (b)
 $\unicode[STIX]{x1D6E5}=0.023$
, (c)
 $\unicode[STIX]{x1D6E5}=0.012$
and (d)
 $\unicode[STIX]{x1D6E5}=0.006$
. The remaining parameters are the same as those used to generate figure 2.

3 Results and discussion
We begin the presentation of our results by discussing the mechanism of the coalescence of a compound drop on a liquid pool. It is observed that for small
 $R_{r}$
, the coalescence dynamics of the compound drop is similar to that of a ‘simple’ drop, where the primary drop produces a satellite drop after pinch-off. Such a dynamics is presented in figure 2. On the other hand, the partial coalescence phenomenon (i.e. the formation of satellite drop) is not observed in case of a compound drop with large
 $R_{r}$
. The coalescence dynamics of compound drops with
 $R_{r}=0.5$
and
 $R_{r}=0.7$
are discussed in figure 4.
The coalescence sequence of a compound ethanol drop. The radius ratios in (a,b) are
 $R_{r}=0.5$
and
 $R_{r}=0.7$
, respectively. The remaining dimensionless numbers are same as those used to generate figure 2. Arrow marks indicate the direction of the momentum acting on the interface.

It can be seen in figure 4 that at the early stage (as the drop comes in contact with the free surface), the curvature near the contact region becomes sharp, which in turn generates a large capillary pressure near the contact region, leading to the rapid expansion of the neck. The uneven curvature of the coalescing drop creates a pressure difference between the regions above and below the bubble (inner shell of the compound drop), such that pressure is high above and low below the bubble. As a result, a downward force acts on the bubble and it starts to move in the downward direction, as shown at
 $t=0.25$
in figure 4. Due to this movement of the bubble in the downward direction, the neck tends to expand in order to create a passage for the bubble, and the resultant capillary waves propagate in the upward direction along the interface of the coalescing drop (as indicated by the arrow marks at
 $t=0.25$
and 0.5). When these waves reach the top part of the drop, an upward thrust is generated at the drop tip, as shown at
 $t=0.75$
. The upward momentum exerted by the capillary waves delays the vertical collapse of the drop (forming a column of fluid ‘1’), while the bubble continues to move in the downward direction due to the pressure difference at the top and bottom portions of the bubble, and the push induced by the drainage of the drop liquid. The buoyancy opposes the motion of the bubble of fluid ‘2’ (which is lighter than fluid ‘1’). For the parameter values considered, the above-mentioned process is mostly similar until
 $t=0.75$
for different values of
 $R_{r}$
, as shown in figure 4. The influence of the propagating capillary waves along the interface has been extensively studied by Blanchette & Bigioni (Reference Blanchette and Bigioni2006), Thoroddsen et al. (Reference Thoroddsen, Qian, Etoh and Takehara2007), Ray et al. (Reference Ray, Biswas and Sharma2010), Ding et al. (Reference Ding, Li, Zhang, Sui, Spelt and Thoroddsen2012), Deka et al. (Reference Deka, Biswas, Chakraborty and Dalal2019) in the case of ‘simple’ drops.
In the case of a compound drop with small
 $R_{r}$
(i.e. when the inner bubble is small), the pressure difference at the top and bottom portions of the bubble acting in the downward direction dominates the buoyancy force acting in the upward direction. Thus the bubble moves a longer distance in the downward direction as compared to a larger bubble (i.e. for large
 $R_{r}$
). It can be seen in figure 4 that for
 $R_{r}=0.5$
(a) the inner bubble moves far below the neck region of the drop (see at
 $t=1$
and 1.25). Then due to the inward momentum generated by surface tension, the neck of the column narrows down (
 $t=1.5$
), and a secondary or satellite drop is pinched off (
 $t=1.75$
).
On the other hand, for
 $R_{r}=0.7$
, as the size of the inner bubble is large enough, the buoyancy force that acts in the upward direction cannot be dominated by the pressure difference acting in the downward direction. Thus the bubble does not move far away from the neck region. Another way to compare the dynamics for the small and large values of
 $R_{r}$
is that a large bubble (large
 $R_{r}$
) expends more energy to expand the neck in order to make its passage as compared to a small bubble (small
 $R_{r}$
). Due to the competition between the buoyancy and the pressure difference acting in the opposite direction, the bubble deforms significantly, which opposes narrowing of the neck. As a result, the neck does not become thin enough for the pinch-off to occur as in case of
 $R_{r}=0.5$
, and finally expands (
 $t=1.75$
in figure 4), leading to the complete coalescence of the drop without the formation of any satellite drop.
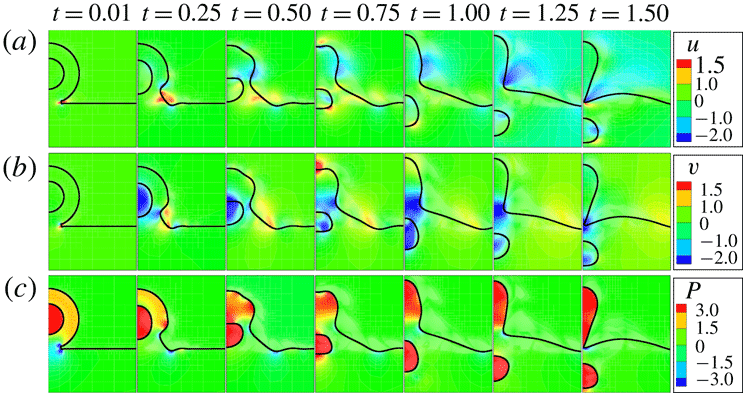
The temporal evolution of contours of the radial
 $(u)$
and vertical
 $(v)$
components of velocity and the pressure field (
 $P$
) for a compound drop with
 $R_{r}=0.5$
. The remaining dimensionless numbers are same as those used to generate figure 2.

In order to understand the flow field in the partial coalescence process of a compound drop, in figure 5 we present the contours of the radial
 $(u)$
and the vertical
 $(v)$
components of the velocity, and the pressure field
 $(P)$
for
 $R_{r}=0.5$
. It can be seen at the early times (
 $t\leqslant 0.5$
) in the
 $P$
field (c) that a pressure difference is created in the regions above and below the bubble due to the opening of the neck to facilitate drainage of the drop liquid into the pool. This pushes the bubble in the downward direction, as evidenced by the development of the negative
 $v$
velocity at
 $t\leqslant 0.5$
in figure 5(c). During this period, the change in curvature and deformation of the bubble to an oblate shape is accompanied by the development of an outward
 $u$
velocity near the neck. Non-zero
 $u$
velocity contours near the interfacial regions can be seen (a at
 $t\leqslant 0.5$
). Later, the force induced by drainage further pushes the bubble into the liquid pool. As the bubble moves downwards, away from the neck region, negative
 $u$
velocity develops near the neck region, as evident at
 $t\geqslant 1$
. The negative radial velocity component becomes sharper at
 $t=1.5$
, which makes the neck thinner and subsequently leads to the pinch-off of the satellite drop.
The variations of (a)
 $R_{s}/R_{eq}$
and (b)
 $t_{p}$
versus
 $R_{r}$
. The remaining parameter values are same as those used to generate figure 2.

Figure 6(a,b) shows the variation of the ratio between the equivalent radii of the secondary and primary drops (
 $R_{s}/R_{eq}$
) and the variation of pinch-off time
 $t_{p}$
with
 $R_{r}$
, respectively. Here,
 $R_{s}$
represents the equivalent radius of the satellite drop. The pinch-off time is defined as the time taken from start of coalescence to the pinch-off of the satellite drop. It can be observed that
 $R_{s}/R_{eq}$
remains nearly constant for all the values of
 $R_{r}$
considered. The pinch-off time,
 $t_{p}$
, also remains approximately the same for
 $R_{r}\leqslant 0.4$
(see figure 6
b), which increases sharply for
 $R_{r}>0.4$
. For the parameter values considered, we observe that the partial coalescence is completely suppressed for
 $R_{r}>0.56$
(approximately), which is termed as the critical radius ratio
 $(R_{cr})$
. The sharp increase in the value of
 $t_{p}$
for
 $0.4<R_{r}<0.6$
can be understood as follows. Near the critical radius ratio, the size of the bubble is large enough to create sufficient buoyancy force to oppose its downward motion. Because of low penetration of the bubble, it opposes the inward movement of the neck, leading to a delay in pinch-off (as discussed in figure 4). This effect increases at a faster rate with the increase in the value of
 $R_{r}$
for
 $R_{r}>0.4$
for this set of parameters. Furthermore, the drainage slows down due to the presence of the bubble, which acts like an obstacle and resists the drainage. As a result, although the drainage time of the liquid drop increases with an increase in the value of
 $R_{r}$
, the value of
 $R_{s}/R_{eq}$
remains almost constant.
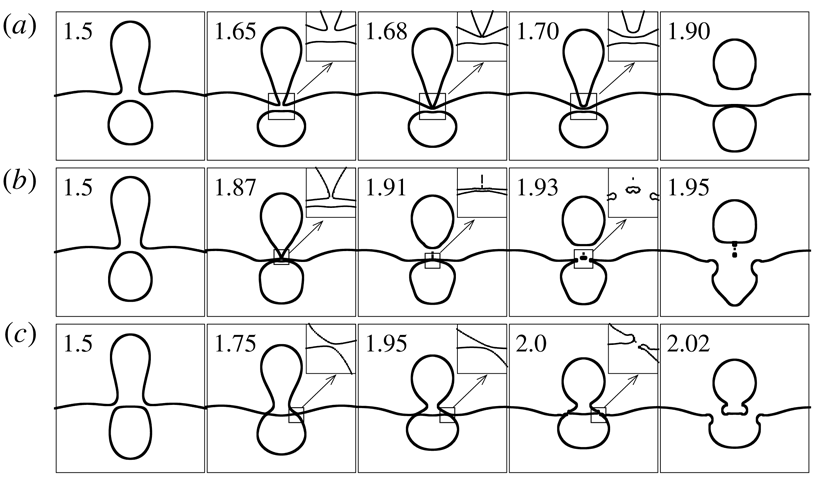
Different partial coalescence processes observed for
 $R_{r}=0.55$
(a),
 $R_{r}=0.56$
(b) and
 $R_{r}=0.58$
(c). The remaining dimensionless numbers are same as those used to generate figure 2.

Next, we discuss different types of partial coalescence dynamics observed in the case of a compound drop. We have observed three different types of coalescence for different values of
 $R_{r}$
, namely, (i) pinch-off of a satellite drop without bursting of the bubble, (ii) pinch-off of a satellite drop along with bursting of the bubble, and (iii) the bubble bursting before the pinch-off of the satellite drop. These processes are demonstrated in figure 7(a–c) and are associated with
 $R_{r}=0.55$
, 0.56 and 0.58, respectively. In the last case, it can be seen in figure 7(c) that the detachment of the satellite drop occurs as a result of the bubble bursting itself and not because of the pinching of the neck. The different partial coalescence phenomena observed for different values of
 $R_{r}$
can be attributed to the decrease in the penetration depth of the bubble with the increase in the value of
 $R_{r}$
, as explained in figure 4.
The variations of (a)
 $R_{s}/R_{eq}$
and (b)
 $t_{p}$
with
 $At$
for
 $R_{r}=0.5$
. The remaining dimensionless numbers are the same as those used to generate figure 2. The dashed lines indicate linear fits to the data points.

Finally, a parametric study is conducted by varying different dimensionless numbers. Figure 8(a,b) present the variations of
 $R_{s}/R_{eq}$
and
 $t_{p}$
with the Atwood number
 $At$
. Increasing
 $At$
, i.e. increasing the density contrast between fluid ‘1’ and fluid ‘2’, increases the drainage rate due to the increase in the effective gravitational force. This, in turn, speeds up the drainage, as well as the thinning of the neck, and decreases the pinch-off time of the satellite drop, as evident in figure 8(b). It can be argued that although increasing
 $At$
increases the drainage rate, a decrease in the pinch-off time decreases the total drainage, leading to the increase in the satellite drop volume, as evident in figure 8(a). Although the drainage is faster at higher
 $At$
due to the stronger effective gravitational force, the penetration of the bubble into the liquid pool decreases with increasing
 $At$
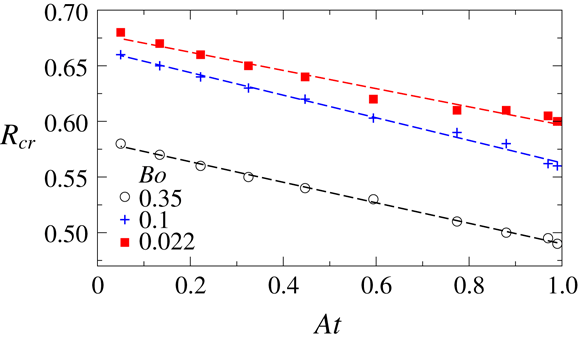
because of higher buoyancy force acting on the bubble. As a result the critical radius ratio,
 $R_{rc}$
, decreases with increasing
 $At$
, as evident in figure 9, where the variation of
 $R_{cr}$
with
 $At$
is shown for three different values of
 $Bo$
. Inspection of figure 9 reveals that for a fixed
 $At$
, as expected, increasing
 $Bo$
(decreasing the surface tension over gravitational force) decreases the value of
 $R_{cr}$
. We observe (not shown) that increasing
 $Oh_{1}$
and
 $Oh_{2}$
has a negligible effect on the critical radius ratio,
 $R_{cr}$
, for the range of parameters considered.
The variations of the critical radius ratio,
 $R_{cr}$
, with
 $At$
for different values of
 $Bo$
. The dashed lines indicate linear fits to the data points.

4 Concluding remarks
The partial coalescence dynamics of a compound drop in a liquid pool is investigated via axisymmetric numerical simulations using an open source VoF-based flow solver, Gerris. The effect of the radius ratio
 $(R_{r})$
of the compound drop while maintaining a constant liquid volume in the outer shell is studied. We observed that for small
 $R_{r}$
, the partial coalescence dynamics is similar to that of a ‘simple’ drop. However, for the parameters considered, the partial coalescence is suppressed above a critical radius ratio as the inner bubble remains near the free surface and thereby prevents the inward movement of the neck. Three different types of coalescence have been observed for different values of
 $R_{r}$
: (i) pinch-off of a satellite drop without bursting of the bubble, (ii) pinch-off of a satellite drop along with bursting of the bubble, and (iii) bubble bursting before the pinch-off. A parametric study is conducted by varying other dimensionless numbers, such as the Atwood and the Bond numbers, to identify the critical radius ratio,
 $R_{cr}$
, above which partial coalescence is suppressed. The location of the inner bubble in the pool is found to play an important role in the pinch-off process.