I. INTRODUCTION
Excellent chemical to electrical conversion efficiency,Reference Atkinson, Barnett, Gorte, Irvine, McEvoy, Mogensen, Singhal and Vohs1 fuel flexibility,Reference Park, Vohs and Gorte2 and relatively high power outputReference Shao, Haile, Ahn, Ronney, Zhan and Barnett3 make solid oxide fuel cells (SOFCs) a viable alternative resource to help alleviate increasing global energy demands. To ensure reaction efficiencies and sufficient electrolyte ionic conductivity, SOFCs typically operate in a temperature range of 500–1000 °C, which leads to high degradation rates and slow startup times.Reference Han, Liu, Zeng, Qian, Wu and Zhan4 One crucial limitation hindering the reduction of operating temperature is the low ionic conductivity of the electrolyte at lower temperatures. Yttria-stabilized zirconia (YSZ) is the most popular electrolyte ceramic owing to its pure oxygen ion conduction over very broad temperature and oxygen partial pressure rangesReference Etsell and Flengas5 as well as the low cost of manufacturing the material. A maximum conductivity value of 10−1 S/cm is observed for bulk YSZ at a temperature as high as 1000 °C.Reference Goodenough6−Reference Fergus8 In recent years, significant effort has focused on reducing the operating temperature of SOFCs through either the use of ultra-thin electrolyte structuresReference Garcia-Barriocanal, Rivera-Calzada, Varela, Sefrioui, Iborra, Leon, Pennycook and Santamaria9,Reference Huang, Nakamura, Su, Fasching, Saito and Prinz10 or utilizing alternative oxide ion conductors with higher conductivity.Reference Li, Pietrowski, Souza, Zhang, Reaney, Cook, Kilner and Sinclair11–Reference Xia and Liu13
Improving the fundamental understanding of conductivity variance at size scales approaching the mesoscale and nanoscale requires local characterization of electrolyte activity under operating conditions. In situ characterization techniques such as current–voltage (I–V) measurement, electrochemical impedance spectroscopy (EIS), and ambient-pressure x-ray photoelectron spectroscopy (APXPS) are powerful for investigating the performance of fuel cell devices under operating conditions. I–V measurements generally provide quantitative descriptions of overall fuel cell performance rather than separating the various loss contributions individually.Reference O'Hayre, Cha, Colella and Prinz14 Spectroscopic EIS differentiates all the major loss components within an operating fuel cell, which include reaction kinetics, internal resistance, and concentration polarization contributions.Reference Nielsen and Hjelm15 Use of operando or in situ APXPS has successfully demonstrated the ability to measure the chemical and electrochemical properties in operating solid oxide electrochemical cells, albeit with limited spatial resolution (∼20 μm) confined to one dimension,Reference Zhang, Grass, McDaniel, DeCaluwe, Gabaly, Liu, McCarty, Farrow, Linne, Hussain, Jackson, Bluhm and Eichhorn16 and are thus incapable of characterizing nanostructured electrolytes with reduced feature sizes less than 100 nm.Reference Garcia-Barriocanal, Rivera-Calzada, Varela, Sefrioui, Iborra, Leon, Pennycook and Santamaria9 Additional limitations of APXPS are imposed by its vacuum system, with a maximum pressure of ∼100 Torr of O2 reported thus far,Reference Kaya, Ogasawarab, Näslundb, Forsellc, Casalongue, Miller and Nilsson17 below true ambient pressure.
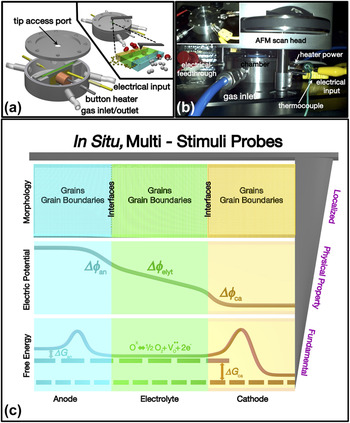
Closing the gap between theoretical kinetic models and in situ experimentation requires approaches capable of resolving physical and fundamental properties with high precision (nm) under dynamic operating conditions. Scanning probe microscopy (SPM) is a widely implemented technique, based on fundamental interactions between an atomically sharp tip and a sample surface to measure local physical properties such as electrochemical activity,Reference Kumar, Leonard, Jesse, Ciucci, Eliseev, Morozovska, Biegalski, Christen, Tselev, Mutoro, Crumlin, Morgan, Shao-Horn, Borisevich and Kalinin18,Reference Kumar, Jesse, Morozovska, Eliseev, Tebano, Yang and Kalinin19 electrical properties,Reference Hou, Nonnenmann, Qin and Bonnell20 and elastic properties.Reference Cappella and Dietler21 To date, the majority of SPM studies related to energy material systems have been conducted under ambient pressures,Reference Kumar, Leonard, Jesse, Ciucci, Eliseev, Morozovska, Biegalski, Christen, Tselev, Mutoro, Crumlin, Morgan, Shao-Horn, Borisevich and Kalinin18,Reference Zhu, Lu and Zeng22,Reference Saive, Scherer, Mueller, Daume, Schinke, Kroeger and Kowalsky23 while developments of in situ probing under operating temperatures remain largely underexplored.Reference Broekmaat, Brinkman, Blank and Rijnders24,Reference Hansen, Wu, Jacobsen, Mogensen and Kuhn25 Previous attempts utilized heavily modified instrumentation to demonstrate high temperature topographic imaging (500 °C)Reference Broekmaat, Brinkman, Blank and Rijnders24 and local, one-terminal conductivity imaging (750 °C).Reference Hansen, Wu, Jacobsen, Mogensen and Kuhn25Figure 1 highlights our contribution in realizing in situ, multi-stimuli probes of high temperature electrochemical processes. We previously designed and developed a miniaturized environmental sample chamber outfitted with a heating element and various electrical and gaseous feedthroughs [Fig. 1(a)]. The chamber, as configured, therefore combines realistic operating pressures and temperatures with the ability to electrically induce electrochemical processes; when integrated with a commercial AFM system [Fig. 1(b)],Reference Nonnenmann and Bonnell26 this subsystem thus enables imaging of active SOFC cross-sections. Our recent study demonstrated direct in situ probing of charge transfer processes across active (T = 600 °C) SOFC electrode–electrolyte interfaces with sub-100 nm spatial resolution.Reference Nonnenmann, Kungas, Vohs and Bonnell27 These advancements in AFM instrumentation usher in an exciting family of in situ, multi-stimuli probes [Fig. 1(c)], capable of locally observing material-specific properties ranging from morphological features [grains, grain boundaries; Fig. 1(c), top] to physical properties [electric potential gradients; Fig. 1(c), middle]. Significantly, systematic studies utilizing such probes extend the abilities of AFM to include the collection of information related to fundamental properties such as activation energy [Fig. 1(c), bottom]. Here we demonstrate direct imaging of localized potential gradients along the direction of ionic charge transport within YSZ electrolytes at varying operating temperatures. Using simultaneously collected current density values, we subsequently calculated the local ionic conductivity of YSZ electrolyte as a function of temperature and compare it with recently reported macroscopic YSZ electrical properties.Reference Goodenough6,Reference Yeh, Hsu and Chou28,Reference Han, Tang, Yin and Peng29
(a) A schematic illustration of the miniature environmental chamber, shown complete with various gaseous inlet/outlets, electrical feedthroughs, thermocouple, and button heater; inset: schematic illustration of the chamber while in operation, shown with tip approaching the access port to resolve electrochemical phenomena in a cross-sectional geometry. (b) Digital photograph of the chamber, under operation, as integrated with a commercial (Asylum Research MFP-3D) AFM scan head; inset: digital photograph of the chamber with the scan head removed. (c) An illustrated overview of in situ, multi-stimuli probes to collect localized information of properties ranging from morphological (top) and physical (electric potential perturbations; middle) to fundamental parameters such as activation energy (ΔG; bottom). Figures (a) and (b) are reproduced with permission from S.S. Nonnenmann and D.A. Bonnell: Miniature environmental chamber enabling in situ SPM within reactive environments. Rev. Sci. Instrum. 84, 073707. Copyright 2013, AIP Publishing LLC (http://dx.doi.org/10.1063/1.4813317).

II. EXPERIMENT
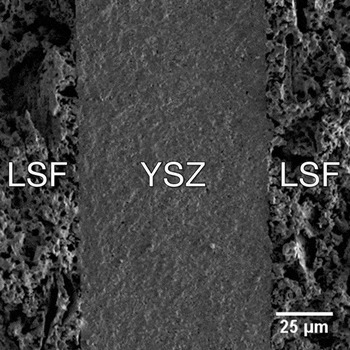
This study used lanthanum strontium ferrite (LSF)/YSZ/LSF symmetrical cells prepared by an infiltration method.Reference Vohs and Gorte30 Briefly, green tapes prepared by mixing 8 mol% YSZ powder (TZ-8Y, Tosoh Corp., Japan), distilled water, and binders were cut into discs (d = 1.2 cm), hot-pressed into a laminate, then sintered at 1773 K. Fabricating the porous YSZ electrode matrix required the inclusion of a synthetic graphite pore former and a subsequent sintering step, resulting in a porous structure. The infiltration process to complete the LSF–YSZ composite electrode made use of an aqueous solution containing La, Sr, and Fe nitrate salts in a 0.8:0.2:1 molar ratio, respectively. Further details and structural characterization are found elsewhere.Reference Küngas, Vohs and Gorte31–Reference Küngas, Yu, Levine, Vohs and Gorte34 The composite electrodes possessed a porosity of approximately 40 vol%, determined via the Archimedes method. Figure 2 shows the porous–dense–porous structure of the LSF–YSZ–LSF cell, with a porous electrode thickness of 50 μm and an electrolyte thickness of 80 μm, respectively. Each electrode received a conductive silver paste coating (SPI, 0503-AB) which was used for external current collection. Cross-sectional samples for in situ AFM analysis were prepared by first cutting with a diamond saw (Buehler IsoMet Low Speed Saw, Buehler, ITW Company, Lake Bluff, IL), mounting onto a cross-sectional polishing mount using wax (EMS, Crystalbond 509) and then mechanically polishing flat (Allied, TechPrep 8).
A cross-sectional view scanning electron microscopy image of a fabricated LSF–YSZ symmetrical SOFC, shown here with a dense, 80 μm thick YSZ electrolyte layer sandwiched between two, 50 μm LSF–YSZ porous composite electrodes.

A commercial AFM (Asylum Research MFP-3D; Santa Barbara, CA) was utilized to perform variable temperature scanning surface potential microscopy (SSPM). Here, a conductive tip (Rocky Mountain Nanotech 25Pt400B, f ≈ 12 kHz, Rocky Mountain Nanotechnology, LLC, Salt Lake City, UT) collected topographic images in noncontact mode on its first pass. A subsequent pass was then performed under an AC bias (3 VAC) using a lock-in amplifier to detect longer range electrostatic forces between the tip and sample. A feedback loop then applied a dc bias to compensate the contact potential difference between the tip and sample surface which governs the electrostatic force, creating an image of the surface potential of the sample.
To achieve the intermediate temperature range benchmark between 500 and 600 °C necessary to induce the ionic conductivity of YSZ, the heating element was calibrated using two thermocouples: one internal chamber thermocouple integrated within the button heater provided feedback to the proportional-integral-derivative (PID) temperature controller (Heatwave Labs Inc. 101303-21, Watsonville, CA); another external thermocouple placed in direct contact with the edge of the sample recorded the sample temperature. Calibrated applied thermal loadsReference Nonnenmann and Bonnell26 provided sample heating to 500, 550, and 600 °C. At temperature, a Δ1V bias was applied across the cross-section sample against a grounded electrode by a function generator (HP33120A) to induce electrochemical transduction, where a multimeter (Keithley 6517A, Keithley, a Tektronix Company, Cleveland, OH) connected in series measured the current across the sample. The normal scanning duration was 15 min and currents were recorded every minute for the duration and averaged. We previously demonstrated reversed bias conditions across SOFC components in these prior studies.Reference Nonnenmann and Bonnell26,Reference Nonnenmann, Kungas, Vohs and Bonnell27
EIS measured the impedance arcs to validate the macroscopic electrolyte performance of the symmetric cell. Prior to testing, the electrodes were painted with Ag current collectors and then had Ag lead wires attached. The electrode active area was 0.35 cm2. A furnace maintained a sample temperature of 600 °C during all data collection. Impedance spectra were recorded with a Gamry Instruments potentiostat (Warminster, PA) in the frequency range of 240 kHz to 0.05 Hz.
III. RESULTS AND DISCUSSION
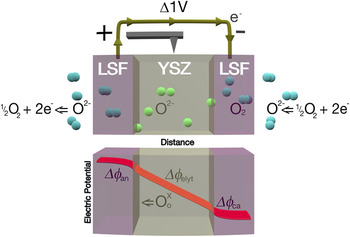
The theoretical internal electric potential profile across a typical SOFC is illustrated in Fig. 3.Reference Bessler, Gewies and Vogler35 The linear decrease within electrolyte potential demonstrates that the resistance displays ohmic behavior. The conductivity can therefore be calculated via the following equation:
 $$\sigma = {J \over E}\quad {\rm{,}}$$
where J is current density; E is the internal electric field and equals the slope of the potential decrease.
(Top) A schematic illustration of symmetric SOFC operation, shown with half-reactions; (bottom) the electric potential distribution profile across the SOFC cross-section, under bias.

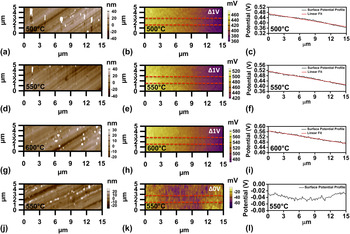
The local potential loss gradients were collected by SSPM imaging within the miniature environmental chamber under operating conditions. The topography image of the dense YSZ electrolyte [Figs. 4(a), 4(d), and 4(g)] and the corresponding surface potential images [Figs. 4(b), 4(e), and 4(h)] were collected with the cell exposed to air at 500, 550, and 600 °C. The line profiles along the charge transfer direction [Figs. 4(c), 4(f), and 4(i)] were extracted from the surface potential images. By performing a linear fit to the profiles, the internal electric fields, E, were revealed. The coefficients of determination, R 2, of the linear fit of the profiles are 0.97, 0.98, and 0.98, respectively, thus demonstrating strong ohmic character within the ionic electrolyte. To further validate that the potential gradient results from anionic oxygen diffusion, we measured the surface potential of the YSZ electrolyte without an applied bias under 550 °C [Figs. 4(j)–4(l)]. Here small local potential variations are observed in Fig. 4(k), with overall potential values in the range of −40 ± 20 mV. The relatively flat potential profile [Fig. 4(l)] across the electrolyte further confirms that there is no anionic oxygen diffusion across the electrolyte.
(a, d, g) Topography images of dense YSZ and corresponding (b, e, h) surface potential images collected under 500, 550, 600 °C; Δ1V bias applied. (c, f, i) Black lines are surface potential profiles average over 20 lines between the red dotted lines in (b, e, h); the red lines are linear fitting results. (j–l) Topography and surface potential images as well as the surface potential profiles of the dense YSZ measured under 550 °C; Δ0V bias applied.

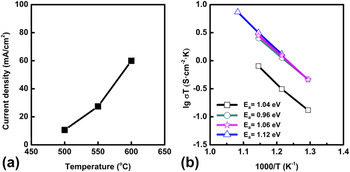
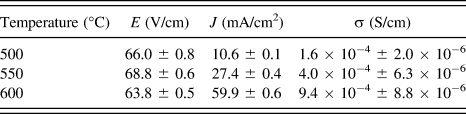
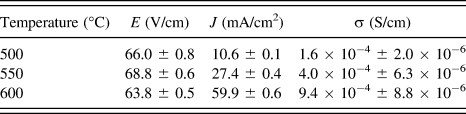
Macroscopic current measurements were conducted under different operating temperatures and the current density was calculated by dividing the current value by the geometric surface area of the sample electrode. The current density versus sample temperature is plotted in Fig. 5(a). Because YSZ is a pure ionic conductor, the current density value observed here (J ≥ 10.6 mA/cm2) results from anionic oxygen diffusion across the electrolyte, which indicates that electrochemical half-cell reactions are occurring at both electrodes as well. Values of E, J, and calculated conductivity σ are summarized in Table I. The standard deviation of E, J, and σ demonstrated in the table are 2 orders of magnitude lower than the mean value.
(a) Current density versus sample temperature. (b) Arrhenius plot of YSZ conductivity versus temperatures. □ is the data collected by our group; ○ (Ref. Reference Goodenough6), ☆ (Ref. Reference Yeh, Hsu and Chou28), Δ (Ref. Reference Han, Tang, Yin and Peng29) are data from literature; activation energies E a based on the slope of the plots are listed in the image.

Values of E, J, and σ under various temperatures.
The temperature dependence of electrolyte conductivity can be expressed in the form of a modified Arrhenius equationReference Hui, Roller, Yick, Zhang, Decès-Petit, Xie, Maric and Ghosh36:
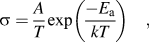 $$\sigma = {A \over T}\exp \left( {{{ - {E_{\rm{a}}}} \over {kT}}} \right)\quad {\rm{,}}$$
where σ is the ionic conductivity, T is the absolute temperature, A is pre-exponential constant, and E a is the activation energy. Therefore, the linear relationship between log σT and 1/T yields a slope proportional to the activation energy. Figure 5(b) shows the plots of log σT versus 1/T, as calculated from the collected SSPM measurements. Due to the low standard deviation of calculated conductivity, the error of activation energy obtained from the slope is trivial.
The activation energy E a values observed are in accordance with other reported data as shown in Fig. 5(b).Reference Goodenough6,Reference Yeh, Hsu and Chou28,Reference Han, Tang, Yin and Peng29 The slight variation of activation energy is due to the difference in yttria doping concentration. The activation energy of YSZ increases at higher Y2O3 doping concentrations in ZrO2 owing to the higher-energy barrier for oxygen vacancy diffusion across an Y–Y common edge relative to diffusion across one with a Zr–Y common edge of two adjacent tetrahedra.Reference Pornprasertsuk, Ramanarayanan, Musgrave and Prinz37 The YSZ composition (8 mol% yttria) used in this study is identical to that used in the work of Yeh et al.,Reference Yeh, Hsu and Chou28 here denoted in pink (☆). Consequently, the calculated activation energies based on these two plots are 1.04 and 1.06 eV, respectively, displaying strong agreement. The YSZ ceramic in the review paper by GoodenoughReference Goodenough6 (O) is Zr0.91Y0.09O1.955, which corresponds to 4.7 mol% yttria. The lower activation energy, 0.96 eV, trends with the lower dopant concentration. Data presented by Han et al.Reference Han, Tang, Yin and Peng29 (Δ) did not specify the dopant mole percentage; based on the large activation energy (1.12 eV), however, an Y2O3 percentage higher than 8 mol% is expected.
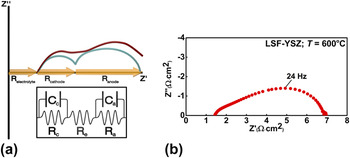
The local conductivity values obtained via SPM here are within an order of magnitude of those previously reported bulk values. To further validate SOFC operation within the symmetrical cells, EIS was performed to collect the bulk conductivity of the YSZ electrolyte. Figure 6(a) illustrates a typical EIS response (Nyquist plot) from an idealized/typical SOFC; the inset below shows the equivalent circuit modeling. The sizes of the two arcs are attributed to the magnitude of the anode and cathode activation losses, and the three x-axis intercepts defined by the arcs indicate three impedance regions, Relectrolyte, Rcathode, and Ranode. The focus in this study remains on the Relectrolyte, which represents the impedance loss from fuel cell electrolyte. The Nyquist plot collected at 600 °C for the symmetrical cell with LSF–YSZ electrodes is shown in Fig. 6(b). Because the electrodes on either side of the cell share the same structure and materials, the capacitors C c and C a [illustrated in the equivalent circuit modeling, bottom Fig. 6(a)] possess similar time constants τ. As a result, no clear separation between the two impedance arcs is observed here. The electrolyte contribution to the total area specific resistance (ASR), based on the plot, is 1.4 Ω cm2. Considering the thickness of the YSZ electrolyte here is 80 μm, the resistivity calculated equals approximately 180 Ω cm. Consequently, the conductivity obtained is 5.6 × 10⁻³ S/cm, which is within an order of magnitude of the SPM measured conductivity under 600 °C (0.94 × 10⁻³ S/cm).
(a) (Top) Example Nyquist plot of a typical (red) and idealized SOFC (green). (Bottom) Equivalent circuit modeling for a SOFC. (b) Nyquist plot of a (LSF)/YSZ/LSF symmetric cell collected at 600 °C.

The slightly lower ionic conductivity value obtained by SSPM is likely attributed to small, internal temperature gradients within the sample. Due to the cross-sectional sample geometry used during SSPM imaging, sample heating occurred on a single side, inevitably creating an internal temperature gradient. As a result, the side of the sample directly contacting the heater reached desired temperature, while the local surface measured possesses temperatures lower than the set point, thus causing the apparent vertical shift from other reported findings in which samples were heated uniformly by a furnace. Improving temperature uniformity throughout the whole sample warrants further study, likely in the form of a redesign for the miniature chamber which includes dual side heating to help minimize the internal temperature gradient and provide more precise SPM results.
IV. CONCLUSION
Through use of a customized miniature environmental chamber, we demonstrated in situ characterization of the potential gradient along the YSZ electrolyte surface under realistic, intermediate SOFC operating temperature as high as 600 °C. The calculated conductivity and activation energy values for YSZ are consistent with EIS measurements and previously reported values as measured by bulk techniques, which validates the performance of this technique within the operational regime. Combined with the high resolution inherent to SPM, these in situ studies open numerous opportunities to explore electrochemical and phase transition phenomena of various energy-based oxide material systems, at the nanoscale. Currently, the resolution limitation of the high-temperature AFM is restricted to 50 nm mainly due to the thermal drift induced by the confined accuracy of PID temperature controller. By applying a PID controller with higher accuracy in the future, we expect to see sub-20 nm features, which provides opportunities to investigate unprecedented physical phenomena in even smaller systems, such as the metal-oxide heterostructure interfaces.Reference Garcia-Barriocanal, Rivera-Calzada, Varela, Sefrioui, Iborra, Leon, Pennycook and Santamaria9
ACKNOWLEDGMENTS
C.R.P. and D.A.B. were partially supported from the Department of Energy Office of Basic Science DE-FG02-00ER45813-A000 to carry out this research. Facilities used at the Nano/Bio Interface Center were supported through the National Science Foundation NSEC DMR08-32802.