INTRODUCTION
Ixodid ticks are among the most prevalent vectors of human and animal pathogens (Jongejan and Uilenberg, Reference Jongejan and Uilenberg2004). Rhipicephalus sanguineus sensu lato (s.l.) and Rhipicephalus turanicus, both ixodid ticks, have been reported to feed on humans in Israel and the Palestinian Authority (Keysary et al. Reference Keysary, Eremeeva, Leitner, Din, Wikswo, Mumcuoglu, Inbar, Wallach, Shanas, King and Waner2011; Lalzar et al. Reference Lalzar, Harrus, Mumcuoglu and Gottlieb2012). They transmit a variety of important protozoal, bacterial and viral infectious agents (Walker, Reference Walker1998; Estrada-Peña and Jongejan, Reference Estrada-Peña and Jongejan1999; Walker et al. Reference Walker, Paddock and Dumler2008); and thus constitute a major public health concern (Dantas-Torres et al. Reference Dantas-Torres, Chomel and Otranto2012). They follow a three-host life cycle to include different-sized animals as hosts for each stage of their life cycle (Gray et al. Reference Gray, Dantas-Torres, Estrada-Peña and Levin2013).
Rickettsioses are zoonotic diseases caused by obligate, Gram-negative, intracellular bacteria that belong to the family Rickettsiaceae and associated with arthropod vectors (Raoult and Roux, Reference Raoult and Roux1997). Rickettsia spp. responsible for human diseases are traditionally separated into three main groups according to the disease symptoms they cause: the spotted fever group (SFG), the typhus group and the scrub typhus group (Rudakov et al. Reference Rudakov, Shpynov, Samoilenko and Tankibaev2003). Recently, a new classification was suggested according to the vector specificity: tick-borne rickettsioses (causing spotted fever), flea-borne rickettsioses (causing typhus) and unclassified Rickettsia parasitizing insects (Blanco and Oteo, Reference Blanco and Oteo2006; Karbowiak et al. Reference Karbowiak, Biernat, Stańczak, Szewczyk and Werszko2016). Mediterranean spotted fever (MSF), caused by Rickettsia conorii subspecies israelensis, is a well-acknowledged SFG-rickettsiosis in the Mediterranean basin (Walker et al. Reference Walker, Feng, Saada, Crocquet-Valdes, Radulovic, Popov and Manor1995; Zhu et al. Reference Zhu, Fournier, Eremeeva and Raoult2005). It presents mainly with a rash, flu-like symptoms, fever, headache, myositis, myalgia, arthralgia and splenomegaly (Mumcuoglu et al. Reference Mumcuoglu, Keysary and Gilead2002). As it may manifest with non-specific signs, it is frequently misdiagnosed. Children, elderly people and/or immunosuppressed individuals may succumb to a multi-systemic, life-threatening disease. When treated at early stages, the disease is usually responsive to tetracyclines (Mumcuoglu et al. Reference Mumcuoglu, Keysary and Gilead2002).
MSF has been reported to be the major tick-borne bacterial disease, affecting humans in Israel, the Palestinian Authority and other Middle East countries (Aharonowitz et al. Reference Aharonowitz, Koton, Segal, Anis and Green1999; Mumcuoglu et al. Reference Mumcuoglu, Keysary and Gilead2002; Ereqat et al. Reference Ereqat, Nasereddin, Al-Jawabreh, Azmi, Harrus, Mumcuoglu, Apanaskevich and Abdeen2016). Other SFG rickettsiae (SFGR), including Rickettsia massiliae, Rickettsia sibirica mongolitimonae and ‘Candidatus Rickettsia barbariae’ have recently been detected in ixodid ticks from Israel (Vitale et al. Reference Vitale, Mansuelo, Rolain and Raoult2006; Harrus et al. Reference Harrus, Perlman-Avrahami, Mumcuoglu, Morick and Baneth2011; Waner et al. Reference Waner, Keysary, Eremeeva, Din, Mumcuoglu, King and Atiya-Nasagi2014). The aims of the current study were to identify SFGR carried by questing ixodid ticks using molecular techniques, to assess their distribution throughout Israel, and to further assess the environmental variables that correlate with the presence and geographical distribution of the ticks and the rickettsiae.
MATERIALS AND METHODS
Tick collection
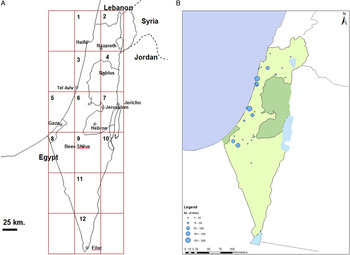
Questing ticks were collected randomly from 30 localities from 12 different study zones in Israel (Fig. 1A and B) from March to June 2014. The flagging technique was used to collect ticks, whereby a 1·00 m2 piece of white flannel cloth was dragged over low growing grass or shrubs. Ticks were removed from the flag using tweezers and put directly into 15 mL tubes containing 70% ethanol. In each of the study zone, 2–3 locations were chosen randomly. Collection sites were mainly agricultural or forest areas. Collection was controlled for area, timing during the day (morning) and period (2 h of flagging). All ticks were counted and labelled as per collection location, collector and date, and were separated according to sex. The ticks were identified using standard taxonomic keys (Feldman-Muhsam, Reference Feldman-Muhsam1951; Pegram et al. Reference Pegram, Clifford, Walker and Keirans1987; Walker et al. Reference Walker, Keirans and Horak2000) and stored at −20 °C until DNA extraction.
(A) Study zones (1–12) and (B) Tick collection sites. Circle size represents the number of ticks collected in each area.

DNA extraction from ticks
Ticks were removed from 70% ethanol storage and washed twice in phosphate-buffered saline (PBS) and transferred onto a dry clean glass microscope slide. DNA was extracted from each tick individually. Each tick was cut into four pieces using a sterile scalpel. The pieces were squeezed between two sterile, dry glass microscope slides for thorough mechanical separation of tissue from the exoskeleton. DNA was extracted from ticks using the Stratec RTP® Bacteria DNA Mini Kit (Stratec Biomedical, Berlin-Buch, Germany) according to the manufacturer's instructions for isolation of bacterial DNA from tissues. All DNA samples were tested for the amount and quality using nanodrop2000® (Thermo Scientific, Waltham, MA, USA); mean and s.d. DNA concentration of 62·2 ± 17·19 ng µL. DNA samples were stored at −20 °C until further use.
PCR amplification and sequencing
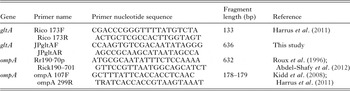
Detection of Rickettsia species in each tick was performed by screening tick-DNA samples individually using a real-time PCR assay targeting a 133-bp fragment of the citrate synthase gene (gltA) using primers rico173F and rico173R (Table 1; Harrus et al. Reference Harrus, Perlman-Avrahami, Mumcuoglu, Morick and Baneth2011). Reaction was carried out with an initial hold for 4 min at 95 °C, followed by 45 cycles of 5s at 95 °C, 30 s at 60 °C (fluorescence acquisition on the Green channel) and 1 s at 72 °C. The melting phase started from 60 to 95 °C, rising by 1 °C each step. Efficiency of the reaction was tested using serial dilutions of the positive control (efficiency = 106%, R 2 = 0·98, slope = 3·192). Positive samples, having the same melt temperature as the positive control (T m = 81 °C), were further analysed using real-time PCR targeting a 178–189-bp fragment of the outer membrane protein A gene (ompA) using primers 107F and 299R (Table 1; Kidd et al. Reference Kidd, Maggi, Diniz, Hegarty, Tucker and Breitschwerdt2008). Reaction was carried out with an initial hold for 4 min at 95 °C, followed by 45 cycles of 5 s at 95 °C, 30 s at 56 °C (fluorescence acquisition on the Green channel) and 6 s at 72 °C. The melting phase started from 60 to 95 °C, rising by 1 °C each step. Positive samples were considered those having the same melt temperature as the positive control (T m = 84·5 °C). All real-time PCR reactions carried out using the rotor gene 6000 cycler (Corbett Research, Sydney, Australia), and performed in 20 µL total volume containing 4 µL of DNA, 1 µL of each primer (0·5 µ m final concentration), 0·6 µL of syto9 (Invitrogen, CA), 3·4 µL of double distilled water and 10 µL of Maxima Hot StartPCR Master Mix (Thermo Scientific, Loughborough, UK). All real-time PCR reactions were run in duplicates.
PCR primers used in this study to target rickettsial citrate synthase (gltA) and the outer membrane protein A (ompA) genes in Rhipicephalus spp. ticks collected from Israel

Samples that were positive for the ompA gene by real-time PCR were further analysed using a conventional PCR to detect and amplify a larger ompA gene fragment (632 bp) using primers Rr190·70p and Rick190–701 (Table 1; Roux et al. Reference Roux, Fournier and Raoult1996; Abdel-Shafy et al. Reference Abdel-Shafy, Allam, Mediannikov, Parola and Raoult2012).
Conventional PCR reaction was carried out with an initial hold for 5 min at 95 °C, followed by 35 cycles of 20s at 95 °C, 30 s at 51 °C and 1 min at 72 °C. A final extension of 5 min at 72 °C was performed. Conventional PCR was performed using high specificity-PCR-Readyᵀᴹ tubes (Syntezza, Jerusalem, Israel) in 25 µL total volume containing 1 µL of each primer (0·5 µ m final concentration), 4 µL DNA and 19 µL double distilled water. Conventional PCR was carried out using a programmable conventional thermocycler (Biometra, Goettingen, Germany). PCR products were run on 1·5% agarose gel using electrophoresis and ethidium bromide and visualized under UV light (ENDURO™-GDS, Labnet, USA).
A positive control (as described below), tick negative for rickettsial DNA, and a non-template control (water) were used in each run. Only samples that were positive both for the gltA and ompA were considered positive for SFGR-DNA.
Samples that were positive for ompA were purified using a PCR purification kit (Exo-SAP; New England BioLabs, Inc., Ipswich, MA) and subsequently sequenced with sense and antisense primers using BigDye Terminator cycle sequencing chemistry by Applied Biosystems ABI 3700 DNA analyser (Sanger) and evaluated by the ABI's data collection and sequence analysis software V5·4 (ABI, Carlsbad, CA) at The Center for Genomic Technologies (The Hebrew University, Jerusalem). Further analyses were done by Chromas (V2·6) (www.technelysium.com.au; technelysium pty, Woollahra, Australia) and MEGA6 (Tamura et al. Reference Tamura, Stecher, Peterson, Filipski and Kumar2013) software. Clean Sequences were compared with other sequences deposited in GenBank® using NCBI Blastn software (National Center for Biotechnology Information, Bethesda, MD). Sequences with identity between 97 and 100% and coverage above 99% were considered as positive for further analyses.
Construction of plasmids for positive controls
Positive controls used in this study were made by cloning partial fragments of the rickettsial gltA and the ompA genes into TOPO TA Cloning vector using TOPO TA Cloning® Kit (Thermo Fisher Scientific, MA) and transformation into the competent E. coli bacteria (BioSuper DH5α competent cells, Bio-Lab, Israel) according to the manufacturer's instructions. The fragments inserted into plasmids were created by a PCR reaction using DNA extracted from R. conorii subsp. israelensis cell culture (purchased from the Israel Institute for Biological Research, Israel) as a template and primers JPgltAF/JPgltAR and Rr190·70p/Rick190–701 (Roux et al. Reference Roux, Fournier and Raoult1996; Abdel-Shafy et al. Reference Abdel-Shafy, Allam, Mediannikov, Parola and Raoult2012), respectively (Table 1). Primers JPgltAF/JPgltAR were designed in this study to include 636 bp fragment of the gltA gene. Primers were designed using Primer BLAST version 3 from NCBI (https://www.ncbi.nlm.nih.gov/tools/primer-blast/) (Ye et al. Reference Ye, Coulouris, Zaretskaya, Cutcutache, Rozen and Madden2012) and used sequences AE006914·1 as template. Conventional PCR was performed using high specificity-PCR-Readyᵀᴹ tubes (Syntezza, Jerusalem, Israel) using a programmable conventional thermocycler (Biometra, Goettingen, Germany) in 25 µL total volume containing 1 µL of 0·5 µ m of each primer, 4 µL DNA and 19 µL double distilled water. Conventional PCR was carried out with an initial hold for 5 min at 95 °C, followed by 35 cycles of 30 s at 95 °C, 30 s at 58 °C and 1 min at 72 °C. A final extension of 5 min at 72 °C was performed. Success of cloning was assessed by conventional PCR using M13F (5′-GTAAAACGACGGCCAG-3′) and M13R (5′-CAGGAAACAGCTATGAC-3′) primers supplied by the manufacturer in the kit (Thermo Fisher Scientific, Waltham, MA, USA). Colony-PCR was performed using high specificity-PCR-Readyᵀᴹ tubes (Syntezza, Jerusalem, Israel) using a programmable conventional thermocycler (Biometra, Goettingen, Germany) in 25 µL total volume containing 1 µL of 0·5 µ m of each primer, and 19 µL double distilled water. Small amount from each colony was added using sterile tip as template. Conventional PCR was carried out with an initial hold for 5 min at 95 °C, followed by 25 cycles of 60 s at 95 °C, 60 s at 55 °C and 1 min at 72 °C. A final extension of 5 min at 72 °C was performed. Sequencing confirmed expected amplicon yields (identity and coverage: 100%) with respect to specific nucleotide sequences and size of PCR products. The plasmids were then extracted using the Promega PureYield™ Plasmid Miniprep System (Promega, Madison, WI, USA) according to manufacturer's instructions and stored at −20 °C.
Phylogenetic analysis
A phylogenetic analysis of the DNA sequences detected in this study was carried out to compare these DNA sequences to other Rickettsia spp. DNA sequences that had previously been deposited in GenBank. Representative sequences from the different rickettsia spp. detected in this studies and different collection location where chosen for constructing the phylogenetic tree. Sequences were aligned and analysed using the MEGA version 6.06 (http://www.megasoftware.net/; Tamura et al. Reference Tamura, Stecher, Peterson, Filipski and Kumar2013). ML (Model Selection) analysis was done using the MEGA6·06 software to assess the best-fit nucleotide substitution model. The model with the lowest BIC (Bayesian Information Criterion) scores was chosen and phylogenetic tree was constructed by the maximum-likelihood method based on the Tamura 3-parameter model (Tamura, Reference Tamura1992). Bootstrap replicates were performed to estimate the node reliability, and values were obtained from 1000 randomly selected samples of the aligned sequence data. Rickettsia canadensis (CP003304·1) was served as an outgroup.
Collection of environmental data
All tick collection sites were geo-referenced using a hand-held GPS device and values for the following environmental variables were collected for each collection site: precipitation (mL year−1), air temperature (degrees Celsius) in January, air temperature in August, relative humidity (percentage) in January and relative humidity in August. These extreme months were chosen as they represent the winter and summer coldest and warmest months of the year in Israel, respectively, and therefore best represent the climate in each location. All information used in the analysis was for the year of the tick collection (2014). The annual data were recorded by the Israeli Meteorological Service. In addition, geographic information system (GIS) layers for altitude [DEM (Digital Elevation Model – feet above sea level] and soil type were used. Soil-types were taken from the Erosion research station, Ministry of agriculture and classified according to standard international coding (Supplementary Table 1). Time series of data from the moderate resolution imaging spectroradiometer (MODIS) on board NASA's Terra (launched December 1999) and Aqua (launched May 2002) polar-orbiting satellites was used, offering the potential to capture environmental thermal and vegetation seasonality over land. The relevant terrestrial MODIS datasets were used by a GIS-based tool that was constructed accordingly. We retrieved the following environmental variables from MODIS for the year of collection (2014): normalized difference vegetation index, 250 m spatial resolution (NDVI), day-land surface temperatures at 1 km spatial resolution (LSTD) and night-land surface temperatures at 1 km spatial resolution (LSTN). For each variable the average, maximum, minimum and standard deviation values were recorded. A GIS layer was constructed for each variable.
ECOLOGICAL NICHE MODELLING
Data source
Environmental predictors for the ecological niche of ticks (or tick abundance) and SFGR-positive ticks in Israel included: climate, soil type, NDVI and LSTN. Only environmental factors that were statistically significantly associated with the presence of SFGR were chosen for the ecological niche model analysis. Climate predictors in the form of raster data with 1 km2 resolution were obtained from the WorldClim website (http://www.worldclim.org) – a commonly used interpolated global climate data resource for ecological modelling and GIS (Hijmans et al. Reference Hijmans, Cameron, Parra, Jones and Jarvis2005). WorldClim is a set of global climate data layers with multiple spatial resolution options from 18 to 1 km2. The WorldClim variables are smoothed maps of mean monthly climate data obtained from a variety of sources from 1950 through 2000 (Hijmans et al. Reference Hijmans, Cameron, Parra, Jones and Jarvis2005). Nineteen bioclimatic variables derived from monthly mean, minimum and maximum temperature, monthly precipitation and altitude were included in the analysis (Supplementary Table 1). However, bioclimatic variable 8–9 (Mean Temperature of Wettest Quarter and Mean Temperature of Driest Quarter) and 18–19 (Precipitation of Warmest Quarter and Precipitation of Coldest Quarter; Supplementary Table 1) were excluded due to known spatial artefacts in those four variables (Reeves et al. Reference Reeves, Samy and Peterson2015). Soil type, NDVI and LSTN were also used (data obtained as described above; Supplementary Table 1). The Raster package (Hijmans and van Etten, Reference Hijmans and van Etten2013) implemented in R statistical software (R Development Core Team, 2015) was used to convert all of the above environmental data layers into a common projection and map extent. Each raster was cropped, so that the geographical extent of the spatial analyses covered only Israel. Furthermore, scatter-plots were used to visually inspect for collinearity between each pair of environmental predictors. Finally, because the NDVI layer was at a different spatial scale (250 m) from other environmental variables (1 km2), we aggregated and resampled all of the environmental predictors to create a uniform raster stack with a final spatial resolution of 1·2 km2.
Ecological niche modelling
The probability distribution of suitable geographical locations for susceptible tick species and SFGR-positive ticks using two independent ecological niche models was predicted. The ‘presence–absence’ maximum entropy ecological niche modelling technique was used (Maxent) (Phillips et al. Reference Phillips, Anderson and Schapire2006) to identify the probability that a given geographic location is either suitable or not suitable for susceptible tick species and SFGR-positive ticks. The Maxent program version 3.3.3 was implemented as a function in Dismo package in R (Hijmans et al. Reference Hijmans, Phillips, Leathwick and Elith2013). This method has recently become popular for predicting spatial distribution of infectious diseases with both human and veterinary significance (Reeves et al. Reference Reeves, Samy and Peterson2015; Alkhamis and VanderWaal, Reference Alkhamis and VanderWaal2016; Alkhamis et al. Reference Alkhamis, Hijmans, Al-Enezi, Martínez-López and Perea2016). Furthermore, it has been widely used for predicting spatial distribution of disease vectors, including ticks (Illoldi-Rangel et al. Reference Illoldi-Rangel, Rivaldi, Sissel, Trout Fryxell, Gordillo-Pérez, Rodríguez-Moreno, Williamson, Montiel-Parra, Sánchez-Cordero and Sarkar2012; Scholte et al. Reference Scholte, Carvalho, Malone, Utzinger and Vounatsou2012; Quintana et al. Reference Quintana, Salomón, Guerra, De Grosso, Fuenzalida, Lizarralde De Grosso and Fuenzalida2013; Donaldson et al. Reference Donaldson, Pèrez de León, Li, Castro-Arellano, Wozniak, Boyle, Hargrove, Wilder, Kim, Teel and Lopez2016). The Maxent algorithm looks for and extracts associations between ‘presence–absence’ data and environmental variables in order to build ecological niche models. These ecological niche models use the extracted associations to characterize the environmental factors correlated with abundance of the species or disease agent, and subsequently deploy these associations to predict suitable geographical locations in non-sampled areas. We used the default logistic model, to ensure that the predictions gave estimates between 0 and 1 for the suitability per map cell, as well as default convergence threshold, regularization and number of iterations. Initially, separate purely bioclimatic Maxent models were fitted (which included only the 15 bioclimatic variables) to assess their association with susceptible tick abundance and SFGR-positive ticks. Thereafter, bioclimatic variables that had >10% relative contribution to the prediction were selected and included in the subsequent ecological niche models, along with the above non-bioclimatic predictors. Jack-knife tests were used to calculate the contribution of each environmental variable to the final model's prediction.
The performance of the candidate Maxent model was evaluated by partitioning the data into training and testing sets using the threshold-independent method. The threshold-independent method characterizes the performance of the model across the full range of possible probability thresholds for presence/absence predictions (Elith and Leathwick, Reference Elith and Leathwick2009). The k-fold partitioning scheme, which creates k partitions and randomly samples each of the five data partitions with replacement, was used, where each candidate Maxent model was tested five times (k = 5) against 10 000 randomly generated background points (pseudo-absences). Then the area under the curve (AUC) was calculated through a ROC (receiver operator characteristic) plot of the sensitivity (the proportion of true predicted known presences, known as omission error) vs 1 – specificity (proportion of false predicted known absences, known as commission error) over the whole range of threshold values between 0 and 1. The training set (train-AUC) was used for model building, while the testing sets (test-AUC) were used to evaluate model accuracy using the average value of the AUC calculated for each partitioned set. An AUC value of 0·5 represents an entirely random predictive model, while an AUC value of 1 represents a perfectly discriminating predictive model. Commonly, Maxent models with AUC values >0·75 for both training and testing data were usually considered reliably discriminating models (Soberon and Peterson, Reference Soberon and Peterson2005; Elith et al. Reference Elith, Graham, Anderson, Dudík, Ferrier, Guisan, Hijmans, Huettmann, Leathwick, Lehmann, Li, Lohmann, Loiselle, Manion, Moritz, Nakamura, Nakazawa, Overton, Townsend Peterson, Phillips, Richardson, Scachetti-Pereira, Schapire, Soberón, Williams, Wisz and Zimmermann2006).
Statistical analysis
SFGR-positive tick prevalence was compared between the different regions using the Fisher's exact test with Bonferroni correction. Univariable analyses were performed to assess associations between: (1) proportion of a specific tick spp. out of the total ticks collected at a certain location and environmental factors. (2) SFGR-positive tick prevalence and environmental factors. The Student's t-test and the χ 2 test were used for ordinal and nominal variables, respectively. Statistical analysis was performed using WinPepi V11·63 (Abramson, Reference Abramson2011) or SPSS® 21·0 software (IBM, Armonk, NY). Significant statistical difference was considered at P < 0·05.
RESULTS
Rickettsia spp. infection according to geographic regions
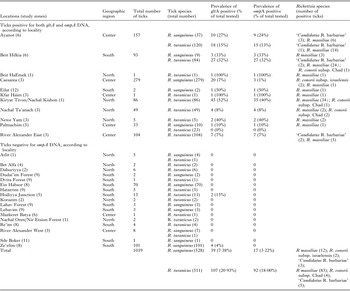
A total of 1042 questing adult ixodid ticks were collected from 30 locations in Israel during the months of March–June 2014 (Fig. 1B). Of them, 608 were females and 434 were males. All ticks were morphologically identified to the species level as follows: Rh. sanguineus s.l. (234 males and 294 females), Rh. turanicus (198 males and 313 females), Haemaphysalis adleri (two males) and unidentified Rhipicephalus sp. (one female). Only Rh. sanguineus s.l. and Rh. turanicus ticks were included in the analysis, while the two H. adleri and one Rhipicephalus sp. ticks were omitted, due to their low numbers. A total of 1039 Rhipicephalus spp. ticks were screened for rickettsial DNA (both gltA and ompA gene fragments). Table 2 shows the prevalence of each SFG-rickettsial sp. (PCR-positive) in Rh. sanguineus s.l. and Rh. turanicus ticks, in each region. The overall prevalence of Rickettsia-DNA in all tick samples was 10·49% (109/1039). 18·00% of the Rh. turanicus and 3·22% of the Rh. sanguineus s.l. ticks were positive for rickettsial DNA. The prevalence of infection of Rh. turanicus was significantly higher than Rh. sanguineus s.l. (P < 0·001). Prevalence was significantly higher in Rh. turanicus female (67/313, 21·41%) compared with male ticks (25/198, 12·63%; P < 0·05). On the other hand, there was no significant difference in the prevalence between Rh. sanguineus s.l. female (9/294, 3·06%) to male ticks (8/234, 3·42%; P = 0·8).
Prevalence of Rickettsia spp. in Ixodid ticks according to collection sites in Israel

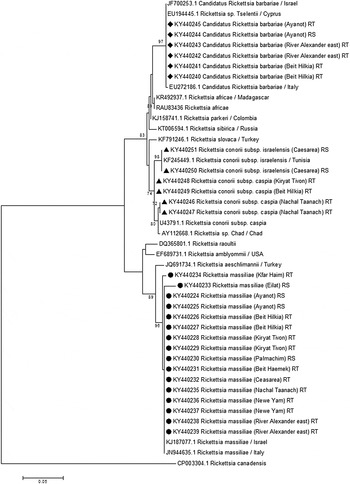
All sequences detected in this study had 99–100% identity and above 99% coverage to the following Rickettsia spp.: R. massiliae (95/109; GenBank accession KR401146) ‘Candidatus Rickettsia barbariae’ (8/109; EU272186·1, JF700253·1), R. conorii subsp. israelensis (2/109; KF245449·1) and R. conorii subsp. Chad (4/109; AY112668·1). R. massiliae was the predominant spp. (95/109). A phylogenetic analysis based on ompA sequences was performed to show the genetic relationships and similarities between the Rickettsia spp. found in this study to other sequences deposited in GenBank (Fig. 2). Sequences that were used for phylogenetic analysis were deposited in GenBank, accession no. KY440224-KY440251.
A maximum-likelihood phylogenetic tree based on 433 bp DNA partial sequence of the ompA gene comparing sequences obtained in this study (accession no. KY440224–KY440251) and other Rickettsia spp. sequences deposited in GenBank. The evolutionary history was inferred by using the maximum-likelihood method based on the Tamura 3-parameter model. The tree with the highest log likelihood (−1434·9549) is shown. The percentage of trees in which the associated taxa clustered together is shown next to the branches. Initial tree for the heuristic search was obtained automatically by applying Neighbour-Join and BioNJ algorithms to a matrix of pairwise distances estimated using the maximum composite likelihood approach, and then selecting the topology with superior log likelihood value. A discrete Gamma distribution was used to model evolutionary rate differences among sites [five categories (+G, parameter = 0·5071)]. The tree is drawn to scale, with branch lengths measured in the number of substitutions per site. The analysis involved 45 nucleotide sequences. All positions with less than 95% site coverage were eliminated. That is, fewer than 5% alignment gaps, missing data, and ambiguous bases were allowed at any position. There were a total of 433 positions in the final dataset. Evolutionary analyses were conducted in MEGA6. Bootstrap replicates were performed to estimate the node reliability, and values were obtained from 1000 randomly selected samples of the aligned sequence data. Bootstrap values higher than 70% are indicated. Sequences obtained in this study are indicated in circle for R. massiliae, diamond for ‘Candidatus R. barbariae'and triangle for R. conorii. Collection site and hosting tick species (RS for R. sanguineus s.l. and RT for R. turanicus) are indicated. GenBank reference sequences were used with their accession numbers, country of origin included (when known) for each sequence.

Ticks positive for SFGR-DNA were found in 11 of the 30 (36·66%) of the collection sites (in five out of the 12 zones tested). Rickettsia massiliae was found in every site where SFGR were present (11 locations), while R. conorii and ‘Candidatus Rickettsia barbariae’ were each found in only four of the 30 sites. The prevalence of SFGR was significantly higher in the North compared with the central and southern regions of Israel (42/158 (26·58%), 36/583 (6·17%) and 31/298 (10·40%), respectively, (Bonferroni-corrected P-value, P < 0·001), while no significant difference was found between the Centre and South of Israel. Prevalence of SFGR was higher in Rh. turanicus compared with Rh. sanguineus s.l. in the Centre and South of Israel (Centre: 23/250 Rh. turanicus vs 13/333 Rh. sanguineus s.l.; South: 27/107 Rh. turanicus vs 4/191 Rh. sanguineus s.l.), but not in the North (42/154 Rh. turanicus vs 0/4 Rh. sanguineus s.l. P = 0·204). Tick distribution on the coastal line, which includes areas from the North and Centre of Israel, was 55·70% (337/605) and 44·30% (268/605) for Rh. sanguineus s.l. and Rh. turanicus, respectively. Nine per cent of the Rh. turanicus in this area was positive to SFGR compare with 4% of the Rh. sanguineus s.l.
The effect of environmental variables on tick species and SFGR
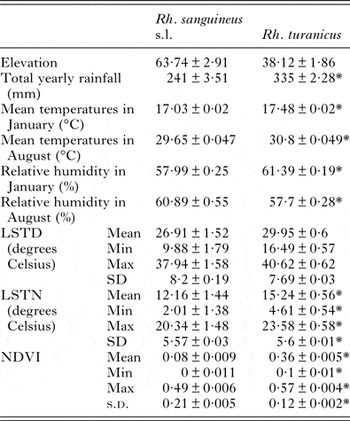
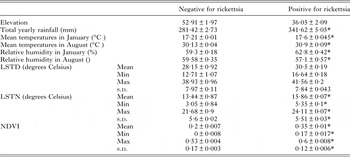
The univariable analysis revealed that the presence of Rh. turanicus ticks was significantly associated with yearly rainfall (P < 0·001), higher temperatures in January (P < 0·001) and August (P < 0·001), higher humidity in January (P < 0·001), lower humidity in August (P < 0·001), higher LSTN (P < 0·001) and higher NDVI (P < 0·001) compared with the presence of Rh. sanguineus s.l. (Table 3). The tick species was also found to depend on soil-type (P < 0·001). The prevalence of Rh. turanicus was higher in areas with brown soil-type, while Rh. sanguineus s.l. ticks were associated with alluvial and desert soils. Presence of SFGR was associated with higher total yearly rainfall amounts (P < 0·001), higher temperatures in January (P < 0·001) and August (P < 0·001), higher humidity in January (P < 0·001) and lower humidity in August (P < 0·001) higher LSTN (P < 0·001) and higher NDVI (P < 0·001) (Table 4). SFGR presence was also found to depend on soil-type (P < 0·001). Areas with brown soil-types contained 94·50% of all SFGR-positive ticks. This soil type was also found to be associated with the Rh. turanicus tick species (P < 0·001).
Association of environmental variables and tick species. Numbers represent average ± s.e. of the variable tested in the location where Rh. sanguineus s.l. was found compared with locations where Rh. turanicus was found

*Significant difference between the groups; P < 0·05.
Association between environmental variables and the presence of SFGR. Numbers represent Average ± s.e. of the variable tested in the location where SFGR was found compared to locations where no rickettsia was found

*Significant difference between the groups; P < 0·05.
Ecological niche modelling
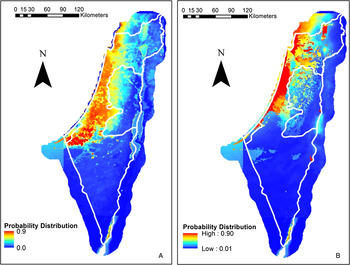
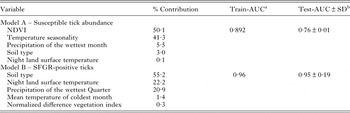
The Maxent model for susceptible tick and SFGR abundance was calculated using environmental factors that were found to be statistically significant in the univariate analysis. The Maxent model for susceptible tick abundance indicated that five of the selected environmental variables contributed to predict the probability of spatial distribution of susceptible tick species in Israel with train-AUCs and test AUCs of 0·892 and 0·76, respectively (Table 5). The two highest contributing environmental predictors for the presence of ticks (% contribution >40) included NDVI greater than 0·1 and temperature seasonality (temperature variation of 4·7 °C standard deviations over the course of the year; Table 5). Similarly, results of the final Maxent model for SFGR-positive ticks indicated that only five of the selected environmental variables were needed to adequately predict the probability of spatial distribution of infected ticks in Israel with a substantially higher and robust train and test AUCs of 0·96 and 0·95, respectively (Table 5). The three highest environmental predictors for the presence of infected ticks (% contribution >20) included colluvial/alluvial soil followed by the following soil types Mediterranean brown forest soil, brown red degrading sandy soil, Alluvial soil, annual mean LSTN < 15 °C and precipitation higher than 100 mm in the wettest quarter of the year (Table 5). The western part of Israel was identified as the most suitable geographical location for susceptible tick species with a spatial probability >0·7 (Fig. 3A) using the final tick abundance Maxent model. However, our final SFGR-positive tick Maxent model identified the northern and central areas of Israel as the most suitable locations for finding infected ticks with spatial probability >0·85 (Fig. 3B).
Predicted suitability maps using final Maxent models. (A) Predicted probability of spatial distribution for suitable locations for susceptible tick species in Israel. (B) Predicted probability of spatial distribution for suitable locations for SFGR-positive ticks in Israel.

Estimates of relative contributions of the environmental variables to each Maxent model and their validation in AUCs values

Model A represents susceptible tick abundance and model B – SFGR-positive ticks.
a Area under the curve.
b s.d. for the test-AUC.
DISCUSSION
This is the first comprehensive epidemiological study performed in Israel and the Palestinian Authority that aimed to assess the effect of environmental factors on the presence of SFGR and their tick hosts using spatial models. Israel and the Palestinian Authority are endemic for MSF caused by R. conorii subsp. israelensis (Mumcuoglu et al. Reference Mumcuoglu, Keysary and Gilead2002). Human rickettsioses caused by other tick-borne SFGR, either R. massiliae or ‘Candidatus R. barbariae’ have not been reported in Israel or the Palestinian Authority, to date. R. massiliae was the predominant Rickettsia species detected while R. conorii subsp. israelensis was rarely detected in ticks collected in this study. Higher prevalence of R. massiliae, as compared to the other SFGR, was also found recently in a study performed in the Palestinian territories (Ereqat et al. Reference Ereqat, Nasereddin, Al-Jawabreh, Azmi, Harrus, Mumcuoglu, Apanaskevich and Abdeen2016). As R. massiliae and R. conorii subsp. israelensis cause disease with similar clinical manifestations and sera from infected humans cross-react with the two Rickettsia spp. antigens (Parola et al. Reference Parola, Socolovschi and Raoult2009; Milhano et al. Reference Milhano, Popov, Vilhena, Bouyer, de Sousa and Walker2014) , it is possible that human rickettsiosis caused by R. massiliae in this region is more prevalent and may be misdiagnosed for R. conorii subsp. israelensis infection. Another possible explanation for our findings (as compared with previous reports) is that tick infection by Rickettsia spp. in this region is shifting towards R. massiliae due to drivers yet to be determined. Endogenous PCR targeting the tick's DNA was not performed in this study; therefore, we might have underestimated the prevalence of SFGR due to low rickettsial DNA concentration or the presence of PCR inhibitors.
Rickettsia conorii subsp. israelensis was shown to have a deleterious effect on Rh. sanguineus s.l. ticks (Levin et al. Reference Levin, Killmaster, Eremeeva and Dasch2009; Parola et al. Reference Parola, Socolovschi and Raoult2009) and low temperatures were shown to have a negative effect on the viability of Rh. sanguineus s.l. ticks naturally infected with R. conorii (Socolovschi et al. Reference Socolovschi, Gaudart, Bitam, Huynh, Raoult and Parola2012). The deleterious impact of R. conorii on tick hosts has been suggested in experimental models as a potential explanation for their low prevalence in nature (usually <1%). We also noted this low prevalence (0·58%), especially in contrast to the total SFGR presence. This may also explain the differences observed between the low prevalence of R. conorii found in this study and previous local studies conducted in Israel in the late 1990s (Guberman et al. Reference Guberman, Mumcuoglu, Keysary, Ioffe-Uspensky, Miller and Galun1996). Since R. massiliae was detected at a higher frequency (9·14%) it is likely that it is not (or is less) deleterious to its tick vector. Several studies have shown that Rhipicephalus ticks, have a higher prevalence of infection with R. massiliae than with R. conorii (Bacellar et al. Reference Bacellar, Regnery, Núncio and Filipe1995; Fernandez-Soto et al. Reference Fernandez-Soto, Perez-Sanchez, Alamo-Sanz and Encinas-Grandes2006; Márquez, Reference Márquez2008; Márquez et al. Reference Márquez, Rodríguez-Liébana, Soriguer, Muniaín, Bernabeu-Wittel, Caruz and Contreras-Chova2008) or are infected with only R. massiliae (Eremeeva et al. Reference Eremeeva, Bosserman, Demma, Zambrano, Blau and Dasch2006; Beeler et al. Reference Beeler, Abramowicz, Zambrano, Sturgeon, Khalaf, Hu, Dasch and Eremeeva2011; Chochlakis et al. Reference Chochlakis, Ioannou, Sandalakis, Dimitriou, Kassinis, Papadopoulos, Tselentis and Psaroulaki2012; Milhano et al. Reference Milhano, Popov, Vilhena, Bouyer, de Sousa and Walker2014). This may occur due to inter-species (rickettsial) competition within the tick vector. It is also possible that there has been a ‘recent’ switch from R. conorii to R. massiliae with respect to prevalence and disease, corresponding to Rh. turanicus tick prevalence. Since we found very high percentages of R. massiliae-infected Rh. turanicus ticks and it has been reported that both Rh. turanicus ticks and R. massiliae abundances have increased in certain other geographical regions such as Cyprus (Chochlakis et al. Reference Chochlakis, Ioannou, Papadopoulos, Tselentis and Psaroulaki2014), it might be that the overabundance of R. massiliae is due to intra-host pathogen competition. Rickettsia spp. are known to be competitive, and co-infections of more than one Rickettsia sp. within a single host is generally not found (Bacellar et al. Reference Bacellar, Regnery, Núncio and Filipe1995; Fernandez-Soto et al. Reference Fernandez-Soto, Perez-Sanchez, Alamo-Sanz and Encinas-Grandes2006; Márquez et al. Reference Márquez, Rodríguez-Liébana, Soriguer, Muniaín, Bernabeu-Wittel, Caruz and Contreras-Chova2008). Thus, it could be that R. massiliae has taken the lead over R. conorii from a ‘fitness’ point of view due to factors such as transmission capability, longevity in the vector due to immune modulation, or some other ability to prolong its within-host life. A comprehensive future study of MSF clinical cases using molecular identification of the Rickettsia spp. involved should be performed in order to test this theory. If R. massiliae is less virulent than R. conorii, then it would be expected that fewer detectable cases of MSF (caused by R. conorii subsp. israelensis) would have occurred in the past recent years (Levin et al. Reference Levin, Zemtsova, Montgomery and Killmaster2014). It would make sense that a less virulent Rickettsia sp. would be less harmful to its host as well. From an immunological and parasitological standpoint, a pathogen would be ‘smart’ to ensure longevity in terms of survival within its host. It is well known that many bacteria have immuno-modulatory mechanisms to evade destruction of the host to ensure their survival.
A high percentage of ticks infected with R. massiliae were found in Rh. turanicus ticks females. Since both R. conorii and R. massiliae are transmitted transovarially, one would expect all their offspring to be infected as well. 100% transovarial transmission rates have been reported for these rickettsiae (Matsumoto et al. Reference Matsumoto, Ogawa, Brouqui, Raoult and Parola2005; Brumin et al. Reference Brumin, Levy and Ghanim2012). In the case of R. massiliae, it is understandable how its prevalence would increase exponentially, if it is not detrimental to its host. The reproductive rate in Rh. turanicus is almost twice as that of Rh. sanguineus s.l. and is facilitated by the greater amount of blood engorged by female Rh. turanicus and a smaller weight (size) of eggs, as compared with Rh. sanguineus s.l. (Ioffe-Uspensky et al. Reference Ioffe-Uspensky, Mumcuoglu, Uspensky and Galun1997).
The strong association between geographical location, as defined by typical environmental variables and tick species suggests that these environmental variables are indicators for tick hosts. Rh. turanicus seems more likely to be found in areas at sea level with high-temperature, high precipitation, and high vegetation index. Similar patterns of statistically significant differences between independent variables, both quantitative and categorical, between tick species and SFGR presence were observed. It seems that the environmental variables are more likely to influence the tick species than the Rickettsia species itself, or indirectly influencing the SFGR epidemiology. It is quite clear that environmental variables affecting the ticks may influence SFGR prevalence as they play a significant part of the bacterial transmission and maintenance. However, the ecological niche model determined different relative contribution of the environmental predictors for the presence of ticks and the presence of SFG-rickettsia positive ticks. Hence, there is a special contribution of specific environmental factors; i.e. LSTN, soil type and precipitation of the wettest quarter, to the presence of SFGR within areas that are most likely to have ticks. Our findings suggest a greater effect of vegetation and temperature variation on the presence of ticks. Vegetation has a great impact on the local environment. A biotope with vegetation that could imbibe moisture will provide shelter, protection and food sources for different animals that can serve as a food source for the ticks. Vegetation can also provide a moist environment for the ticks themselves (Estrada-Peña et al. Reference Estrada-Peña, Ayllón and de la Fuente2012). More knowledge on the distribution of different animal species in Israel can help in better understanding their effect on tick distribution. Some other tick species are known to seek high humidity, but there is no such information regarding Rhipicephalus spp. ticks (Barandika et al. Reference Barandika, Olmeda, Casado-Nistal, Hurtado, Juste, Valcárcel, Anda and García-Pérez2011). Climate conditions affect tick development and survival. In general, the lower the temperature, longer the developmental cycle and higher the tick mortality are. Some tick species have unique mechanisms that allow them survive in higher temperatures (Estrada-Peña et al. Reference Estrada-Peña, Ayllón and de la Fuente2012). Adjustment to variable temperatures may allow increased tick survival. SFGR were more likely determined by the soil type, LSTN and precipitation of the wettest quarter. Presence of SFGR will be more likely in the central and northern parts of Israel. The relative contribution of NDVI to the presence of SFGR however, was low. The effect of the presence of SFGR in the tick on the tick adjustment to the environment is unclear. Previous studies showed the association between the presence of tick-borne pathogens and the adjustment of the host to variable climate conditions, heterogeneous host availability, water stress and tick development (Ogden et al. Reference Ogden, Lindsay, Beauchamp, Charron, Maarouf, O'Callaghan, Waltner-Toews and Barker2004; Randolph, Reference Randolph2009; Barandika et al. Reference Barandika, Olmeda, Casado-Nistal, Hurtado, Juste, Valcárcel, Anda and García-Pérez2011). Other studies showed that changes in environmental conditions influence host infectivity and parasite virulence as well as its titre in the tick (Weinman and Ristic, Reference Weinman and Ristic1986).
Concluding remarks
Rickettsia massiliae was the most prevalent Rickettsia sp. detected in this study (number and distribution) and was primarily found in Rh. turanicus ticks, rather than Rh. sanguineus s.l. The presence of SFGR was associated with higher LSTN, brown soil type, and higher precipitation at the wettest quarter. The model analysis results suggest that once a tick is present in a specific geographical area, the latter specific environmental conditions are additional requirements for the tick to carry (or probably maintain) SFGR. The areas of Central and Northern Israel were found to be more susceptible to SFGR. Physicians, public health workers and ecologists should be made aware of these findings and more definitive diagnostic methods, including molecular methods, should be made with intent to associate the Rickettsia species to specific clinical manifestations.
ACKNOWLEDGEMENT
The authors acknowledge the Dutch Ministry of Foreign Affairs, The Dutch Friends of the Hebrew University and the USAID-MERC for their support.
FINANCIAL SUPPORT
This study was supported by funds from the USAID MERC program grant no. TA-MOU-12-M32-038, and grant 2014·52146 from the Netherlands Ministry of Foreign Affairs, The Hague, Netherlands.
CONFLICT OF INTEREST
None.
SUPPLEMENTARY MATERIAL
The supplementary material for this article can be found at https://doi.org/10.1017/S0031182017000336