Implications
Feeding and management for buffalo meat production have to be simple, economical and adequate to solve the related ethical issues while securing high quality meat. The increment of the level of maize silage from 10% to 36% dry matter in diet fed to fattening buffaloes and the increase of group size from 7 to 14 animals did not influence growth rate, digestibility and carcass traits. Meat quality was not influenced by dietary level of maize silage. Farmers can choose the quantity of dietary maize silage to include in diet for fattening buffaloes and a group size ranging from 7 to 14 heads, without affecting their growth performance and welfare.
Introduction
Water buffalo (Bubalus bubalis) farming is a traditional activity that has been established in specific central and southern areas of Italy where it plays a major role in agriculture economy (De Rosa et al., Reference De Rosa, Grasso, Braghieri, Bilancione, Di Francia and Napolitano2009). Buffalo milk is almost entirely used to produce mozzarella cheese, one of the most typical products of southern Italy. Due to the market popularity of mozzarella, buffalo farming is almost exclusively focused on milk production. As a consequence, apart from the fraction used for breeding purposes, the greatest part of male calves are unwanted because they have low economic value since historically there has been a very limited market for buffalo meat, although several studies have highlighted its high-quality standards (e.g. Di Luccia et al., Reference Di Luccia, Satriani, Barone, Colatruglio, Gigli, Occidente, Trivellone, Zullo and Matassino2003) which are comparable to beef. In recent years, a number of buffalo dairy farms, to increase their productivity and make their farming economically sustainable, have introduced specific facilities to use male calves as meat producer. In addition, there are also a small number of large-scale facilities collecting male calves from different farms. The success of both systems requires animal feeding and management to be simple, economical and adequate to solve the related ethical issues while securing quality of meat. In this regard, there has been an increased interest in simplifying feeding routines in buffalo meat farming by the use of total mixed rations (TMR) based on maize silage and the same feedstuffs used for lactating cows. Nevertheless, the quantity of maize silage to be fed during the finishing phase is controversial, due to existing but unproven concerns about its effects on meat quality (Keady et al., Reference Keady, Gordon and Moss2013).
In veal calves disease susceptibility may increase as a consequence of the social stress induced by a higher group size (Abdelfattah et al., Reference Abdelfattah, Schutz, Lay, Marchant-Forde and Eicher2015). In addition, the number of animals in the group may affect the social behaviour of young cattle (Estevez et al., Reference Estevez, Andersen and Nævdal2007). Although several investigations have evaluated the influence of social hierarchy (Miranda-de la Lama et al., Reference Miranda-de la Lama, Pascual-Alonso, Guerrero, Alberti, Alierta, Sans, Gajan, Villarroel, Dalmau, Velarde, Campo, Galindo, Santolaria, Sañudo and María2013) and group size (Abdelfattah et al., Reference Abdelfattah, Karousa, Schutz, Lay, Marchant-Forde and Eicher2013) on cattle growth and welfare, no studies have examined the effect of group size on behavioural and immune responses of young male buffaloes.
Therefore, this study was designed in two experiments concerning fattening male buffaloes. The first one evaluated growth performance and meat quality of animals fed diets containing different maize silage amounts. The second one focussed on behaviour immune response and weight gains of subjects maintained in groups of different sizes.
Material and methods
The study was carried out in a dairy buffalo farm located in the river Sele plain (Campania Region, southern Italy) at 15°03’E, 40°37’N and ~5 m above sea level. The study lasted 15 weeks preceded by 1-week adaptation phase (December 2009 to March 2010). Minimum temperature, maximum temperature and relative humidity ranged from 8 to 11.2°C, 12.1 to 15.3°C and 69% to 75%, respectively. Twenty-eight Mediterranean Italian buffalo entire males were used. Before the study, all the animals were handled in similar way in terms of feeding and management. Animals were weighed, randomly assigned to three groups. They were housed in three adjacent pens with slatted floor, equipped with concrete feed manger, water bowls and partially sheltered outdoor paddock. Total space allowance (3.2 indoor+3.2 outdoor m2/animal) was kept constant in the three groups, as well as the ratio of animals to drinkers (seven animals per water bowl) and the manger space (70 cm per animal). Animals were managed in accordance to the legislation concerning the use of animals kept for farming purposes (EU Directive 98/58/EC). The study was designed in two experiments.
Experiment 1
In order to evaluate the effect of different maize silage amounts (DM 29%, CP 8.0% DM, NDF 51.9% DM, starch 25.4% DM) on growth performance and meat quality, two groups were used. The high silage – low size group (HL) (age 12.7±2.6 months; BW 382.2±67.7 kg at the start of the study) was fed a TMR containing 36% DM of maize silage. The low silage – low size group (LL) was fed a TMR containing 10% DM of maize silage (age 13.0±2.7 months; BW 389.4±72.3 kg). Both groups consisted of seven animals.
Diets were fed ad libitum in the morning (0800 h) and residuals were re-approached in the afternoon (1300 h). Dry matter intake (DMI) was determined weekly on pen basis as the difference between TMR offered and refusals. Samples of feed and orts were collected and DM was determined after drying at 65°C until constant weight. The dried samples were composed across sampling days and by group and analysed. The DM, ash and CP contents of TMR and refusal samples were determined according AOAC (2002). The organic matter (OM) content was calculated as the difference between DM and ash contents. NDF, ADF and ADL were determined according to Van Soest et al. (Reference Van Soest, Robertson and Lewis1991). Sodium sulphite was not added during NDF extraction and a heat-stable α-amylase was used when necessary. Starch was determined by using a Polax-2l polarimeter in 200-mm long observation tubes. Net energy was calculated from the chemical composition of each feedstuff.
To evaluate average daily gain (ADG), animals were weighed at group formation and thereafter every 3 weeks, in the morning just before feeding. The apparent total-tract digestibility was estimated at 2nd, 8th and 15th week of the experimental period using acid-insoluble ash (AIA) as an intrinsic digestibility marker. For 3 consecutive days, faecal samples were collected from the rectum of each animal at 0900, 1300 and 1700 h. Samples of the TMR were also collected and DMI determined on group basis by the difference between feed and orts. Samples were dried at 65°C in a forced-air oven to constant weight to determine DM, composited per animal and period and ground through a 1-mm sieve. Feed and faecal samples were analysed for ash/OM, CP, NDF, and AIA by the 2 N hydrochloric acid procedure of Van Keulen and Young Reference Van Keulen and Young(1977).
Carcass and meat quality
At the end of the experimental period, the animals were loaded onto lorries and driven for 50 km to the abattoir, where they were placed in lairage pens and maintained deprived of feed, but not of water, for 12 h before slaughter. A penetrating captive bolt device was used to stun animals before slaughtering, which was performed in accordance to the EU Regulation 2009/1099/EC on the protection of animals at the time of killing. After 24 h chilling at 4°C, the carcasses were weighed and dressing percentage was calculated. Subsequently, they were scored according to the European Union beef classification system with six carcass classification grades (S superior, E excellent; U very good; R good; O fair; P poor) and five fat grades (1 low; 2 slight; 3 average; 4 high; 5 very high). In the abattoir, after scoring, the carcass pH was measured by using a portable Crison 507 pH-meter equipped with a penetrating electrode that was inserted on the left Longissimus thoracis muscle, between the 12th and 13th thoracic vertebrae. The muscles Longissimus dorsi lomborum (LD), Semimembranosus (SM) and Semitendinosus (ST) were removed from the right side of each carcass. In meat laboratory, each muscle was cut in 2-cm-thick slices, vacuum packaged and aged at 4°C until 7 and 14 days postmortem.
Muscle chemical composition was determined according to AOAC (1995). Colour was determined on two 1.3 cm thickness samples by the spectrophotometer U-3000 (Hitachi, Tokyo, Japan) with the following conditions: D65 as illuminant, and 2° angle observer. The aperture of the instrument was covered by a glass plate and calibration was made with a white disk. Before measurement, samples were allowed to bloom for 1 h at 4°C and over wrapped with a polyethylene film. The following CIE colour coordinates (CIE, 1986) were measured at three non overlapping locations of the samples: lightness (L*), redness (a*) and yellowness (b*). The Instrumental Texture profile analysis (TPA) on meat was made by means of a Texturometer 8 GTX-2 (Zenken, Tokyo). The instrument consists of a mechanical masticator, a sensing device placed under the platform supporting the meat, and a flat Lucite plunger about 11 mm diameter and 25 mm height. The variables determined were hardness (the total energy required for the first deformation/chew, kg), cohesiveness (ratio of work between the second deformation/chew and the first, adimensional), springiness (sample capacity to recover to its original shape after the deforming force was removed, cm), gumminess (hardness×cohesiveness), and chewiness (overall resistance to chewing=springiness×gumminess). Two samples 13 mm thick, 40 mm wide cut parallel to the fibres were used. Each muscle was assessed three times.
Experiment 2
In order to assess the effect of group size on growth performance, behaviour and immune response two groups were used. The first one was represented by group HL, which was in common with experiment 1, and consisted of seven animals. The second one consisted of 14 animals (age 13.9±3.25 months; BW 416.5±73.9 kg) and was fed the same diet as group HL (36% maize silage DM).
For the high silage – high size group (HH) all measurements, except DMI and behavioural recordings, were conducted on a subgroup of seven animals (age 13.3±2.6 months; BW 397.7±77.1 kg).
Feeding procedures, feed sampling and analyses, weight gain, apparent total-tract digestibility and dressing percentage assessments were performed as indicated in Experiment 1.
Behavioural recordings
Behavioural observations were conducted from December to February. Two observers carried out a familiarisation procedure to accustom the animals to their presence before conducting the observations. In particular, the observers spent 3 h a day for 3 days in visual contact with the animals: one was located in the feeding alley and the other outside the barn in proximity of the outdoor paddock. The two observers spent together 1 out of 3 h a day to standardise their assessments. Animals were observed in seven sessions of instantaneous scan sampling at 10-day intervals. Observations were made every 10 min from 1000 to 1510 h, giving a total of 32 sets of observations per session (in total the observations were 224). One observer was placed in the forage alley located inside the barn, the other was outside the barn at a distance of approximately 4 m from the fence of the outdoor paddocks. The following behavioural categories were recorded: posture (standing or, when lying, number of outstretched legs), location (outdoor or indoor) and activity such as feeding (selection, prehension and mastication), drinking, ruminating, locomotion (walking with elevated neck or parallel to the ground looking in front or around), exploration (walking slowly with or without the neck lowered, often interrupted by stopping and sniffing the ground or the housing equipment), vigilance (standing still with elevated neck, intently oriented head and ears), idling (standing or lying, opened or closed eyes, but no other overt activity). Due to difficulty in recognising individual animals, behavioural variables were expressed as the proportion of subjects observed in each category of posture, location and activity (Tripaldi et al., Reference Tripaldi, De Rosa, Grasso, Terzano and Napolitano2004; De Rosa et al., Reference De Rosa, Grasso, Braghieri, Bilancione, Di Francia and Napolitano2009) calculated as: number of animals displaying each posture, location and activity/total number of animals per group. Since observations were performed at group level, in group HH all 14 animals were used. In addition, the average number of outstretched legs was computed using the number of lying animals. Behavioural events such as agonistic interactions (pushing, butting and threatening pen mates), affiliative interactions (sniffing, nuzzling and allo-grooming), mounting behaviour (mounting pen mates, a form of reproductive interaction, as the animals were in pubertal phase), self-grooming, and oral activity (licking or manipulate housing equipment) were recorded continuously. These variables were expressed as number of interactions per animal per hour.
Immune responses
Phytohaemagglutinin (PHA) was used to perform a skin test based on non-specific, delayed type hypersensitivity. At the end of experimental period, 1 mg PHA (Sigma-Aldrich, St. Louis, MO, USA) dissolved in 1 ml of sterile saline solution was injected intradermally into the middle of 2-cm wide circles marked on shaved skin on the upper side of each shoulder. The skinfold thickness was determined before PHA injection and 24 h after with a calliper. For each animal, a mean increase in skinfold thickness (24-h thickness–preinjection thickness) was calculated using the two measurements gathered from shoulders.
Three weeks after grouping, the same animals were injected subcutaneously with 5 mg (2.5 mg per shoulder) of keyhole limpet haemocyanin (KLH, Sigma-Aldrich) dissolved in 2 ml sterile saline solution and emulsified in an equal volume of incomplete Freund’s adjuvant (Sigma-Aldrich). Another injection without adjuvant was repeated 5 weeks after grouping. Antibody titre was evaluated before the first antigen administration (pre-immunisation) and fortnightly after the first immunisation (five samples) on serum collected from a jugular vein using vacuum tubes. An enzyme-linked immuno-sorbant assay (ELISA) was performed in 96-well, U-bottomed microtitre plates according to the procedure described by Napolitano et al. (Reference Napolitano, De Rosa, Grasso, Pacelli and Bordi2004). Optical density was measured at a wavelength of 450 nm (OD450) using Rosys Anthos 2020 ELISA reader (Diessechem, Milan, Italy). The intra- and inter-assay CVs were 4.5% and 6.5%, respectively. The assay was optimised in our laboratory for concentrations of coating antigen, serum and detector antibody.
Statistical analyses
Data were analysed with SAS software (SAS Institute, 1990). For each variable, the assumptions of parametric tests were checked before data analyses. The Shapiro–Wilk’s test across the levels of each factor was used to test the normality of distribution, and for each factor, homogeneity of variance was assessed with Levene’s statistic. The animal was used as the experimental unit for all analyses, except DMI and behavioural data. These data, due to the lack of individual recordings, were analysed using the day of observation as the experimental unit.
In Experiment 1 ADG and digestibility coefficients data were analysed with a linear mixed model with level of silage (10% and 36% DM, corresponding to groups HL and LL, respectively) as a non-repeated factor, and week of observation and level of silage×week of observation as repeated factors. The animal variance was considered to be random and utilised as the error term to test the main effect of the non-repeated factor. DMI and carcass traits data were analysed by one-way analysis of variance with level of silage (HL and LL) as factor. Meat quality data were analysed using a linear mixed model with level of silage (HL and LL) as non-repeated factor, the interaction ageing x muscle as repeated factor, and the carcass cold weight as covariate. The animal variance was considered to be random and utilised as the error term to test the main effect of the diet.
In Experiment 2, ADG and digestibility coefficients data were analysed with a linear mixed model with group size (7 and 14, corresponding to groups HL and HH, respectively) as a non-repeated factor, and week of observation and group size×week of observation as repeated factors. The animal variance was considered to be random and utilised as the error term to test the main effect of the non-repeated factor. DMI and carcass traits data were analysed by one-way analysis of variance with group size (HL and HH) as factor. Behavioural variables were analysed using an ANOVA with group size (HL and HH), period of observation (1000 to 1230 h and 1231 to 1510 h) and group size×period of observation as factors. Angular and logarithmic transformations were used to normalise skewness of drinking activity and agonistic interactions, respectively. Skin test data were analysed using one-way analysis of variance with group size (HL and HH) as factor. Antibody titre data were analysed with a linear mixed model with group size (HL and HH) as non-repeated factor, and time (0, 2, 4, 6, 8 and 10 weeks after the first immunisation) and group size×time as repeated factors. The animal variance was considered to be random and utilised as the error term to test the main effect of group size.
Results and discussion
Experiment 1
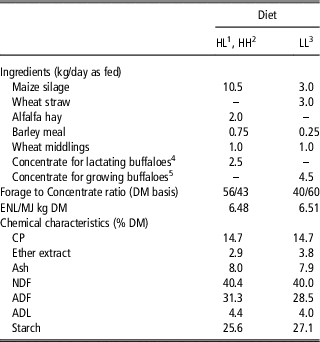
The HL and LL TMRs were kept iso-caloric and iso-nitrogenous and were formulated to meet animal requirements for all nutrients to avoid unfavourable effects on ADG and carcass composition (Table 1). The chemical characteristics of the two diets were rather similar. The main difference was for forage to concentrate ratio, with the values of LL diet (40/60) closer to those generally adopted for meat production. HL diet was based on the same feeds used for lactating buffaloes and this fact may simplify feeding operations in dairy buffalo farms raising male calves for meat production.
Composition and chemical characteristics of the diets offered to male fattening buffaloes

HL=high silage – low size group; HH=high silage - high size group; LL=low silage - low size group; DM=dry matter; ENL=endogenous nitrogen losses; TMR=total mixed ration.
1 Group HL was fed a TMR containing 36% DM of maize silage and consisted of seven fattening bulls.
2 Group HH was fed a TMR containing 36% DM of maize silage and consisted of 14 fattening bulls.
3 Group LL was fed a TMR containing 10% DM of maize silage and consisted of seven fattening bulls.
4 Based on soybean meal, wheat middlings, wheat shorts, sunflower meals, maize meal, dry beet molasses, hydrogenated vegetable fats, vitamin and mineral mix
5 Based on maize meal, soybean meal, barley, hydrogenated vegetable fats, sunflower meal, vitamin and mineral mix.
The effect of week of observation, only tested for ADG and digestibility coefficients, was significant only for ADG (P<0.05) as the values increased as the trial progressed. In addition, ADG and digestibility coefficients were not influenced by the interactions between level of maize silage and week of observation (P>0.05).
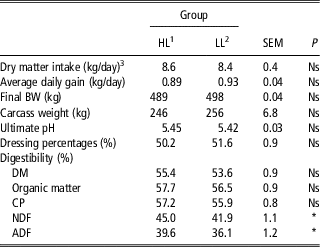
The effect of the diet on DM intake, weigh gain, carcass traits and in vivo digestibility is reported in Table 2. DMI of the two diets was similar (P>0.05), showing that the poor palatability of wheat straw, that was the greatest fibre source of the LL diet, did not induce an increment of feed refusal. The two diets showed similar total tract digestibility of proximate constituents, whereas the coefficients of NDF and ADF digestibility were significantly lower in group LL (P<0.05). The observed lower cell wall component digestibility may be attributed to the simultaneous presence of high amounts of fibrous feeds (i.e. wheat straw) and concentrate (negative associative effect). Van Soest (Reference Van Soest1994) suggests that fibre digestibility depression observed when concentrate is added to forage may be due to the faster passage rate of concentrate small fibre particles. The lack of differences in DMI and digestibility resulted in a lack of differences in growth, since ADG and final BW were not influenced by diet. Also Borghese et al. (Reference Borghese, Terzano, Mazzi, Razzano, Sabia and Pacelli2010) and Cifuni et al. (Reference Cifuni, Contò, Amici and Failla2014) did not observe significant differences in growth performances between fattening buffaloes fed isonitrogenous and isoenergetic diets based on maize silage or hay. ADG values obtained in this study were comparable to those observed on Mediterranean Italian buffaloes by Allegrini et al. (Reference Allegrini, Mazzi, Roncoroni, Alfieri, Campagna and Borghese2010) and Borghese et al. (Reference Borghese, Terzano, Mazzi, Razzano, Sabia and Pacelli2010), whereas they were higher than those reported for Asian and South American buffaloes in less intensive feeding regime (Borghese, Reference Borghese2005) and lower than those detected in beef cattle (Spanghero et al., Reference Spanghero, Gracco, Valusso and Piasentier2004). As to slaughtering traits, all carcasses were classified 0 (fair) for conformation and 4 (high) for the fat grade. No significant effects of level of silage on carcass weight, dressing percentage (Table 2) and ultimate pH were found. The overall mean ultimate (24 h postmortem) pH value was 5.43±0.03 (least square mean±SEM), which was similar to that reported for buffalo bull carcasses by Spanghero et al. (Reference Spanghero, Gracco, Valusso and Piasentier2004).
Experiment 1: effects of maize silage level on dry matter intake, average daily gain and carcass traits (least square means) of male fattening buffaloes

HL=high silage – low size group; LL=low silage – low size group; TMR=total mixed ration; DM=dry matter.
1 Group HL was fed a TMR containing 36% DM of maize silage and consisted of seven fattening bulls.
2 Group LL was fed a TMR containing 10% DM of maize silage and consisted of seven fattening bulls.
3 Calculated on group basis.
*P<0.05.
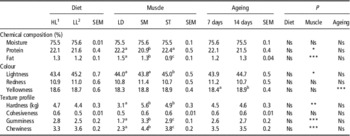
Table 3 shows the influence of level of maize silage, ageing time and type of muscle on meat composition, colour and texture profile analysis. No significant interactions between these factors were detected (P>0.05). The lack of significant interactions suggests that the two diets had similar influences across the ageing times and the muscles examined. The dietary level of maize silage did not affect meat colour and proximate composition (P>0.05). Cifuni et al. (Reference Cifuni, Contò, Amici and Failla2014) found higher fat content and redness and yellowness values of meat from buffaloes fed diet at 46% of maize silage compared with hay fed buffaloes. The smaller differences in maize silage levels between HL and LL could explain the lack of a diet effect in this study. In addition, it has been reported that the main factors affecting meat colour are related to age, weight, exercise and management at slaughter, whereas an effect of diet is not common since it would require a direct influence on the myoglobin fraction and iron content (Priolo et al., Reference Priolo, Micol and Agabriel2001). Intramuscular fat content can increase meat lightness (Priolo et al., Reference Priolo, Micol and Agabriel2001), but no differences were observed for meat fat and carcass fatness between animals fed diets at low or high silage content. No effects of diet were observed for texture profile analysis (P>0.05). TPA is able to describe meat hardness (de Huidobro et al., Reference De Huidobro, Miguel, Blázquez and Onega2005), that, in turn, is one of the key criterion for consumers to judge meat quality. Results from the literature on the effect of diet on instrumental variables evaluating meat tenderness are inconsistent, since differences can be confounded by factors such as BW, carcass fatness, slaughtering conditions, etc. (Muir et al., Reference Muir, Deaker and Bown1998). The nutritional strategies to improve meat tenderness are based on manipulating growth rate, since faster growth, with high rates of protein turnover, results in a lower proportion of maturated protein and stable muscle links, and, therefore, in tenderness benefits (Maltin et al., Reference Maltin, Balcerzak, Tilley and Delday2003). When animals grow at similar rates, as observed in this trial, meat tenderness differences between diets may be minimised to not significant levels (Muir et al., Reference Muir, Deaker and Bown1998). Overall dietary level of maize silage did affect neither growth parameters nor meat quality. Since the price of concentrate is high in relation to the value of buffalo meat, the benefit to include higher maize silage level in the diets of fattening buffaloes offers the possibility to achieve satisfactory animal performances while reducing concentrate input and ration costs. The ageing time did not affect meat proximate composition (P>0.05), and lightness and redness values (P>0.05), whereas it displayed its effect only on yellowness (P<0.01), as also reported by Boakye and Mittal (Reference Boakye and Mittal1996) in cattle. Moreover, no effect of ageing was found on texture profile (P>0.05). In general, the values of TPA variables are lower in meat aged for longer time, due to a weakening of the myofibrillar structure, resulting in decreased hardness and cohesiveness. In our study the lack of an ageing effect can be due to the fact that most of the proteolytic process occurs in the first days postmortem (Taylor et al., Reference Taylor, Geesink, Thompson, Koohmaraie and Goll1995), whereas we only assessed TPA at 7 and 14 days postmortem. As to muscle effect (Table 3), a significant higher CP content was observed for LD and ST than SM (P<0.05). Moreover, fat content differed among muscles with the highest value showed by LD and the lowest by ST (P<0.05). As to colour, significant differences among muscles were found only for lightness (P<0.05) as an effect of differences in structures (Hughes et al., Reference Hughes, Oiseth, Purslow and Warner2014). TPA traits were highly variable among muscles (P<0.01÷P<0.001), with the lower values found for LD and the higher for SM. These differences are in relationship to variations in proteolysis, rigor shortening, marbling and connective tissue properties as described by Rhee et al. (Reference Rhee, Wheeler, Shackelford and Koohmaraie2004) and Hughes et al. (Reference Hughes, Oiseth, Purslow and Warner2014).
Experiment 1: effects of silage level, muscle and ageing time on meat chemical composition and instrumental variables (least square means) of male fattening buffaloes

HL=high silage – low size group; LL=low silage – low size group; LD=longissimus dorsi; SM=semimembranosus; ST=semitendinosus; TMR=total mixed ration.
a,bValues within a row with different superscripts differ significantly
1 Group HL was fed a TMR containing 36% DM of maize silage and consisted of 7 fattening bulls.
2 Group LL was fed a TMR containing 10% DM of maize silage and consisted of 7 fattening bulls.
*P<0.05, **P<0.01, ***P<0.001.
Experiment 2
As also observed in Experiment 1, the effect of week of observation on ADG was significant (P<0.05) as the values increased while the trial progressed, whereas digestibility was not affected by time. In addition, ADG and digestibility coefficients were not influenced by the interaction between group size and week of observation (P>0.05). DMI of group HH (calculated on 14 buffaloes) did not differ from that shown by group HL (P>0.05). The observed DMI values were comparable to those reported by Allegrini et al. (Reference Allegrini, Mazzi, Roncoroni, Alfieri, Campagna and Borghese2010) for buffalo bulls of similar age. No significant effect of group size on digestibility coefficients was found (P>0.05). The lack of differences in DMI and digestibility resulted in a lack of differences in growth, since ADG and final BW were not influenced by group size. The rationale for testing the effect of group size on ADG and digestibility is that the number of agonistic interactions may increase with the number of animals in the group, thus influencing feed intake, and, as a consequence, growth and total tract digestibility. Nevertheless, in this study group size did not display any significant effect on these variables (P>0.05), as well as on the number of agonistic interactions (P>0.05). Also other authors (Abdelfattah et al., Reference Abdelfattah, Karousa, Schutz, Lay, Marchant-Forde and Eicher2013) failed to find any differences in weight gain between groups of calves reared at different group sizes. Napolitano et al. (Reference Napolitano, De Rosa, Grasso, Pacelli and Bordi2004) observed a reduction of agonistic interactions as the space allowance per calf increased, which may indicate that space is the major factor influencing the occurrence of agonistic behaviour in calves (Bøe and Færevik, Reference Bøe and Færevik2003). No significant effect of group size on carcass weight, dressing percentage and ultimate pH was found.
Behaviour
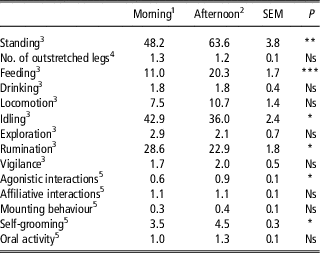
Group size did not affect the behavioural activities (P>0.05) with the exception of drinking (1.04±0.35% v. 2.60±0.35% of animals performing the activity for groups HL and HH, respectively; P<0.01) and vigilance (2.58±0.46% v. 1.20±0.46% of animals performing the activity for groups HL and HH, respectively; P<0.05). This latter behaviour is thought to be largely controlled by the threat of predation and decreases with increasing group size (Mendl and Held, Reference Mendl and Held2001). Our result on vigilance behaviour is in line with the ‘many-eyes hypothesis’ (Pulliam, Reference Pulliam1973), which suggests that per-individual vigilance decreases with increasing group size. As a consequence, more time can be devoted to other activities (Penning et al., Reference Penning, Parsons, Newman, Orr and Harvey1993). The lack of effects of group size on the other behavioural categories are in agreement with the results obtained by Færevik et al. (Reference Færevik, Andersen, Jensen and Bøe2007) on weaned cattle kept in groups of 4, 8 and 16 subjects per box, where the time devoted to feeding and idling, as well as social interactions, were not influenced by group size. These results can be explained by the fact that in both, this study and Færevik et al.’s study, the availability of space (6.4 and 2.25 m2/head in this and in Færevik et al.’s study, respectively) and the front of the manger (0.7 and 0.3 m/head in this and in Færevik et al.’s study, respectively) were held constant for the different experimental groups with possibly negligible effects on time budget and social behaviour. As expected, the period of observation significantly affected some behavioural activities (Table 4). In particular, the animals were more active in the afternoon (1231 to 1510 h) than in the morning (1000 to 1230 h), as indicated by the higher proportion of animals observed standing (P<0.01), feeding (P<0.001), and expressing an higher number of agonistic interactions (P<0.05) and self-grooming activities (P<0.05). Conversely, more animals were observed idling (P<0.05) and ruminating (P<0.05) in the morning than in the afternoon. These results may be due to the feeding distribution and behavioural recording time schedules as in the morning TMR was delivered at 0800 h, while the observations started at 1000 h. Conversely, the residuals were re-approached to the manger at 1300 h, thus possibly eliciting a resuming of behavioural activities during the afternoon observations (1231 to 1510 h).
Experiment 2: effect of period of observation (least square means) on behavioural activities of male fattening buffaloes observed in seven sessions

1 Morning=1000 to 1230 h.
2 Afternoon=1231 to 1510 h.
3 Data are expressed as percentage of animals observed in each behavioural activity.
4 Data are expressed as no. of outstretched legs per lying animal.
5 Data are expressed as number of events/animal per hour.
*P<0.05, **P<0.01, ***P<0.001.
Immune responses
The study of immune functions as indirect indicators of farm animal welfare has been widely used (Grasso et al., Reference Grasso, Napolitano, De Rosa, Quarantelli, Serpe and Bordi1999; Napolitano et al., Reference Napolitano, De Rosa, Grasso, Pacelli and Bordi2004). Neither delayed type hypersensitivity to a percutaneous injection of PHA (3.56±0.52 v. 3.45±0.52 mm for groups HL and HH, respectively; P>0.05) nor antibody response to KLH injection were affected by group size (P>0.05), whereas, as expected, a significant effect of time after the first immunisation was detected (P<0.001). The antibody titer (pre-immunisation value=0.09±0.09 OD450) reached a peak four weeks after the first immunisation (1.32±0.09 OD450). These results are in agreement with those reported in a study conducted on growing pigs kept in groups of 20 or 80 subjects showing that the humoral response to the Newcastle virus was not affected by group size (Turner et al., Reference Turner, Ewen, Rooke and Edwards2000). Similar results were observed on sows kept in individual stalls or groups of 5 and 38 subjects (Broom et al., Reference Broom, Mendl and Zanella1995). However, in the literature there is a lack of specific studies on buffalo, whereas the effect of space allowance on the immune responses of different buffalo categories was extensively studied (Grasso et al., Reference Grasso, Napolitano, De Rosa, Quarantelli, Serpe and Bordi1999; Tripaldi et al., Reference Tripaldi, De Rosa, Grasso, Terzano and Napolitano2004). From these studies emerge an increased immune responses only for calves (Grasso et al., Reference Grasso, Napolitano, De Rosa, Quarantelli, Serpe and Bordi1999) kept at higher space allowance.
Conclusions
The increment of the level of maize silage from 10% to 36% DM in TMR fed to fattening buffaloes and the increase of group size from 7 to 14 animals did not influence growth rate, digestibility and carcass traits. Moreover, the different maize level in the ration did not display any detrimental effect on meat colour and texture parameters, whereas group size did not affect behavioural and immune responses of the animals. Finally, the extension of ageing from 7 to 14 days did not produce any change on meat tenderness. Therefore, we conclude that various management and process strategies may be used to reduce the production costs of buffalo meat.
Acknowledgements
Research supported by CRAA-Regione Campania (SiRCA n. 418 05.08.08). Thanks are due to the staff of the farm ‘Gaetano Iemma’ (Eboli, Italy) for help with the care of the animals. The technical assistance of M.L. Varricchio, L. Conte, R. Di Matteo and G. Migliori is also recognised.