

INTRODUCTION
The Late Republic and Early Roman Empire have often been perceived as a period of sustained economic growth.Footnote 1 The total stock of denarii in circulation was thought to be steadily increasing as monetisation took hold in the provinces and markets developed. This positive vision could even sustain the gradual debasement of the denarius and its descent into the billon radiates of the third century, followed by the plentiful bronzes of the fourth century, which was spun positively as evidence that this now abundant small change could facilitate market exchange in a way that high-value silver coins originally could not. From the perspective of the ongoing financial crisis since 2008, continued and sustained growth and monetisation is a comforting idea, but rarely a reality, bubbles burst. So how continuous was ‘growth’ and monetisation in Roman Britain through the two centuries after the Claudian conquest?
The long-term stability of the monetary system in operation during the first and second centuries makes it tricky to use the coinage to answer any of these questions. Such was the stability that a find from a site of a denarius of Mark Antony could have been lost at almost any time from Britain's first contact with the Roman world through to the early third century when the radiate took its place.Footnote 2 A histogram of site-finds of this period based on the date of coin production, therefore, only has limited value in informing us of the date of use, loss or deliberate deposition of coin, since its period of circulation could have spanned anything from a day to several centuries before being ‘lost’. Instead economic discussion about the province has tended to focus upon other tangible evidence: the size of the garrisoned army; the rise and fall of the importation of fine wares and amphorae; the organisation of the major ceramic industries and the supply of the army;Footnote 3 and increasingly the direct ecofactual evidence for feeding the army rather than using the proxy of ceramics.Footnote 4 However, money lies behind the changes in taxation and trade. The army had to be paid for, supplied in kind or from the market; money lay behind the development of the urban markets; and money was an important medium through which to spread the image of the emperor and political messages. Finding a way to observe patterning and nuance in this long-lived stable currency system would be a significant step forward in creating narratives of the period.
The objective of this paper is to develop a methodology to try and unlock the potential of information from hoards in this period of apparent stability, to show how coin (in this case denarii) moved around the province, and to do this quantitative analysis in an accessible visually intuitive way. This entails creating a dynamic model from static data. Did new coin come from the mints to pay the soldiers? Is this where it entered circulation? Was the provincial capital (or later capitals) a place where new coin was issued and spent? Did money circulate faster and faster as monetisation took hold and people started using it more? These are the kinds of question which if answerable can challenge a presumption of sustained growth, and start moving towards a more nuanced and undoubtedly bouncier economic history of the province.
THE CONCEPT
There are many assumptions made about the circulation of coinage in the Roman world. Some are so ‘obvious’ and ‘common sense’ that they are rarely questioned. We have no accounts for the Roman state, but no ancient historian would question that the Roman army was the largest item of expenditure during the Principate. This has been the foundation for many models of the Roman economy.Footnote 5 We imagine that new coin largely entered circulation where the army was, and it might also have happened where provincial governors were based. Sometimes detailed analysis can show this: Fleur Kemmers examined the supply of coinage to the Lower Rhine revealing that often there appeared to be peaks in the presence of coins of the same date that each fort was founded, implying new coins dominated supply during campaigns.Footnote 6 However, at times countermarked coins of an earlier emperor might be used if supply was limited or demand for coins elsewhere was high. An example of this was the presence of TICLAVIM Claudian countermarks on Caligulan coin along the Rhine at the time when campaigns in Britain were taking place and new coin was demanded there.Footnote 7
However, despite the wealth of quantitative data from site finds and coin hoards, we still lack a large-scale dynamic model of the flow of money around the Roman world during the Early Empire. In other periods mintmarks have been used to track the movement of coin, but unlike the East, there were few mints in the West to aid us.Footnote 8 By contrast, in the later Roman world mintmarks offer the chance to model the flow of coinage from one area to another,Footnote 9 and in more recent times more advanced statistical techniques have been developed to study the spread of the Euro coins since its inception in January 2002 which could potentially be applied to the Later Roman Empire.Footnote 10 But in the Early Empire this tracking of coin has only been possible on a few, rare occasions. To develop a wider narrative we need more than the tracking of individual coin types from province to province, and we need more than large-scale observations that the coinage of one province was not identical to that of another. To look at the Roman economy and discover how integrated it was we need, as Chris Howgego has stated, ‘to ask how much mixing of coin took place, how long it took, and in what context it happened’.Footnote 11
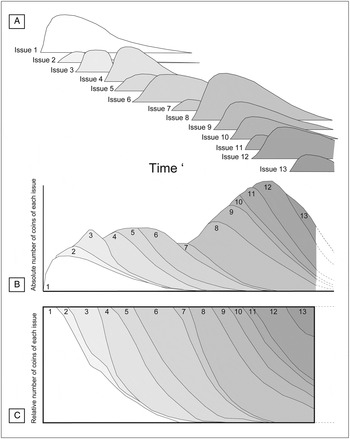
In developing a new method we need to conceptualise the coin circulation pool. As each new moneyer or emperor issued denarii, the absolute number of these would gradually rise as the coins entered circulation; then decline and fall as coins disappeared through accidental loss, permanent votive deposition, or the non-recovery of stores of wealth or hoards ( fig. 1a). The tail-off might be gradual or subject to a sudden decline as an earlier issue was recalled or melted down because it had an excess of silver in it relative to contemporary issues (Gresham's Law). Some issues would be larger than others, but cumulatively all the series stacked together make up the entire coin circulation pool of denarii ( fig. 1b). Can we know the shape of this curve? Alas, we have no secure way of reconstructing the total number of coins in circulation in Britain; die studies might reconstruct for us notional issue sizes for the Empire as a whole,Footnote 12 but we cannot easily know the proportion of coin that came here rather than to another province. However, if we consider that coin hoards reflect coinage in circulation then we could at least attempt to reconstruct a proportionate image of the denarii in circulation ( fig. 1c), but would this be a legitimate assumption?
The composition of the circulation pool: conceptual model.

Many numismatists have expressed the view that if hoards are providing a consistent picture, then they would feel comfortable with correlating the pattern of coins of one denomination in hoards with the contents of the coin circulation pool. For example, Marion Archibald considered that: ‘the proportions of coins of different reigns and types present in particular hoards are of course expressible as precise figures. These figures provide a very important guide to the relative commonness of these groups, but they must not be taken as evidence of the presence of precisely those proportions among the coins in circulation unless this is borne out by a considerable body of homogeneous hoard evidence.’Footnote 13 Similar sentiments have been expressed by Philip Grierson;Footnote 14 Michael Crawford agreed but qualified the equation of hoards with the circulation pool further by specifying that a large database was needed in order to remove various ‘freaks and aberrations’.Footnote 15 Even by the 1950s Anne Robertson was concluding that ‘an analysis of well listed Romano-British hoards does show that a group of hoards of the same period had, as a rule, the same general composition’;Footnote 16 so much so that when an aberrant hoard was discovered, such as the Falkirk hoard in 1933 (discussed later), it clearly stood out as having far more older coins within it than other contemporary hoards.Footnote 17 Richard Reece most notably started to graph and tabulate how consistent the contents of Romano-British denarius hoards were from the 1970s onwards.Footnote 18 Since which, with the growth in metal detecting and the improved recording and publication of coin hoards, the data are now in place to attempt to put these hoards on a firm quantitative footing.
THE DATABASE
Britannia is a province rich in denarius hoards. 43,301 coins identified to individual emperors or their family can be associated with 287 hoards that contain five or more denarii. These are listed in Appendix 1 along with a reference to a corpus where the full bibliographic details of each individual hoard can be found. A corpus of coin hoards from Roman Britain was accumulated by Robertson (Reference Robertson, Hobbs and Buttrey2000) — it missed a few antiquarian reports but was otherwise pretty comprehensive; since then new denarius hoards have mainly been published in the Coin Hoards from Roman Britain series, and the British Museum has also maintained an archive of Treasure reports. All hoards up until finds in mid-2009 are listed here. No datasets are without their challenges, so here are some with this one.
First, a threshold was needed as to how many coins a hoard required to be included in the analysis? The cut-off used is essentially arbitrary, but hoards of ten or more denarii were used to create the benchmark of what the ‘normal’ hoard structure should look like, whereas all hoards of five or more denarii have been tested against this benchmark and are listed in the appendix. The smaller the hoard the less likely the latest coin in the hoard is going to give an accurate date and the more random noise and variation will enter into the analysis.Footnote 19
Secondly, while many recent finds have full and accurate records, this analysis includes finds reported as far back as the seventeenth century when there was only a list of emperors (and wives) available. It was important to be able to include these since they make up a significant number of hoards. While it would have been ideal to use Reece or Casey coin periods, the level of detail then required would have excluded the inclusion of a lot of earlier recorded hoards.Footnote 20 So instead a series of 17 broadly chronological groups A–Q has been established (Appendix 2). In the first two groups, the denarii of Mark Antony (Group B) have been separated out from other Republican coins (Group A), partly because more antiquarians recorded them separately meaning this could be done, and also because they behave differently; Republican coins dropped off in circulation after Nero's reforms and are few after Trajan, but coins of Mark Antony persisted longer into the third century, so it was felt appropriate to separate them. Another chronological overlap comes where some early records are not specific about whether an individual was Caesar or Augustus on their coins (i.e. whether the coins were issued under their father or in their own reign), or when imperial wives outlasted their husbands. For example, antiquarian records often refer to a ‘coin of Faustina’ which could be Faustina the first or second, and if the second then was it minted under Antoninus Pius or Marcus Aurelius? So the pragmatic decision has been taken to lump all the Faustinas together in Group J along with Antoninus Pius.Footnote 21 Appendix 2 makes the details of the groups clear.
Thirdly, occasionally a hoard will contain an irregular coin. Much as today, irregular issues circulated amongst genuine ones. If there were any, it was often only one or two in a hoard of a hundred or so; in this case they have not been treated differently. However, very occasionally hoards entirely comprised irregular issues or else a significant package of copies in with regular ones. In these cases the irregular portion has been treated separately, and they have been considered as hoards in their own right. The patterning they reveal is discussed below.
Fourthly, particularly with antiquarian finds, only a sample of coins was recovered from the hoard. Often an idea of the actual size of the hoard was available and so the proportion identified could be judged. Sometimes there was no way of telling if there had been any selection of the sample. Nonetheless, many of these groups had the ‘look and feel’ of a ‘normal’ hoard, not suggesting that just the choicest specimens had been selected by the antiquarian. These have been included as hoards in their own right, but have been noted in the tables and analysis.Footnote 22
Fifthly, establishing the terminus post quem (TPQ) of a hoard is usually by reference to its latest coin. Sometimes this can be very specific and dated to a single year, sometimes only to an emperor's reign. However, in the case of the earliest Roman coin hoards in Britain it can be a very moot point. For example, the Raydon hoard from Suffolk (1995) ended with a coin of 7 to 6 b.c. Because there were relatively few early Julio-Claudian denarii in circulation, it is possible this was actually a hoard deposited much later, and the practice used to be to assume that all such hoards dated to the Claudian conquest of a.d. 43 or later. Increasingly, I think that some of these may have been pre-conquest deposits, but for the purpose of this analysis any hoard with a closing coin earlier than the invasion has been given a TPQ of a.d. 43,Footnote 23 and interpretation of the conquest period should bear this in mind. Should this study ever be extended to examine hoards on the other side of the Channel in the Caesarean to Claudian era then it may be possible to re-examine this.
THE ‘NORMAL’ HOARD
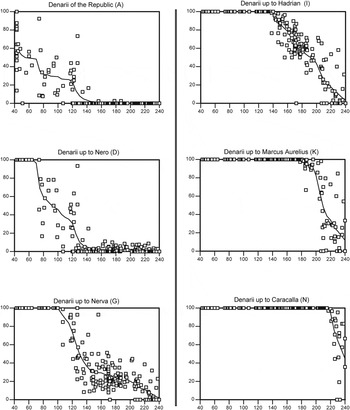
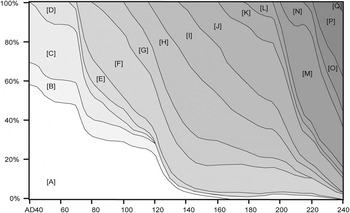
The data from the c. 230 hoards with ten or more denarii were used to create a concept of what an average or ‘normal’ hoard in Britain should look like at different dates ( figs 2–3). In the graphs in fig. 2, each individual hoard is represented as a point. The top left graph, therefore, shows the percentage of Republican denarii in hoards (Group A) declining over time.Footnote 24 Similarly the graph on the bottom right shows the presence of coins up to and including Group N (Caracalla) in hoards. Naturally these make up 100 per cent of all coins until after his death in a.d. 217, at which point the proportion in the hoards starts to fall. Graphs like this were created for each group from A–Q. A curve was fitted to each line, and fig. 3 shows all the curves added together onto the same plot. This effectively represents our third-tier illustration in fig. 1.
The benchmark: the ‘normal’ composition of denarii hoards in Britain.

Creating the benchmark: the cumulative proportion of different rulers on denarii within hoards over time. Each point represents an individual hoard containing more than five denarii. The Groups are: A. Republican; B. Mark Antony; C. Early Julio-Claudian; D. Later Julio-Claudian; E. Civil War; F. Early Flavian (Vespasian); G. Later Flavian (Domitian); H. Trajanic; I. Hadrianic; J. Antonine 1 (Antoninus Pius); K. Antonine 2 (Marcus Aurelius); L. Antonine 3 (Commodus–Didius Julianus); M. Early Severan 1 (Septimius Severus); N. Early Severan 2 (Caracalla); O. Later Severan 1 (Macrinus–Elagabalus); P. Later Severan 2 (Severus Alexander–Maximinus); Q. Later Severan 3 (Balbinus–Gallienus).

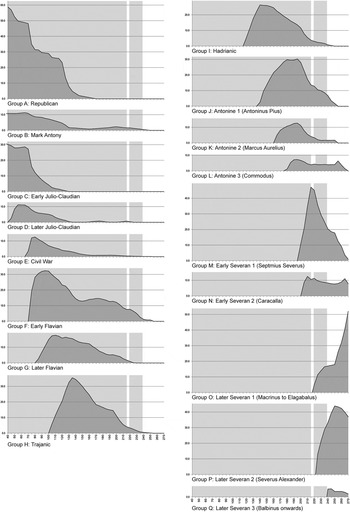
The curves provide, ultimately, only a rough approximation to the average composition of the denarius circulation pool at any date in Britain. The curves were arrived at in two ways. First by plotting directly the data points of the cumulative composition of the hoards (as seen in fig. 2) and attempting to fit a curve to the line; and secondly by plotting the proportion of each coin group separately (as seen without all the individual data points in fig. 4), then adding them together to ensure they totalled 100 per cent. No mathematical curves were fitted to the data. There is absolutely no reason why any of the graphs illustrated should conform to a simple mathematical function. Occasions such as the sudden input or withdrawal of a coin series in circulation would cause a step in the line which a fitted curve would in all probability smooth out. Instead, various interpolation techniques were used to suggest segments of curves, though in the end a judgement by eye was used to link them up. Ultimately this is simply a heuristic device, a crude measuring instrument by which to judge normality. The analysis later demonstrated that about half the hoards were judged by this benchmark to be ‘archaic’ and half ‘modern’ in comparison (i.e. half are above and half below the line in fig. 6), which suggests that as ‘an average’ the curve has some broad validity or at least utility. The data for the final benchmark are given in Appendix 3. Doubtless the picture might be slightly different in another part of the Empire. The data exclude hoards which predominantly contained irregular denarii.
fig. 4 shows all the individual series separated out. For coins which were already in circulation before Claudius, you can see their proportion in circulation roughly decline over time. For emperors later than the Claudian invasion, you can see their coin rise in proportion as their numbers entered circulation, and then generally decline as a percentage as they disappeared and new coins entered as well. For the final issues towards the end of the denarius' life, you can see how virtually all the denarii of Septimius Severus and earlier were withdrawn from circulation, just leaving the baser later issues in play. The vertical shaded areas on these graphs are added to assist visual perception of the effect of the end of production of the denarius and the institution of the radiate (also often called the antoninianus). The shaded area represents the time when the denarius was in its primacy. The first line at a.d. 215 represents Caracalla's introduction of the new coin, while the second and third represent the suspension from production of radiates during a.d. 219–38 and their subsequent reintroduction. However, it is stressed that all the information on the graph comes from only denarii.Footnote 25
The approximately average or ‘normal’ percentage of denarii of different date found in hoards in Britain (this shows the identical data to fig. 3, but with each group separated out).

We now have a heuristic device representing ‘normal hoard composition’. The spread of the individual hoards on either side of these lines in fig. 2 should warn us that there is still much variation in the data, and the benchmark only represents a guide to the average composition; but it is in measuring that variation and analysing its temporal and geographical aspects that we may learn new information about the past.
MEASURING VARIATION FROM THE BENCHMARK
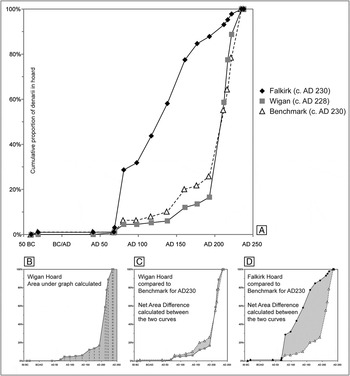
Having established a benchmark, we now need a way of measuring difference from it. One way of visually expressing hoard structure is by drawing a cumulative frequency graph.Footnote 26 fig. 5 shows these curves for two early third-century hoards, one a fairly normal hoard from Wigan with a terminal date of c. a.d. 228, the other a large deposit from north of the Antonine Wall from Falkirk, with a terminal date of c. a.d. 230. Both of these are also compared against our benchmark curve for a.d. 230, representing what an average hoard of that date would look like.
The structure of the Wigan and Falkirk hoards compared with the benchmark of a.d. 230.

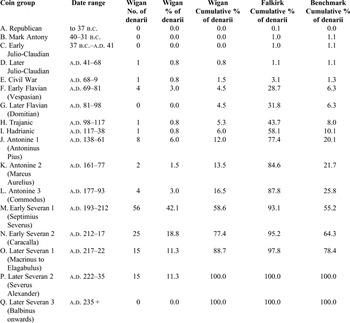
The construction of the curves is straightforward: the percentage of each coin group represented in the hoard is calculated, then the cumulative percentage by adding one another (see Table 1). On the graph the proportion of coins in the Wigan hoard starts with 0.8 per cent of Julio-Claudian coins, rising to 1.5 per cent of issues up to the end of the Civil War, then 4.5 per cent dating to the end of Vespasian's reign etc., until 100 per cent is reached with the latest coin in the hoard, which in this case was c. a.d. 228 (Group P).
THE WIGAN AND FALKIRK HOARDS, AND ‘AVERAGE’ HOARD CONTENT OF c. A.D. 230: DATA FOR FIG. 5

We now have a way of visually describing hoard structure. fig. 5a compares three curves. It can be seen that the Falkirk hoard is largely above the benchmark line of a.d. 230, meaning it has an ‘archaic’ content, containing a larger component of earlier coins than might be expected. While the Wigan hoard is largely below the a.d. 230 line, meaning that it has a marginally higher proportion of newer coin in it than would be normal.
To create a measure of difference to the norm the difference in area between the two curves has been calculated. This is done by calculating the area under each curve individuallyFootnote 27 ( fig. 5b), and then subtracting the area of the actual hoard curve from the benchmark curve (e.g. the shaded areas in figs 5c and 5d). The larger the difference the more divergent the hoard; if the hoard is above the benchmark line, it is a negative divergence marking out a hoard with an ‘archaic’ composition, and if it is positive, it is a hoard with a more up-to-date content.
In the case of the Falkirk hoard, the Net Area Difference (NAD) comparing it with a.d. 230 is −6978 units. Most hoards are of the order of ±2000 units, so the Falkirk hoard is exceptionally archaic in its structure. If one were to compare Falkirk against earlier dates on the benchmark, then the point at which the NAD closes to zero is around a.d. 184–5, even though it must have been deposited in the 230s or later. This means that its structure is about 45 years behind the times. This suggests that if one wanted to imagine the Falkirk hoard as comprising a batch of coins coming north, and then just a few later additions being made to it before it was concealed, then c. a.d.184–5 would be the best-fit date for when the original batch arrived in the area.
The Wigan hoard, on the other hand, comes out with a value of +664 comparing it with a.d. 230, indicating the hoard is slightly more ‘modern’ in its structure. However, the terminal date of this hoard was actually a.d. 228, so comparing it against that date calculates it to be even more ‘modern’ in its structure at +965 units.
We can do this calculation for all of the denarius hoards. However, not all have a precise TPQ; some have a date range for their terminal coin. For example, the Verulamium Eastern Tower hoard had a terminal coin of a.d. 227–9. In that case the NADs for each of three years were calculated, and the best-fit date taken. In this case that was the one for a.d. 227.
So, to summarise: ‘archaic’ hoards will give a negative NAD value; hoards similar to the benchmark will be close to zero; and ‘modern’ hoards with lots of new coin in them will have a positive NAD value. Now we have an indicator showing how ‘archaic’ or ‘modern’ a hoard is relative to our notional benchmark, it is possible to search for patterning in the data, both chronologically and spatially.
ANALYSIS: CHRONOLOGICAL VARIATION
Roman denarii entered Britain for a number of reasons. Some may have been used to pay the army and the provincial administration, whilst others may have arrived in exchange for exports to the Continent. The balance between these and other possibilities is unknown and possibly unknowable. However, enter Britain they did. Let us take a hypothetical example: the arrival of the new denarii of Hadrian. Some may have been directly shipped to take care of regular state expenditure on the army in the North, whilst other coins may have been issued in less predictable localities, such as wherever Hadrian spent the night on his tour of the province. From the moment of their release, a myriad of transactions would have slowly spread them beyond the issuing points to other parts of the province and beyond. This picture is entirely conjectural, and yet it serves to demonstrate that whatever function coinage is serving, whatever the mechanism by which it is put into circulation, it has to enter somewhere, from whence it diffuses.
In a circulation pool to which a new issue is added, initially there will be a geographical inequality in the distribution of the coins. Slowly, as transactions and mixing takes place, these coins will have a wider and wider distribution. If there were no new injections of money then eventually the circulation pool would become more-or-less uniform, with the only variation in it being owing to random chance. The faster the velocity of circulation of coinage, the quicker this smoothing out would take place. However, the Roman monetary system was not generally stocked with single issues with long pauses in between: the system was far more dynamic with new types being minted virtually all the time. Once one issue had entered the system a new one would start, meaning a state of equilibrium in the circulation pool was never quite reached. Big new issues associated with campaigns would particularly create local distortions which might take some time to even out.Footnote 28
If coin hoards are a slice of the circulation pool, albeit selected by denomination, then their similarity to each other or dissimilarity would provide an index of the degree of irregularities in the pool. The ways we could interpret these observations would be:

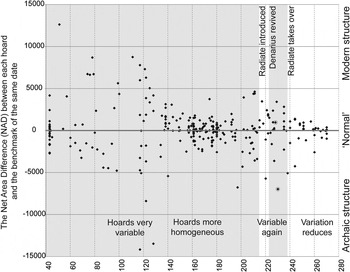
fig. 6 shows the variation in coin hoards over time. Each dot represents a single hoard. If it is above the line it has a more ‘modern’ structure than our ‘normal’ benchmark. If it is below the line it has a more ‘archaic’ structure (the Wigan and Falkirk hoards have been encircled). There are broadly as many points above as below the line which suggests that the benchmark is a reasonable approximation to what a ‘normal’ hoard would be.
The variation in the structure of denarius hoards over time.

The first and most striking observation is that there appears to be significant variation in the degree of similarity of hoards over time. If we had imagined the province gradually embracing coinage, monetisation and commodification, then we could have expected coin hoards to become more similar over time as more and more transactions took place evening out the differences in the circulation pool. However, this is not the case. If anything there is a reverse trend in the first century with hoards becoming more variable. Up to the late first century this is partly understandable in terms of the army. The location where coinage presumably entered circulation became increasingly distant from the southern part of the province, meaning it might take longer for new coin entering in the North to find its way, by means of exchange, down South.
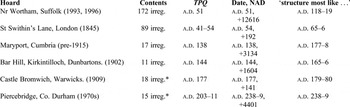
It is worth looking at some of the exceptions to the trend. An early exceptionally ‘modern’ hoard of a.d. 51 (NAD = +12616) came from near Wortham (Suffolk). However, it was not made up of genuine denarii but imitations. It included 168 irregular denarii of Claudius, and four earlier ones; this was at a time when other genuine contemporary hoards had hardly any Julio-Claudian denarii in them at all and were dominated by earlier Republican issues. So, oddly enough, it looks more like a hoard of the Trajanic period when the dominant tail of Republican issues in circulation fell significantly.
This pattern of the imitation denarii not reflecting the general population in circulation, but instead reflecting the latest issues to be released, is one which can be found if we look at the other ‘irregular’ denarius hoards (Table 2). In each case the ‘irregular’ components look as though they had very ‘modern’ structures. If a forger were attempting to fool then it is curious that the most common coins in circulation at the time were not chosen; though, unlike Claudian copies, it seems unlikely that irregular denarii were created for official use.
HOARDS CONTAINING LARGE NUMBERS OF IRREGULAR DENARII

* These hoards also contained genuine denarii
From about a.d. 120–50 hoards gradually become more homogeneous.Footnote 29 The province had stabilised roughly in its size so there is no major change in the distance between the northern frontier and the more urban southerly part. New coin continued to arrive, so the increasing similarity in the hoards suggests coin is moving around the province more rapidly, ironing out differences. It would appear the velocity of circulation is rising (though whether this is more transactions or the same number of transactions but of a higher value, we cannot know).
From the Antonine to the Severan period variability increases again. After Clodius Albinus' defeat by Septimius Severus near Lyon in a.d. 197 a new governor, Virius Lupus, was dispatched to Britain and he attempted to buy peace from the Maeatae for a large sum of money.Footnote 30 His arrival was followed by the emperor himself and his household in a.d. 208, along with ‘an immense amount of money’.Footnote 31 Severus campaigned in the North until his death at the close of a.d. 211. Some time in this period the province was also divided into Britannia Inferior centred on York and Superior based on London. If there was significant extra money injected into the North, this may have taken time to dissipate. Much will depend upon how military supply was organised. The division of the province may also have proved a hindrance to trade and exchange if portoria or customs dues between the provinces existed, though we have no evidence for that one way or the other.
In a.d. 215 Caracalla introduced the radiate, tariffed as a double denarius even though it only contained about one-and-a-half times as much silver. From this time on denarii rapidly diminished in circulation. Production of the radiate temporarily ceased after the first year of Elagabalus' reign, but was revived in a.d. 238 by Balbinus and Pupienus. The issue of denarii effectively ceased under Gordian III. With hardly any new denarii entering circulation, unevenness in the circulation pool gradually can be seen to disappear as we would predict.
ANALYSIS: GEOGRAPHICAL VARIATION
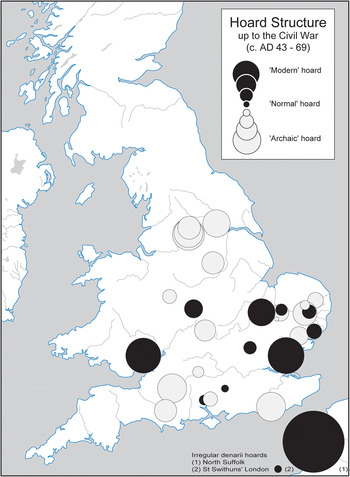
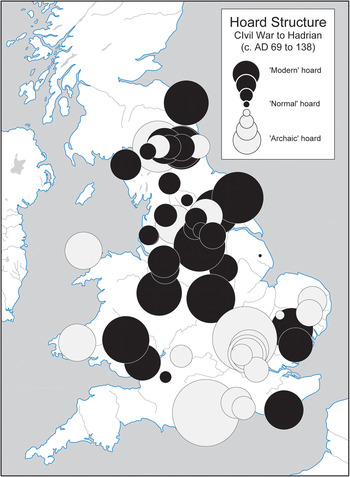
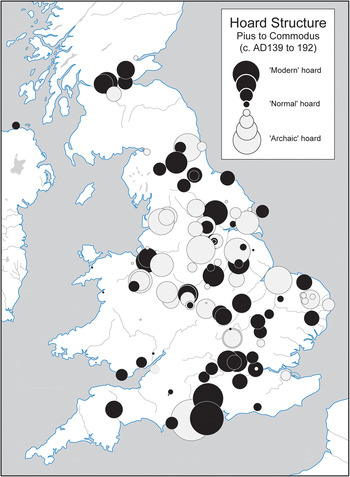
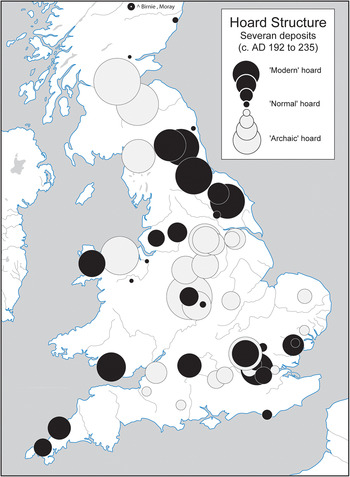
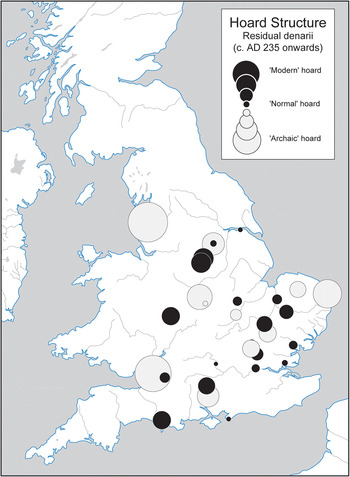
If military activity and the division of the province really had an impact on this picture, then we should be able to see it geographically. If new coin did first of all enter circulation where the army was present (even if it travelled via the governor's and procurator's residences in London or perhaps later YorkFootnote 32 ) then we should see this in more ‘modern’ hoards being in the military areas and more ‘archaic’ ones in the South-East. This next section divides up the picture in Britain into chronological segments based upon the discussion above and examines the data geographically. figs 7–11 plot each individual hoard spatially; the larger the circle, the more extreme the structure of the hoard, being ‘modern’ if black or excessively ‘archaic’ if white.
The structure of denarius hoards up to the Civil War c. a.d. 69.

The structure of denarius hoards a.d. 69–138.

The structure of denarius hoards a.d. 139–192.

The structure of denarius hoards a.d. 192–235.

The structure of denarii in hoards beyond a.d. 235.

NARRATIVE FROM THE CONQUEST TO THE CIVIL WAR, c. A.D. 69 (FIG. 7)
The picture from the early years of the province is complicated by both the rapid movement of the army through the country and also the issue of whether any of the early hoards were actually deposited before a.d. 43.Footnote 33
Considering what we know of Early Imperial Britain, money is likely to have arrived into the country in two main ways: payment by ‘the state’ — principally to the military and loans from Claudius — which is liable to be how new coin entered circulation; and secondly entrepreneurial activity by individuals such as Seneca, who had ten million denarii on loan to the foremost Britons.Footnote 34 Depending upon exactly where it was drawn from it may have had a mix more comparable to central Italy or other areas Seneca had financial dealings with. Given this it is not surprising that the most ‘modern’ are from Woodham Mortimer (a.d. 37–41), south-west of the legionary base at Colchester, and a hoard from Usk (a.d. 55–7) around the time of the foundation of the fortress there. However, it is curious to see how ‘archaic’ a lot of the hoards are from the ‘friendly kingdoms’ of the Iceni, Brigantes, and the central southern domains of Cogidubnus. If Roman aristocrats were sending their accumulated earnings on loan into these areas to these aspirational kings and queens, then it is also the kind of pattern we might expect.
NARRATIVE A.D. 69–138 (FIG. 8)
The period a.d. 70–138 covers the push north and the crystallisation of the frontier along the Tyne–Solway line. The general impression is of the majority of ‘archaic’ hoards being located in the South-East, well away from the military area. If hoards with less than ten denarii in them were excluded then this pattern would be even more apparent, since several of the larger Midlands ‘modern’ hoards would disappear (Lubbesthorpe a.d. 117; Upton a.d. 96; Outbridge a.d. 111).
In the early 70s all of Yorkshire came under direct Roman control and a major military centre was established at York. A series of forts was also occupied in East Yorkshire along the Brough-on-Humber to York road. It is during this period of high army presence that two hoards with relatively ‘modern’ structures can be found: York (a.d. 74) and Binnington Carr (a.d. 78). The more ‘modern’ structures appear to coincide with the presence of the army. Gradually the line of the frontier settled. Hadrian's Wall and its environs has seven tenths of hoards showing ‘modern’ structures. So a general pattern of ‘modern’ hoards where the army was located and relatively ‘archaic’ hoards elsewhere appears to be observable.
Surprisingly there is no sign of London as the provincial capital producing any great bias towards new coin around it. The procurator may have been based there, but new coin was not being released into general circulation here in any significant quantity, though that is not to say it did not travel to the army via London.
NARRATIVE A.D. 139–192 (FIG. 9)
As the variation in hoards reduces a very different picture emerges. Along the newly established Antonine Wall many of the hoards remain with marginally more ‘modern’ structures, but elsewhere in the province variation is significantly less suggesting money was moving around far more rapidly evening out variations in the circulation pool. No sooner were new Antonine denarii issued than they were dispersed across the province in a myriad of exchanges. London and the Thames Valley do perhaps have slightly more ‘modern’ hoards than elsewhere, but the difference could be easily displaced by a few more discoveries.
NARRATIVE A.D. 193–235 (FIG. 10)
In this period to a certain extent we get a re-emergence of the pattern of ‘modern’ hoards in the North with the military and ‘archaic’ hoards further to the south. London, one of the provincial capitals, has both ‘modern’ and ‘archaic’ hoards, but the presence of new coin inflowing here is not as consistent as around York and in the North-East. That difference suggests either that money is moving around a lot more slowly, or there is a significant increase in the amount of coin entering the system in the North that the existing rate of transactions cannot even out. I believe it to be largely a case of the latter.
The preponderance of recent issues in hoards in the North-East is most easily imagined as a result of the a.d. 208 arrival of the Severan Imperial household and the military. Based in York and campaigning beyond the Walls, the ‘modern’ hoards lie along the lines of communication. Another factor, as already suggested, may be the division of the province into two. This took place sometime after the fall of Clodius Albinus, though possibly as late as Caracalla's reign. The dividing line is slightly open to question, but it probably lay along the Mersey–Humber line, with Britannia Inferior containing VI Victrix at York and the colony at Lincoln, and Britannia Superior containing London, II Augusta at Caerleon, XX Valeria Victrix in Chester, and the coloniae at Gloucester and Colchester. If this reading is correct then there should really be just as much new coin entering into Britannia Superior with its two legions as into Britannia Inferior with its one. In which case the presence of the Imperial household becomes the key differentiating factor between the two provinces and probably had more to do with the preponderance of new coin in the North-East. The ‘modern’ hoards of Malton (a.d. 202), York (a.d. 210), Corbridge (a.d. 210), and Piercebridge (a.d. 211) all potentially date to this period.
Beyond the frontier there are few casual finds of Roman coin, suggesting it was not in general use, but coin hoards are still found. Of course, the Severan campaigns may be a context, but historically we also know of the subsidies paid by the governor to the Maeatae early in Septimius Severus' reign not long after a.d. 197.Footnote 35 This was part of a pattern of activity known from around various frontiers of the Roman Empire, particularly during the reigns of Marcus Aurelius and Commodus, though it is thought to decrease in the Severan period.Footnote 36
This pattern of alternating warfare and subsidies in the Antonine and Severan periods has meant that the interpretation of denarius hoards in Scotland has always been tightly tied to specific historical circumstances. This began with the discovery in 1934 of the massive Falkirk hoard containing c. 1,931 denarii. Its composition was immediately recognised as odd, dominated by earlier coin than its terminal date of a.d. 230 would normally have suggested. Its location next to the by then abandoned Antonine Wall made the hoard rich with possibilities of narrative story-telling, which indeed took place. George Macdonald thought it related to 120 years of thrift, the ‘family savings of four generations’.Footnote 37 Reece saw it as a Severan hoard with later additions, while Malcolm Todd thought it might equally have started as an Antonine hoard with substantial additions in the Severan period.Footnote 38 Like them, Robertson saw Falkirk and the contemporary Scottish hoards of Pitcullo (Leuchars, Fife), Cowie Moss (Kincardine, Fife), Megray (Kincardine, Fife), and Portmoak (Perth and Kinross) as indicative of a policy of buying peace.Footnote 39 More recent hoards, including the Edston (Peebleshire) and the two Birnie (Moray) hoards have meant discussion has certainly not dampened. Nick Holmes considered that both the Falkirk and Edston hoards ‘could have comprised payments made to local chieftains at around the conclusion of the military campaigns, to which a small number of later coins were added as a result of further payments being made. These payments … could have been part of a “buffer state” system, by which the Votadini of south-east Scotland were effectively employed by the Romans to provide advance warning of hostile action by the Maeatae’.Footnote 40
Looking at the phenomenon as a whole, Fraser Hunter examined all the reports of denarius hoards, including partial antiquarian records not included in this analysis, which suggested that overall there was an Antonine and Severan peak, with a few post-Severan hoards, suggesting a long-lived pattern of coin moving north.Footnote 41 However, by just selecting more modern finds with good data, the Antonine emphasis dwindled, perhaps because coins in earlier finds with Antoninus inscribed on them had been misidentified as all belonging to Antoninus Pius rather than the later Antonines or Caracalla.
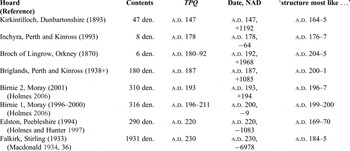
Now we have a benchmark against which to examine all of the well-identified hoards, it is worth looking at them afresh. Falkirk had a TPQ of c. a.d. 230; however its structure is exceptionally ‘archaic’. If we compare it with our benchmark curves of other dates, and not just a.d. 230, we find its closest match is c. a.d. 184–5 (even though we know it cannot have been deposited before a.d. 230). If we do this for all the hoards with good data from Scotland (Table 3), we can make the following observations:
HOARDS FROM SCOTLAND WITH GOOD DATA

First, the earliest hoards (Kirkintilloch, Broch of Lingrow and Briglands) all have a slightly higher proportion of new coin than one might suspect given their TPQ. It could be interpreted that they were drawn from a coin pool which had more freshly minted coin in it than the general circulation pool, which is what we might expect if they formed part of official subsidies. Certainly, none of these hoards look like earlier packages of coin which might have arrived during Antoninus Pius' reign. Secondly, and with some relief, the two Birnie hoards which were found so close together with very similar structures, do indeed still look as if they were contemporary. Their TPQ varied by 6–18 years (depending upon when the coin of Julia Domna was issued), whereas in structure they only appear to be about three years different. Thirdly, it is clear that both the Falkirk and Edston hoards are significantly ‘archaic’, suggestive of Marcus Aurelius' and Commodus' reigns rather than the late Severan era.
It seems that if, as Hunter suggests, pouches of coin were moving north as subsidies and being used as special purpose coinage rather than multi-purpose cash, then this was a phenomenon largely confined to later in Marcus Aurelius' reign, through Commodus' and just into the early part of Septimius Severus', until military campaigning took over as the primary means of engagement again. There is no particular evidence for Caracalla continuing the practice, though the occasional coin certainly must have still moved north to become incorporated into the later Edston and Falkirk hoards.
NARRATIVE: A.D. 235 ONWARDS (FIG. 11)
With the effective cessation of production and supply of new denarii, any major differences in the circulation pool of the coin would gradually even themselves out, so it is not unexpected that we no longer find any geographical trends.
THE ROBUSTNESS OF THE DATA
It is appropriate to ask how robust the chronological and geographical picture is. Would a few more hoards change it substantially? How much do the size of hoards and the inclusion of some as small as five coins affect the data?
In terms of the number of hoards, this article is actually a reworking of a much earlier analysis which was based on only 125 hoards (with sufficient detailed data) compiled back around 1990;Footnote 42 as additional hoards were discovered and published the picture was updated in 1999 and again for this article in 2009, now with 287 hoards. The patterns revealed have remained broadly similar; if anything the new finds have simply reinforced the general trends.
In terms of the size of hoards, it is true that hoards as small as five coins are more likely to have an errant TPQ, with a falsely early terminal date, and therefore they might show up as having a falsely ‘more modern’ structure. This can be seen to be the case if the number of denarii is plotted against the ‘Best NAD value’ in Appendix 1. Here there is a slight trend for these smaller hoards to be seen as being more ‘modern’ than they perhaps should, but the variance was only marginally greater than those with 10 coins or 20. Also, when examined geographically they tended to follow the same trends as the larger hoards. So they have been included. The data could easily be plotted with the threshold set higher, but it is very likely the picture would look similar.
ANALYSIS: MULTIPLE DEPOSITS
One final phenomenon worth exploring is if this technique of analysing structure gives us any insights into multiple deposits. Mention has already been made of the two more-or-less contemporary hoards at Birnie found 10 m apart, but there are also many other sites where multiple hoards are found. This is a phenomenon known from the later Iron Age (e.g. the multiple hoards at Hallaton (Leics.)Footnote 43 ) and into the Roman period.Footnote 44 But are these multiple hoards deposited over a long period, or hoards which though they might have a different TPQ, are actually probably contemporary (as at Birnie)? This has implications for the interpretation of them as votive ritual deposits. Do they represent one-off events of multiple hoards being buried, or a location which has seen offerings placed into the ground over a longer term? Sometimes the deposits can all be of one date representing a one-off act, such as the hoards of radiates from Beachy Head (Sussex), found in 1879, 1899, 1914, and 1961–73.Footnote 45 But sometimes they have a spread of terminal dates suggesting sustained activity over time.
Two examples from Edlington Wood and Darfield will be used to illustrate this. In both cases there were multiple radiate hoards deposited, some including denarii, others not. However, in each case additional packets of denarii were found alone ending with some of the latest denarii to be minted. The question therefore is ‘were the packets of denarii buried at an earlier date, or when the multiple radiate hoards were concealed?’
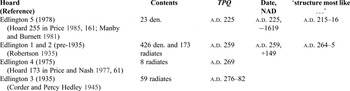
Four radiate hoards were found at Edlington Wood, all of them dated to around the a.d. 260s (Table 4). In addition there was also a small package of 23 denarii, which had a nominal TPQ of c. a.d. 225. Was it possible that these were a batch of later denarii which had a false TPQ, because of the small number of denarii within it? Actually that would appear to be unlikely. The early ‘Edlington 5’ hoard really does look earlier in date, not only having a TPQ of a.d. 225, but also having a structure more akin to hoards a decade earlier. In this case it would appear that hoards were being deposited at this site over a span of 50 years.
FIVE HOARDS FROM EDLINGTON WOOD, NEAR DONCASTER

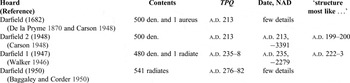
In the case of Darfield there was a late radiate hoard, but also three earlier third-century hoards each with about 500 denarii (Table 5). Given their similarity of size (excluding the fact that one contained an aureus), could they have been contemporary deposits? Alas, good details only exist for the 1947 and 1948 finds. Both had TPQ dates differentiating by 22 to 25 years, and broad structural dates differing by 23 years, so contemporary deposition seems unlikely. The site really does show a long sequence of deposition over at least a 65-year period and is all the more strange for each deposit having around 500 coins within it (even if the later ones were debased radiates).
FOUR HOARDS FROM DARFIELD, SOUTH YORKSHIRE

HISTORICAL CONCLUSION
The army clearly appears to be the key location where hoards contain more recent coin, and therefore where new issues entered circulation; that in itself is not particularly surprising. What is more interesting is first, the significant variation over time in the similarity and difference of hoards across the province, which will relate to changes in the velocity of circulation of the coin; and secondly, the failure of London, the provincial capital, to show up consistently as the entry point of new coin.
The pattern of denarii entering in the North reinforces the observation made by Philippa Walton from Portable Antiquities Scheme data that the denarius is relatively more common, compared with bronze denominations, in the military areas outside the South-East. She also noted that the vast majority of documents from Vindolanda with monetary information in them valued things in denarii and not in the more common unit of account, sestertii.Footnote 46
The changes in the speed at which denarii moved around the province do not indicate the consistent growth which slow progressive monetisation and commodification might have engendered. If coin was being used for more and more types of expenditure as the cash-economy grew, then the same stock of coin would have to work harder, moving around more rapidly. Of course price changes and the total number of denarii in circulation would also have a significant bearing.Footnote 47 Factors which need to be taken into consideration include how much of the supply of the army was in kind (which would generate little flow of coinage), and how much was procured through the developing market. The Vindolanda tablets, dating in the main to the late first to early second centuries a.d., suggest hides and wheat were certainly being bought on a significant scale,Footnote 48 though curiously this was still a time when coin was apparently moving sluggishly according to this model. A next step in research would be to correlate the flows of coin with interpretations of the procurement of the Roman army.
The failure of London to show significantly and consistently suggests that direct Imperial benefaction in the provincial capital did not lead to the distribution of any solid new coin there. If new coin did arrive at the procurator's office, it was probably stored and directly shipped to where the army was, as and when it was needed. It was evidently more important to reveal and reinforce the image of the new emperor to the military than to the entrepreneurial freedmen, local traders, artisans and developing Romano-British aristocracy resident in London. It would seem that the pay of the staff in the governor's and procurator's offices and of the resident garrison in Cripplegate was not sufficient to register in the larger flow of cash moving in and out of the city in London's commercial activity. Perhaps the provincial administration was predominantly funded from recycled coin gathered in through taxation in the province itself? Perhaps the provincial capital was one of the few locations so integrated into the cash economy of the province as a whole that new coin rapidly flowed out away from it in a myriad of transactions. These are the sorts of questions where a larger study of denarii across the Empire is needed, to see if any provincial capitals show, and to see if the ebb-and-flow of coin in Britain follows general trends, or whether episodes such as the Severan visit and campaigns make Britain appear different to other provinces at the time.
Finally, the method developed is not just applicable to the Roman world, but is directly transferrable to entirely separate monetary systems in time and space.
APPENDIX 1. COIN HOARDS FROM BRITAIN CONTAINING MORE THAN FIVE DENARII WHERE DETAILS EXIST
Full bibliographic data and in some cases the original data can be found in the corpus reference. References of recent finds are designated by the year and the British Museum-assigned Treasure number, e.g. 2007(T677); prior to that reference is made to the Coin Hoards from Roman Britain series by British Museum Press (vols 8–10), The Royal Numismatic Society (vol. 11) and Moneta (vol. 12), e.g. CH12(05); finds up to the mid-1990s were neatly summarised with full bibliographic information in the inventory by Robertson (Reference Robertson, Hobbs and Buttrey2000), e.g. R055; however some earlier hoards were missed and/or very occasionally I came to a different conclusion about which coins to include or exclude from hoards based on the coroner's reports, so occasional references are also made to hoards in the author's doctoral thesis, e.g. C256 (Creighton Reference Creighton1992). The data attempt to be comprehensive up to c. 2009. (* hoard with closing coin earlier than a.d. 43)

APPENDIX 2. THE DENARIUS PERIOD GROUPS

APPENDIX 3. THE BENCHMARK

ACKNOWLEDGEMENTS
The idea for this article originated during my PhD supported by my supervisor, John Casey. The updating of the data would never have been possible without the assistance of various individuals over the years in the Department of Coins and Medals, British Museum and the development of the Portable Antiquities Scheme; and also the continued encouragement of Richard Reece.