An introduction to thin-film science and technology
David Turnbull worked with three-dimensional (3D) bulk materials. Being a generation younger, I worked with thin films and two-dimensional (2D) interfaces. My PhD thesisReference Neckel and Wagner3 and postdoctoral researchReference Wagner and St. Pierre4 were part classical metallurgical thermodynamics and part properties of refractory materials, the latter an upshot of the US space program. I measured the thermodynamics of alloys and observed phase transitions in solids using high-temperature mass spectrometry, a technique that I learned at the Université libre de Bruxelles in Belgium.Reference Drowart and Goldfinger5
A Knudsen effusion cell that can be heated up to 2500 K is flanged onto a mass spectrometer, which analyzes the masses and ion currents of species that effuse from the cell. Working with Knudsen cells teaches the kinetics of gases as well as the distinction between equilibrium and kinetically controlled phenomena. Combining high temperatures and high vacua with sophisticated electronics, these instruments pushed the limit of equipment that a single PhD student could handle; they were forerunners of molecular beam epitaxy.Reference Cho6 By requiring an understanding of vacua,Reference Dushman7 radiation,Reference Pepperhoff8 and molecular beams,Reference Smith9 plus inculcating skills in identifying and fixing leaks and electrical shorts or open circuits, my PhD thesis and postdoctoral research taught me the fundamentals and the practice of growing thin films. While continuing thermodynamic research at Ohio State,Reference Wagner and St. Pierre4 from the outstanding faculty in its (then) Department of Metallurgical Engineering, I learned the basics of point and line defects in solids, and saw for the first time the value of scientific collaboration.Reference Hirth, Pieraggi and Rapp10
Learning to make semiconductor devices
A chance encounter with a recruiter from Bell Labs led to an employment offer. In August of 1970, I in effect entered my second postdoctoral program at Bell Labs, which taught me about semiconductors. At the time, ion implantation into silicon was studied as a quantitative doping technique. No method existed for measuring the chemical concentration of a dopant in silicon (now done by secondary ion mass spectrometry); instead, one measured the electrical conductance and converted it to the density of ionized dopants by assuming an appropriate carrier mobility. This approach would not see inactive dopants. My supervisor suggested that I study ion implants of boron into siliconReference Wagner11 using charged-particle activation analysis at the Rutgers-Bell Van de Graaff accelerator. A physicist visiting from London was my mentor.Reference North and Lightowlers12
In October of 1970, Intel announced the imminent commercialization of its 1024-bit dynamic random-access memory (DRAM) chip. Using a three-transistor cell, the chip was the first practical large-scale (meaning more than 100 transistors) integrated circuit. This shocked Bell Labs into a crash program for developing its own first large-scale integrated circuit, a 1024-bit DRAM of Dennard-type one-transistor cells.Reference Boll and Lynch13 To reach that goal fast, a matrix organization was set up. I was lucky to go on the team that developed the fabrication process for a reproducible and stable Si/SiO2 insulated-gate field-effect transistor (IGFET or MOSFET). This MOSFET had been invented 10 years earlier at Bell Labs.Reference Kahng and Atalla14
The value of collaboration
I knew and admired David Turnbull. He was a gentleman and a scholar.1 Turnbull’s work on phase transformations forms part of the foundations of materials science.Reference Turnbull2 Our lives have many parallels. David Turnbull grew up on a farm in Illinois, earned a PhD degree in physical chemistry from the University of Illinois at Urbana-Champaign, joined the faculty of the Case School of Applied Science in Ohio, then worked at the General Electric Research Laboratory, and finally went on to a long career at Harvard’s Division of Engineering and Applied Physics. I grew up in a farm town in Austria, received a PhD degree in physical chemistry at the University of Vienna, came to the United States for postdoctoral studies at The Ohio State University, and then was hired by Bell Labs, where I worked at the Murray Hill and Holmdel, N.J., locations. I moved to Colorado to organize the Photovoltaic Research Branch of the Solar Energy Research Institute, now the National Renewable Energy Laboratory. In 1980, I joined the Department of Electrical Engineering at Princeton University. David Turnbull’s and my stages of working at large industrial research laboratories impressed on us how much fundamental research and practical development can blend, and how fertile collaborations between different disciplines can become.
A MOSFET is an interface-controlled device. Remembering the difficulties encountered in stabilizing the surfaces of the early germanium bipolar transistors, Bell Labs management had shied away from MOSFETs. They believed that the low production yields of discrete transistors would compound to zero yield of a circuit made of many transistors integrated on a single chip.Reference Riordan15 The crash program put me right in the middle of a feverish search for a clean SiO2 gate dielectricReference McCaughan, Kushner and Wagner16 and for reproducible and controllable Si/SiO2 capacitance-voltage characteristics.Reference Wagner and Povilonis17,Reference Wagner and Povilonis18 To me, this program meant a crash course in device fabrication and semiconductor electronics. Thus, I participated in the beginning of the integrated circuit (IC) revolution when the design rule, the smallest dimension that can be transferred from a mask to an IC, was 10 µm and the largest circuits contained a few 1000 transistors. Today’s ICs contain tens of billions of transistors, made with design rules of ∼10 nm.
New solar cells
Learning silicon device technology had made me—unwittingly—an expert in device fabrication. That brought me to an internship at Bell’s Holmdel Lab, in a group that wanted to explore device applications of a new class of semiconductors with the chalcopyrite structure.Reference Goryunova19,Reference Berger and Prochukhan20 The group had been studying the growth and physics of these diamond-like ternary compound semiconductors, which are isoelectronic with the Group IV elements.Reference Tell, Shay and Kasper21,Reference Shay and Wernick22 Using my background in thin-film technology and device fabrication, I made the first junction device with a chalcopyrite, the green light-emitting n-CdS/p-CuGaS2 heterojunction diode.Reference Wagner, Shay, Tell and Kasper23
Making and detecting light with semiconductor devices were important research subjects at the time and remain important today. In the early 1970s, the search was on for efficient green and blue light-emitting devices, and even more so for semiconductor lasers and photodetectors. As the quality of glass fibers improved their optical transmittance kept rising,Reference Kapron, Keck and Maurer24 making the advent of fiber-optic communication more and more likely. Simultaneously, the increasing efficiency and operating life of GaAs/(Al, Ga)As double heterojunction lasers made them plausible as emitters for fiber optics.Reference Kressel, Nelson and Hawrylo25,Reference Panish and Hayashi26 Because the chalcopyrite CuInSe2 absorbs light strongly above its direct energy bandgap of 1.01 eV, it was a candidate for a fast light detector. Indeed, the n-CdS/p-CuInSe2 photodiode turned out to have a surprisingly high quantum efficiency over its entire windowReference Wagner, Shay, Migliorato and Kasper27 between the bandgaps of CdS (2.42 eV → λ = 0.51 μm) and CuInSe2 (1.01 eV → λ = 1.23 μm) (Figure 1).
Spectral dependence of the absolute photovoltaic quantum efficiency for a CuInSe2/CdS heterojunction (solid curve) and, for comparison, the response of commercial Si detectors (dashed curve).Reference Wagner, Shay, Migliorato and Kasper27 The high quantum efficiency over a large range of wavelengths suggests a large solar-cell photocurrent. Note: E g, bandgap energy.

The 1973–1974 oil embargo raised concerns about the US reliance on imported energy and stimulated interest in exploiting renewables for energy independence. By applying an in situ deposited antireflection coatingReference Shay, Wagner and Kasper28 and increasing the open-circuit voltage and the fill factor, we reached a power-conversion efficiency of 12%. The 12% efficient n-CdS/p-InP heterojunction solar cellsReference Wagner, Shay, Bachmann and Buehler29 made shortly thereafter raised our group’s worldwide share of solar cells with higher than 10% power-conversion efficiency to two out of four, with the other two being the siliconReference Chapin, Fuller and Pearson30 and the GaAsReference Gobat, Lamorte and McIver31 cells. Because the (111) plane of InP and the (001) basal plane of wurtzite-structure CdS are nearly lattice-matched, we put great hope in achieving a highly efficient polycrystalline thin-film CdS/InP cell. However, in contrast to the fairly ionic character of the bonds in CuInSe2, the In–P bond is sufficiently covalent to result in deep-lying electronic defects when broken; these impair solar-cell performance. Other experimental solar cells included the quaternary semiconductor Cu2CdSnS4,Reference Wagner and Bridenbaugh32 a forerunner of today’s cells made of earth-abundant elements, and a photoelectrochemical heterojunction cell.Reference Wagner and Shay33 The 81/2 year long period at Bell Labs turned me into an expert in thin-film electronicsReference Jain, Wagner and Olson34,Reference Mohapatra, Boyd, Storz, Wagner and Wudl35 and taught me much device physics. Working at Bell Labs convinced me of the value of interdisciplinary collaboration.
Amorphous silicon
The newly founded Solar Energy Research Institute (SERI, now the National Renewable Energy Laboratory [NREL]) was to be built on a horse pasture in a suburb of Denver. SERI’s founding in 1977 coincided with economic difficulties in the US, which engendered the first cutbacks in industrial research laboratories. I viewed the opportunity of organizing SERI’s photovoltaic research branch as possibly the last chance for building a new solid-state electronics laboratory from scratch. The early years at SERI were heady times—we scientists and engineers who joined SERI felt like pioneers. For my part, I soon recognized that managing a research department in a government-sponsored organization was a full-time job. At Bell Labs, heads of research departments had sufficient time to conduct their own projects. Because I always have been fascinated by how things work and how to make them work, more than by managing an organization, I opted for science over administration and joined Princeton University in September of 1980.
While preparing courses in solid-state and optoelectronics, I also set up a laboratory for solar-cell research. My goal was to raise the power efficiency of the CdS/CuInSe2 cell to 16% (the CdS/Cu(In,Ga)Se2 [CIGS] cellReference Green, Emery, Hishikawa, Warta, Dunlop, Levi and Ho-Baillie36 has attained 21% efficiency). The Electric Power Research Institute (EPRI), a joint organization of electric power companies, supported a long-term program on hydrogenated amorphous silicon (a-Si:H) solar cells. EPRI’s goal was to reach a cost and performance as formulated by EPRI’s quantitative evaluation of photovoltaics for utility-level electricity generation.Reference DeMeo and Taylor37 The conclusions of that study remain valid today—realistically achievable combinations of photovoltaic system cost and power efficiency can generate electricity at competitive prices.
a-Si:H formed the core of my research for a decade, and both the materialReference Chittick, Alexander and Sterling38 and solar cellsReference Carlson and Wronski39 made from a-Si:H were fascinating research subjects. The cells promised to reach EPRI’s goal, because their strong absorption of sunlight enabled the design of thin cells hence at a low semiconductor cost. Unfortunately, a-Si:H solar cells never reached adequate efficiency, and their performance degraded with exposure to sunlight. For a long time, these characteristics were attributed to suboptimal amorphous structures, thought to depend on the particular techniques employed for a-Si:H film deposition. The low mobilities of the charge carriers were understood as the result of barely extended transport in the Anderson–Mott picture. The mobilities are reduced further by trapping and emission in and from deep states in the bandgap, originating in Si–Si bond distortion and breaking.Reference Street40 The high density of these deep states also constrains the solar-cell efficiency to 10%. When light falls on the cell, the density of Si dangling bonds, to which the midgap states are linked, increases and thereby causes the cell efficiency to drop. This drop took much work to understand.
Above ∼200°C, the dangling bonds are in thermodynamic equilibrium with the strained Si–Si bonds and with the charge carriers.Reference Smith, Aljishi, Slobodin, Chu, Wagner, Lenahan, Arya and Bennett41 Raising/reducing the temperature raises/reduces the density of dangling bonds:
 $${\rm{Si}} \bullet \bullet {\rm{Si}}\,{\rm{(strained\ bond)}} \leftrightarrow 2\,{\rm{Si}} \bullet \,({\rm{neutral}}\,{\rm{dangling}}\,{\rm{bonds}}).$$
When charges (electrons [•] in this example) are added by doping,Reference Street42 by illumination,Reference Staebler and Wronski43 or in the channel of a field-effect transistor (FET), the electrons lower their energy by falling into neutral dangling bonds:
 $$2\,{\rm{Si}} \bullet \,{\rm{(neutral}}\,{\rm{dangling}}\,{\rm{bonds)}}\,{\rm{ + }}\,{\rm{2}}\, \bullet \, \leftrightarrow \,{\rm{2}}\,{\rm{Si}} \bullet \bullet \,{\rm{(negative}}\,{\rm{dangling}}\,{\rm{bonds)}}.$$
In response, more strained bonds break to form more dangling bonds. Below ∼200°C equilibria (1) and (2) are frozen. The freeze in of the dangling-bond density is evident from the optical absorption spectra measured by the constant photocurrent method (CPM) (Figure 2a). The CPM absorption coefficient around 1.0 eV photon energy is dominated by excitation of electrons from dangling-bond states. The spectra show that a sample cooled quickly (at 200°C/min) has a higher dangling-bond density than more slowly cooled samples. (The absorption spectra measured by photothermal deflection spectroscopy do not show the quench-rate effect because they are dominated by surface states.) Figure 2b shows calculated dangling-bond densities for a hypothetical fully equilibrated sample,  $N_S^{eq} $, and for samples quenched at the rates of Figure 2a. At room temperature, dangling bonds produced by sunlight-generated charge carriers do not heal (going from right to left in Equations 2 and 1) in the dark. Likewise, the dangling bonds generated by electron accumulation in the channel of an a-Si:H thin-film transistor (TFT) do not anneal out after the electrons are drained from the channel. Were it not for the freeze in of the dangling bond density, a-Si:H would be a perfect material for thin-film solar cells, with high initial efficiency and no loss during operation.
(a) Optical absorption spectra of a-Si:H samples cooled at three different rates. At low photon energies, the increased absorption visible in constant photocurrent measurements (CPMs) at 200°C/min quench rate is evidence of a high density of dangling bonds. Photothermal deflection spectra (PDS) are dominated by high densities of surface states, hence are insensitive to density changes in the bulk. (b) Calculation of the temperature-dependent, equilibrium, silicon dangling-bond density  $N_{\rm{S}}^{{\rm{eq}}}$, and of its dependence on cooling rate.Reference Smith, Aljishi, Slobodin, Chu, Wagner, Lenahan, Arya and Bennett41

Research on a-Si:H solar cells stimulated exploring other applications for a-Si:H, including in photodiodes,Reference Novo, França Prazeres, Chu and Conde44 tunable filters for optical communications,45 and microelectromechanical resonators.Reference Mouro, Chu and Conde46 By far the most important became the a-Si:H FETReference Madan, Le Comber and Spear47,Reference Le Comber, Spear and Ghaith48 that uses SiN:H as the gate insulator. Deregulation of the US electric power industry around 1990 caused EPRI to concentrate its research support on immediate needs of the industry and to gradually reduce its support for photovoltaic research. This gradual transition gave us room for changing the research focus to the a-Si:H TFT, which was becoming the switch that enabled flat-panel displays to move from passive-matrix grayscale to active-matrix color displays. a-Si:H TFTs became our vehicles for research on the additive printing of thin-film electronics, which then led to flexible, conformal, and stretchable electronics.
TFTs
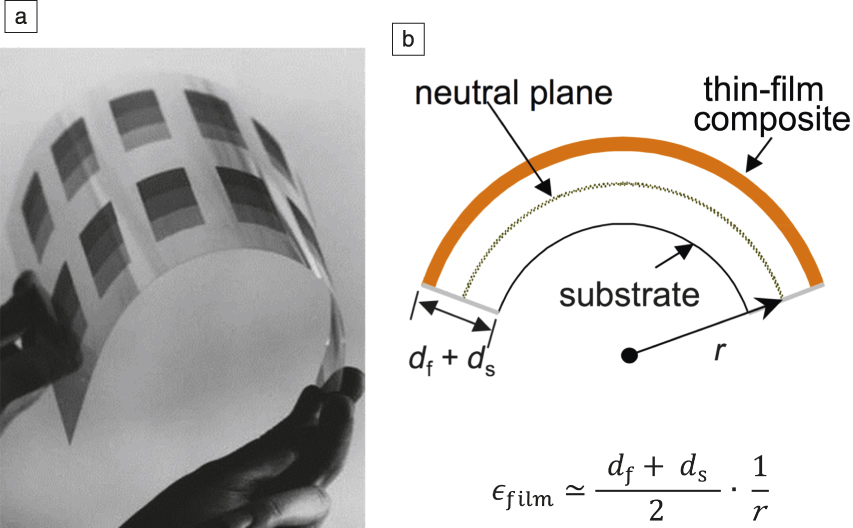
The TFT backplanes of flat-panel displays are designed by classical microfabrication techniques, expanded to substrate sizes of up to 10 m2. These fabrication processes are subtractive—a device layer is deposited over the entire substrate, and is then patterned by area-selective stripping of part of the deposited material. The display market grows rapidly when display prices drop. The desire to reduce cost has stimulated research on the additive printing of patterned device layers. Eventually, costs may drop to USD$10/m2, or possibly come even closer to those for high-quality multicolor printing on paper.Reference Rieutort-Louis, Sanz-Robinson, Moy, Huang, Hu, Afsar, Sturm, Verma and Wagner49 To reduce process cost, we explored the printing of electrophotographic toner masks for TFT fabrication. These experiments required using substrates flexible enough to be fed into a xerographic printer (Figure 3a).
(a) Glass foil with an etch mask of electrophotographically printed toner. The foil is page-size and 50-µm thick.Reference Gleskova, Wagner and Shen50 (b) A simple technique for setting a defined strain εfilm in a film is to bend its substrate of known thickness to a radius of r.Reference Gleskova, Wagner and Suo59 Note: d f, film thickness; d s, substrate thickness.

We used glass foil to survive TFT processing experiments at high temperatures.Reference Gleskova, Wagner and Shen50 The sample shown in Figure 3a turned out to be a precursor of today’s roll-out displays made on glass foil.51 In a stimulating collaboration, we explored the fundamentals of printing defined patterns of liquids,Reference Darhuber, Troian and Wagner52 developed inkjet-printed copper metallization,Reference Hong and Wagner53,Reference Cuk, Troian, Hong and Wagner54 and made surface-controlled microfluidic devices.Reference Chen, Darhuber, Troian and Wagner55 Because commercial printers needed flexible substrates, we studied the effects of bending and rolling on TFTs. By quantifying the geometric/mechanical boundaries for TFT deformation, these experiments went beyond earlier demonstrations of flexibility and opened a new arena for active thin-film electronics.
Flexible, conformable, and stretchable electronics
The intriguing flexibility of very thin glass (Figure 3a) and even more so of steelReference Theiss and Wagner56 and polymer foilReference Gleskova and Wagner57 substrates for TFT backplanes triggered the question of whether foldable map-like displays can be made. Using a-Si:H TFTs on thin substrates as the test vehicle, in another rewarding collaboration, we explored and quantified the conditions for the bending, rolling, and folding of thin-film electronicsReference Suo, Ma, Gleskova and Wagner58,Reference Gleskova, Wagner and Suo59 (Figure 3b). Thin-film electronics are fabricated flat. By plastically deforming flat 2D circuits, my colleague J.C. Sturm made doubly curved 3D structures,Reference Hsu, Bhattacharya, Gleskova, Huang, Xi, Suo, Wagner and Sturm60 and identified the conditions under which the substrate can be deformed while electronic devices on the substrate are insulated from mechanical strain.Reference Hsu, Huang, Xi, Wagner, Suo and Sturm61 A substrate carrying devices (including 3D structures) can undergo large deformation as long as the devices are protected, typically by sitting on a rigid or elevated platform. While liquid crystals are not easily incorporated in foldable structures, organic light-emitting devices (OLEDs) (which were in rapid development at the time) are 2D thin-film structures and respond to mechanical deformation like TFTs. OLEDs deposited on rigid electrodes remain intact when their substrate is deformed to a spherical cap.Reference Bhattacharya, Wagner, Tung, Esler and Hack62 A TFT-driven (“active”) OLED pixel made on a steel foil was bent during operation.Reference Wu, Theiss, Gu, Lu, Sturm, Wagner and Forrest63 Many other thin-film transducers can be made on deformable substrates, including sensors for light, pressure (including sound),Reference Graz, Kaltenbrunner, Keplinger, Schwödiauer, Bauer, Lacour and Wagner64 and mechanical strain.
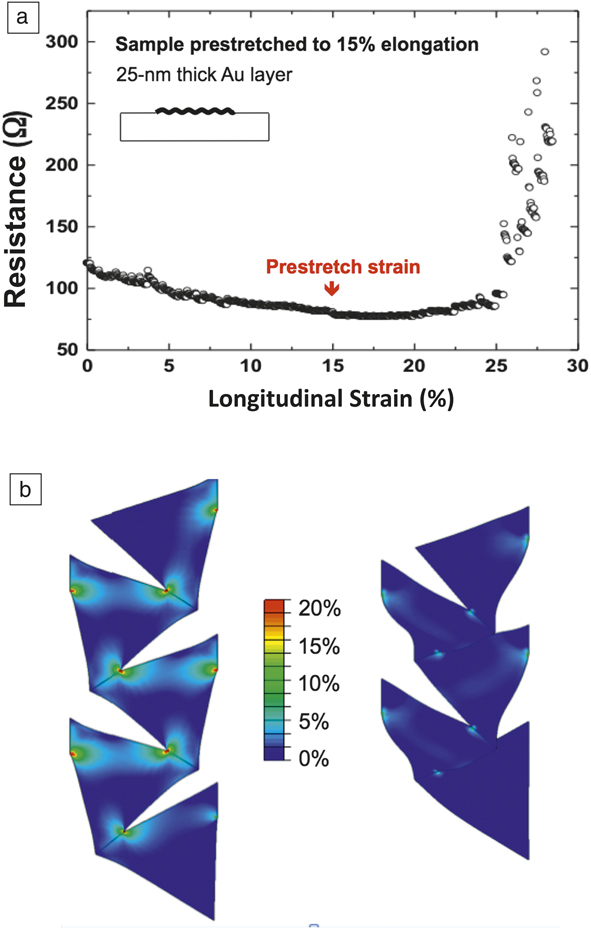
A 1999 workshop on sensitive skin sponsored by the National Science Foundation (NSF) and Defense Advanced Research Projects Agency (DARPA) raised the challenge of making humanoid elastic sensing skin for robots.Reference Lumelsky, Shur and Wagner65,Reference Lumelsky, Shur and Wagner66 Experiments with thin-film gold conductors prepared on a membrane of the elastomer poly(dimethylsiloxane) (PDMS) produced two simultaneous discoveries, one anticipated and the other a surprise.Reference Lacour, Wagner, Huang and Suo67 Like many hard materials, gold conductors (having low coefficients of thermal expansion) often are under compression when deposited by thermal evaporation on soft substrates (high coefficients). The gold partially relaxes by forcing the underlying substrate to form an out-of-plane wave. Stretching the PDMS substrate flattens the wave; the gold remains conducting. Today, in-plane or out-of-plane waves are introduced on purpose to make stretchable conductors and even stretchable active devices.Reference Sekitani and Someya68,Reference Kim, Lu, Huang and Rogers69 The surprise discovery was that the gold stripes remained electrically conducting when stretched far beyond their critical bulk strainReference Lacour, Wagner, Huang and Suo67 (Figure 4a).Reference Lacour, Jones, Suo and Wagner70 Understanding the mechanism of this effectReference Lacour, Wagner, Li and Suo71 led to designing conductors that are patterned such that they can deform out-of-plane without breakingReference Vanfleteren, Gonzalez, Bossuyt, Hsu, Vervust, De Wolf and Jablonski72 (Figure 4b). The ability to pattern electrodes and interconnects on soft substrates initiated the development of devices that are mechanically matched to biological tissue.Reference Yu, Graudejus, Tsay, Lacour, Wagner and Morrison73–Reference Minev, Musienko, Hirsch, Barraud, Wenger, Moraud, Gandar, Capogrosso, Milekovic, Asboth, Fajardo Torres, Vachicouras, Liu, Pavlova, Duis, Larmagnac, Vörös, Micera, Suo, Courtine and Lacour75
(a) Variation with tensile strain of the electrical resistance of an initially wavy 25-nm-thick gold stripe deposited on a poly(dimethylsiloxane) substrate. The gold conducts well above the strain of 15% that stretches it flat. (b) Model of a foil patterned with tri-branched cuts when stretched while (left) confined to be flat or (right) allowed to deflect out-of-plane. Deflection greatly reduces the strains in the film. Color scheme indicates the level of the larger principal strain in percent.Reference Lacour, Wagner, Li and Suo71

Large-area electronic systems
Additive printing may enable large integrated sensor arrays at the cost of decorative wallpaper. My colleagues N. Verma and J.C. Sturm have been exploring such sensor surfaces. They combine the advantages of large active integrated sensor arrays made in (slow) thin-film technologies, with the high speed of complementary metal-oxide-silicon (CMOS) circuits.Reference Verma, Hu, Huang, Rieutort-Louis, Sanz-Robinson, Moy, Glisic, Wagner and Sturm76 The program ranges from designing architecture, subsystems, circuits, and devices, to fabricating everything from circuits (except CMOS) on plastic foil, to assembling complete system demonstrations. The program has two goals. One is to explore the optimal allocation of functions between the thin-film and the CMOS domains. The other goal is to explore the application space of large-area sensor arrays.
Large-area electronics (LAE) will be a core component of the Internet of Things, as it will provide physically integrated sensing at high sensor density and over large surfaces. LAE will complement vision-based, remote sensing. Both LAE and remote sensing will use deep learning to associate data with human environments and intentions. Vision-based sensing identifies objects that move through a field of view. The object must first be sensed and then detailed in a number of steps of increasing specificity. This process requires long training times and large amounts of training data. LAE, on the other hand, being embedded in physical objects, will provide data that are specific to these objects, which enables quick learning with robust results. For example, a household robot with artificial intelligence will enter a room and survey it by machine vision. As the robot moves toward its owner, its elastic LAE sensor skin will feel that it brushes against the owner’s clothing. Fusion of deep learning with real-time data from vision and LAE sensing will tell the robot that its owner wants afternoon tea now. The robot will go to the kitchen to prepare tea then return to serve it. The LAE sensor skin enables the robot to take great care of the heirloom porcelain. Imagining the functions of a household robot illustrates how a highly integrated LAE research program pushes the frontier in many directions, notably by introducing advanced signal processing techniques to the thin-film domain.Reference Ozatay, Aygun, Jia, Kumar, Mehlman, Wu, Wagner, Sturm and Verma77 Its conceptual scope and technological reach would be unattainable by a single researcher. The progress this program has been making to date again demonstrates the value of interdisciplinary collaboration.
Acknowledgments
I would like to thank the many teachers, mentors, colleagues, and students that helped my research over the years. I am particularly grateful to D. Neckel, R.A. Rapp, and to J.C. Sturm.

Sigurd Wagner is professor emeritus and senior scholar in the Department of Electrical Engineering at Princeton University. He received his PhD degree in physical chemistry in 1968 from the University of Vienna, Austria, and was a postdoctoral fellow at The Ohio State University. From 1970 to 1978, he worked at Bell Labs, and from 1978 to 1980, at the Solar Energy Research Institute (now National Renewable Energy Laboratory) as the founding chief of its Photovoltaic Research Branch. Since 1980, Wagner has been professor of electrical engineering at Princeton University. He is a Fellow of the American Physical Society and of the Institute of Electrical and Electronics Engineers, and a corresponding member of the Austrian Academy of Sciences. He is an Alexander von Humboldt Foundation Senior Fellow, he received the 2009 Nevill Mott Prize, the 2014 ITC 10th Anniversary Prize, and the 2017 MRS David Turnbull Lectureship. Wagner can be reached by email at wagner@princeton.edu.