

1 Introduction
The area of an isosurface in a turbulent flow reflects the instantaneous balance between advection, which stretches and compresses an isosurface, diascalar diffusion, which smooths an isosurface, and possibly the effects of other phenomena such as chemical reaction. This is true whether the scalar is passive or active. Thus an isosurface area is a composite measure that is of fundamental interest because of what it can tell us about fluid turbulence. Our motivation here is the general question of how an isosurface area changes with Reynolds and Schmidt numbers, but let us first consider several applications requiring knowledge of an isosurface area.
A principal motivation for understanding isosurfaces is combustion modelling. In both premixed and non-premixed combustion, the rate of chemical reaction depends on the volume in which the species concentrations and temperature are suitable for reaction. It also typically depends on the mass flux of one scalar through an isosurface of another. Calculating either of these quantities is a generalisation of the problem of finding the area of one or more isosurfaces (Pope Reference Pope1988; Kim & Bilger Reference Kim and Bilger2007). It is, however, impossible to resolve isosurfaces in simulations that are practicable for the design of combustion devices and so these quantities must be parametrised. One avenue of parametrisation is via the isosurface area-to-volume ratio as a function of flow parameters including the Reynolds, Schmidt and Damköhler numbers, etc. Peters (Reference Peters2000) explored the importance of calculating isoscalar surfaces and their role in combustion modelling. One of the earlier attempts of modelling combustion using isoscalar surface statistics is given in Bray & Swaminathan (Reference Bray and Swaminathan2006). Swaminathan & Bray (Reference Swaminathan and Bray2011, pp. 41–60) discuss the equation for isosurface area and its uses in modelling premixed combustion. Bray (Reference Bray2016) studied laminar flamelets in premixed combustion. A more recent example of combustion analysis based on an isosurface area is that of Chaudhuri et al. (Reference Chaudhuri, Kolla, Dave, Hawkes, Chen and Law2017), who studied the geometric flame thickness of a reacting jet. Zheng, You & Yang (Reference Zheng, You and Yang2017) studied the propagation of scalar isosurfaces in isotropic turbulence and formulated a model for estimating isosurface area changes with time in order to model a planar premixed flame front. Motivated by the modelling of premixed combustion, Dopazo et al. (Reference Dopazo, Martin, Cifuentes and Hierro2018) consider the propagation of scalar isosurfaces and also provide an equation for the time rate of change of the infinitesimal isosurface area (Dopazo et al. Reference Dopazo, Martin, Cifuentes and Hierro2018, equation (25)).
Applications for isosurface area calculations outside the field of combustion include the size of the entrainment area in a turbulent jet (Ricou & Spalding Reference Ricou and Spalding1961; Delichatsios Reference Delichatsios1987) and the area of the turbulent/non-turbulent interface (Corrsin & Kistler Reference Corrsin and Kistler1955; Taveira & da Silva Reference Taveira and da Silva2014; Watanabe et al. Reference Watanabe, Riley, de Bruyn Kops, Diamessis and Zhou2016). Schumacher & Sreenivasan (Reference Schumacher and Sreenivasan2005) considered the relationships between the geometrical and statistical properties of a scalar field. In general, these quantities are important for understanding and modelling mixing in environmental and technological flows. Watanabe et al. (Reference Watanabe, Riley, de Bruyn Kops, Diamessis and Zhou2016) consider internal wave energy transported through an isosurface of enstrophy in a stably stratified wake.
Methods for calculating an isosurface area can be divided into two types, which we refer to as ‘geometric methods’ and ‘integral methods’. Geometric methods involve multiple steps, each potentially involving numerical or mathematical approximations. First, discrete points on an isosurface are located by a process that usually requires some methods of interpolation and root finding. Next, the points are connected by surface ‘patches’ to approximate the surface. In general, these surface patches can be curved, although typically planar polygons are used thereby introducing the assumption that the surface is locally planar at the resolution at which it is sampled. Finally, the areas of surface patches are integrated, which introduces another approximation, with the most common approach being to sum the areas of the polygons to yield the area of the surface. Methods of this type include marching cubes, marching tetrahedra and surface nets; a review of the geometrical methods can be found in Patera & Skala (Reference Patera and Skala2004). Geometric methods are attractive when it is desirable to visualise the surface in addition to estimating the area, and indeed, Paraview, a very popular open-source data visualisation software used in computational fluid dynamics, uses the marching cubes algorithm for constructing isosurfaces (Schroeder et al. Reference Schroeder, Martin, Lorensen, Avila, Avila and Law2006, chap. 6).
Drawbacks to geometric methods include that they do not always converge to the true surface area as the number of discrete points on the surface is increased, topological ambiguities can result in problems connecting those points to form a surface, and the algorithms are computationally complex (Liu et al. Reference Liu, Yi, Zhang, Zheng and Paul2010). Newman & Yi (Reference Newman and Yi2006) conducted a review of the marching cubes algorithm and noted that there are many variations within it and a number of ‘spin-off’ methods to improve certain aspects of the basic algorithm. In particular, considerable research has been done into how to resolve the potential ambiguities in connecting discrete points to form a surface. Pope, Yeung & Girimaji (Reference Pope, Yeung and Girimaji1989) concluded that level scalar surfaces can be highly wrinkled and disjoint in turbulent reacting flows and a direct geometrical representation may not be feasible. Lewiner et al. (Reference Lewiner, Lopes, Vieira and Tavares2003) concluded that there can be connectivity issues even with relatively simple convex isosurface geometries.
While geometric methods are based on the intuitive approach of finding the surface and measuring its area, they are complicated by a variety of approximations required to implement the approach. Integral methods, in contrast, begin with an exact equation for the surface, which may not be intuitive. Our approach, detailed in § 2, is based on Federer’s co-area formula, which relates the surface area to the infinitesimally thin volume that contains it (Federer Reference Federer1959). Given this equation, the problem of finding an isosurface area reduces to that of integrating the equation numerically. Discussion of our specific approach to doing this is deferred to § 2, but we note that the general approach has been reported in the literature (Yurtoglu, Carton & Storti Reference Yurtoglu, Carton and Storti2018). These authors conducted convergence tests for an integral approach to calculating the volume of a torus. They also provide a proof, based on that of Resnikoff & Raymond (Reference Resnikoff and Raymond2012), for the surface integral of a function over a level scalar set (Yurtoglu et al. Reference Yurtoglu, Carton and Storti2018, equation (10)), which when discretised for an infinitesimal scalar range goes over to the equation for an isosurface area in § 2. Isosurface statistics summed over the scalar domain have also been a point of interest (Scheidegger et al. Reference Scheidegger, Schreiner, Duffy, Carr and Silva2008) and the area equation in § 2 agrees with their result upon integration over the entire range of scalar values.
An additional consideration when choosing a method for calculating isosurfaces is advances in computer architecture. As early as 1988, Payne & Hassan (Reference Payne and Hassan1988) noted that massively parallel computers had enabled the calculation of flow fields that were previously intractable in simulations. Since then, the importance of parallel algorithms has increased dramatically, particularly since the breakdown of Dennard scaling in approximately 2006 (Dennard et al. Reference Dennard, Gaensslen, Rideout, Bassous and LeBlanc1974; Bohr Reference Bohr2007) and the resulting requirement that, for an algorithm to run faster, it must exploit additional parallelism on a single computer processor and across multiple processors. Raase & Nordström (Reference Raase and Nordström2015), for example, reported the utility of many-core processors for simulations of fluids. Kolla & Chen (Reference Kolla and Chen2018), though, report that geometric methods for finding isosurface areas are difficult to parallelise. Monte Carlo techniques suitable for evaluating integral methods for computing isosurface areas are well suited for parallelisation (Dimov, Penzov & Stoilova Reference Dimov, Penzov, Stoilova, Boyanov, Dimova, Georgiev and Nikolov2007), and this is the approach we take, as discussed in § 3. Yurtoglu et al. (Reference Yurtoglu, Carton and Storti2018) present an approach specifically designed to avoid the stochastic nature and slow convergence of Monte Carlo methods while being highly scalable on general-purpose graphics processors.
The specific subjects of this paper are (1) the demonstration of an integral method for computing isosurfaces and (2) its application to direct numerical simulation (DNS) data to understand how an isosurface area varies with Reynolds, Schmidt and Péclet numbers. The integral method is presented in § 2 and verified with a simple case in § 3. The DNS are presented in § 4, followed by analysis in §§ 5 and 6. Some conclusions are drawn in § 7.
2 An integral expression for an isosurface area
Let us first define some notation. Consider a scalar field  $\unicode[STIX]{x1D719}(\boldsymbol{x})$ to be a function that maps
 $\boldsymbol{x}$ to a scalar
 $\unicode[STIX]{x1D719}$. The volume in which we want an isosurface area is
 $V$, the set of all possible position vectors in
 $V$ is
 $\boldsymbol{X}$, and the set of all values of
 $\unicode[STIX]{x1D719}$ in
 $V$ is
 $\unicode[STIX]{x1D753}$. The subset of
 $\boldsymbol{X}$ at which
 $\unicode[STIX]{x1D719}=\unicode[STIX]{x1D713}$ is
 $\boldsymbol{X}_{\unicode[STIX]{x1D713}}$. Assuming that an isosurface exists with isovalue
 $\unicode[STIX]{x1D713}$, then its area is
 $A(\unicode[STIX]{x1D713})$ and the differential area associated with each point in
 $\boldsymbol{X}_{\unicode[STIX]{x1D713}}$ is
 $\hat{n}\,\text{d}A$ with
 $\hat{n}=\unicode[STIX]{x1D735}\unicode[STIX]{x1D719}/|\unicode[STIX]{x1D735}\unicode[STIX]{x1D719}|$. The volume between isosurfaces with
 $\unicode[STIX]{x1D719}=\unicode[STIX]{x1D713}$ and
 $\unicode[STIX]{x1D719}=\unicode[STIX]{x1D713}+\text{d}\unicode[STIX]{x1D719}$ corresponds to the set of all the position vectors between
 $\boldsymbol{X}_{\unicode[STIX]{x1D713}}$ and
 $\boldsymbol{X}_{\unicode[STIX]{x1D713}+\text{d}\unicode[STIX]{x1D719}}$. Consider a position vector
 $\boldsymbol{x}=\unicode[STIX]{x1D743}$ such that
 $\unicode[STIX]{x1D743}\in \boldsymbol{X}_{\unicode[STIX]{x1D713}}$. For every
 $\unicode[STIX]{x1D743}$, since the gradient
 $\unicode[STIX]{x1D735}\unicode[STIX]{x1D719}$ is defined at every point, there exists a differential vector
 $\text{d}\boldsymbol{x}=\hat{n}\,\text{d}x$ such that
 $$\begin{eqnarray}\boldsymbol{x}=\unicode[STIX]{x1D743}+\text{d}\boldsymbol{x}\in \boldsymbol{X}_{\unicode[STIX]{x1D713}+\text{d}\unicode[STIX]{x1D719}}.\end{eqnarray}$$
Hence, a volume element at  $\unicode[STIX]{x1D743}$ corresponding to the volume between ensembles
 $\boldsymbol{X}_{\unicode[STIX]{x1D713}}$ and
 $\boldsymbol{X}_{\unicode[STIX]{x1D713}+\text{d}\unicode[STIX]{x1D719}}$ is given by
 $\hat{n}\,\text{d}A\boldsymbol{\cdot }\hat{n}\,\text{d}x$. The volume of this region is given by integrating over
 $\boldsymbol{X}_{\unicode[STIX]{x1D713}}$:
 $$\begin{eqnarray}\text{d}V=\int _{\boldsymbol{X}_{\unicode[STIX]{x1D713}}}\hat{n}\,\text{d}A\boldsymbol{\cdot }\hat{n}\,\text{d}x.\end{eqnarray}$$
Now consider a finite thickness of a layer where the infinitesimal width  $\text{d}\unicode[STIX]{x1D719}$ is replaced by a finite width
 $\unicode[STIX]{x0394}\unicode[STIX]{x1D719}$. The volume
 $\text{d}V$ given in (2.2) integrated over the region between
 $\boldsymbol{X}_{\unicode[STIX]{x1D713}}$ and
 $\boldsymbol{X}_{\unicode[STIX]{x1D713}+\unicode[STIX]{x0394}\unicode[STIX]{x1D719}}$ gives us the volume of the finite layer between
 $\boldsymbol{X}_{\unicode[STIX]{x1D713}}$ and
 $\boldsymbol{X}_{\unicode[STIX]{x1D713}+\unicode[STIX]{x0394}\unicode[STIX]{x1D719}}$, which is represented by
 $V(\unicode[STIX]{x1D713},\unicode[STIX]{x0394}\unicode[STIX]{x1D719})$. Now consider Federer’s co-area formula
 $$\begin{eqnarray}\int _{\unicode[STIX]{x1D713}}^{\unicode[STIX]{x1D713}+\unicode[STIX]{x0394}\unicode[STIX]{x1D719}}\int _{\boldsymbol{X}_{\unicode[STIX]{x1D713}}}q(\boldsymbol{x})\,\text{d}A\,\text{d}\unicode[STIX]{x1D719}=\int _{V(\unicode[STIX]{x1D713},\unicode[STIX]{x0394}\unicode[STIX]{x1D719})}q(\boldsymbol{x})|\unicode[STIX]{x1D735}\unicode[STIX]{x1D719}|\,\text{d}V,\end{eqnarray}$$
which relates integrals over surfaces to integrals over volumes (Federer Reference Federer1959). This particular form of the co-area formula is from Scheidegger et al. (Reference Scheidegger, Schreiner, Duffy, Carr and Silva2008, equation (3)), where  $q(\boldsymbol{x})$ is any scalar function defined over the domain of
 $\unicode[STIX]{x1D719}$ and
 $\unicode[STIX]{x1D719}(\boldsymbol{x})$ is a Lipschitz continuous function. Lipschitz continuity implies that
 $|\unicode[STIX]{x1D735}\unicode[STIX]{x1D719}|$ is bounded, which is true in most data generated by numerical simulation because finite derivatives are required to solve the governing equations. Note that
 $V(\unicode[STIX]{x1D713},\unicode[STIX]{x0394}\unicode[STIX]{x1D719})$ can be any volume that equals or is a subset of the domain of
 $\unicode[STIX]{x1D719}$. The term on the right-hand side can be written as the ensemble average of
 $q(\boldsymbol{x})|\unicode[STIX]{x1D735}\unicode[STIX]{x1D719}|$ over
 $V(\unicode[STIX]{x1D713},\unicode[STIX]{x0394}\unicode[STIX]{x1D719})$ times the volume
 $V(\unicode[STIX]{x1D713},\unicode[STIX]{x0394}\unicode[STIX]{x1D719})$. Upon setting
 $q(\boldsymbol{x})=1$ in (2.3), the inner integral becomes the area of
 $\boldsymbol{X}_{\unicode[STIX]{x1D713}}$. Dividing both sides by
 $V$, equation (2.3) simplifies to
 $$\begin{eqnarray}\frac{1}{V}\int _{\unicode[STIX]{x1D713}}^{\unicode[STIX]{x1D713}+\unicode[STIX]{x0394}\unicode[STIX]{x1D719}}A(\unicode[STIX]{x1D719})\,\text{d}\unicode[STIX]{x1D719}=\frac{\langle |\unicode[STIX]{x1D735}\unicode[STIX]{x1D719}|\rangle _{V(\unicode[STIX]{x1D713},\unicode[STIX]{x0394}\unicode[STIX]{x1D719})}V(\unicode[STIX]{x1D713},\unicode[STIX]{x0394}\unicode[STIX]{x1D719})}{V},\end{eqnarray}$$
which is an exact equation, as it is a direct consequence of Federer’s co-area formula. Approximating the outer integral using the rectangle rule yields the discrete equation
 $$\begin{eqnarray}\frac{A(\unicode[STIX]{x1D713})}{V}\unicode[STIX]{x0394}\unicode[STIX]{x1D719}\approxeq \frac{\langle |\unicode[STIX]{x1D735}\unicode[STIX]{x1D719}|\rangle _{V(\unicode[STIX]{x1D713},\unicode[STIX]{x0394}\unicode[STIX]{x1D719})}V(\unicode[STIX]{x1D713},\unicode[STIX]{x0394}\unicode[STIX]{x1D719})}{V},\end{eqnarray}$$
which we can evaluate numerically and which goes over to (2.4) in the limit of $\unicode[STIX]{x0394}\unicode[STIX]{x1D719}\rightarrow 0$.
The volume  $V(\unicode[STIX]{x1D713},\unicode[STIX]{x0394}\unicode[STIX]{x1D719})$ in (2.5) represents all possible position vectors
 $\boldsymbol{x}$ such that
 $\unicode[STIX]{x1D719}(\boldsymbol{x})\in [\unicode[STIX]{x1D713},\unicode[STIX]{x1D713}+\unicode[STIX]{x0394}\unicode[STIX]{x1D719})$. Since
 $V$ is the domain of
 $\unicode[STIX]{x1D719}$, it represents all possible position vectors that correspond to the range of
 $\unicode[STIX]{x1D719}$. Dividing both sides by
 $\unicode[STIX]{x0394}\unicode[STIX]{x1D719}$, equation (2.5) can be simplified to
 $$\begin{eqnarray}\frac{A(\unicode[STIX]{x1D713})}{V}\approxeq \langle |\unicode[STIX]{x1D735}\unicode[STIX]{x1D719}|\rangle _{V(\unicode[STIX]{x1D713},\unicode[STIX]{x0394}\unicode[STIX]{x1D719})}\frac{V(\unicode[STIX]{x1D713},\unicode[STIX]{x0394}\unicode[STIX]{x1D719})}{V\unicode[STIX]{x0394}\unicode[STIX]{x1D719}},\end{eqnarray}$$
which is a first-order approximation with respect to  $\unicode[STIX]{x0394}\unicode[STIX]{x1D719}$ for the area-to-volume ratio of an isosurface given by
 $\boldsymbol{X}_{\unicode[STIX]{x1D713}}$, and it converges to the exact area ratio as
 $\unicode[STIX]{x0394}\unicode[STIX]{x1D719}$ is reduced. This is the equation we evaluate to compute areas in the remainder of the paper.
3 A simple example
To illustrate the evaluation of isosurface area via (2.6), we consider the scalar field
 $$\begin{eqnarray}\unicode[STIX]{x1D719}(\boldsymbol{x})=x^{2}+y^{2}+2z\end{eqnarray}$$
in the volume  $x\in [0,2],~y\in [0,2],~z\in [0,2]$. In this test case,
 $\unicode[STIX]{x1D719}$ is known exactly, so that the area of any isosurface and the mean gradient on the surface are known analytically. We use the exact area as a reference against which to compare numerical solutions of (2.6).
Numerically evaluating (2.6) via a Monte Carlo method reduces to sampling  $\unicode[STIX]{x1D719}$ and accumulating statistics for
 $\unicode[STIX]{x1D735}\unicode[STIX]{x1D719}$. Looking ahead in this paper, we note that the DNS database we use is produced by a pseudospectral simulation so that, given
 $\unicode[STIX]{x1D719}$ from the simulation, no numerical error is introduced in computing either
 $\unicode[STIX]{x1D719}$ or
 $\unicode[STIX]{x1D735}\unicode[STIX]{x1D719}$ at an arbitrary location
 $\boldsymbol{x}$; why this is so is explained in § 5. Therefore, the uncertainty in evaluating (2.6) is dependent on how
 $\unicode[STIX]{x1D719}$ is sampled, the number of times it is sampled, and the layer thickness
 $\unicode[STIX]{x0394}\unicode[STIX]{x1D719}$.
To evaluate (2.6) for this test case,  $\unicode[STIX]{x1D719}(\boldsymbol{x})$ is sampled at random locations chosen using a pseudo-random-number generator, with the term ‘pseudo-random’ referring to how sequences are computed on a typical digital computer. There are advantages, though, to using a ‘quasi-random’ sequence, such as that of Sobol’ (Reference Sobol’1967); for a discussion see Press et al. (Reference Press, Teukolsky, Vetterling and Flannery2007, pp. 404–409). As the samples are accumulated, the computation of
 $\langle |\unicode[STIX]{x1D735}\unicode[STIX]{x1D719}|\rangle _{V(\unicode[STIX]{x1D713},\unicode[STIX]{x0394}\unicode[STIX]{x1D719})}$ is straightforward. If
 $\unicode[STIX]{x1D719}(\boldsymbol{x})$ were available only at a limited number of locations, then the optimal
 $\unicode[STIX]{x0394}\unicode[STIX]{x1D719}$, based on statistical considerations, might be determined by the method of Freedman & Diaconis (Reference Freedman and Diaconis1981). Here, however,
 $\unicode[STIX]{x1D719}(\boldsymbol{x})$ is known for all
 $\boldsymbol{x}$ so that
 $\unicode[STIX]{x0394}\unicode[STIX]{x1D719}$ can be selected and then
 $\unicode[STIX]{x1D719}(\boldsymbol{x})$ sampled until the desired statistical convergence is attained.
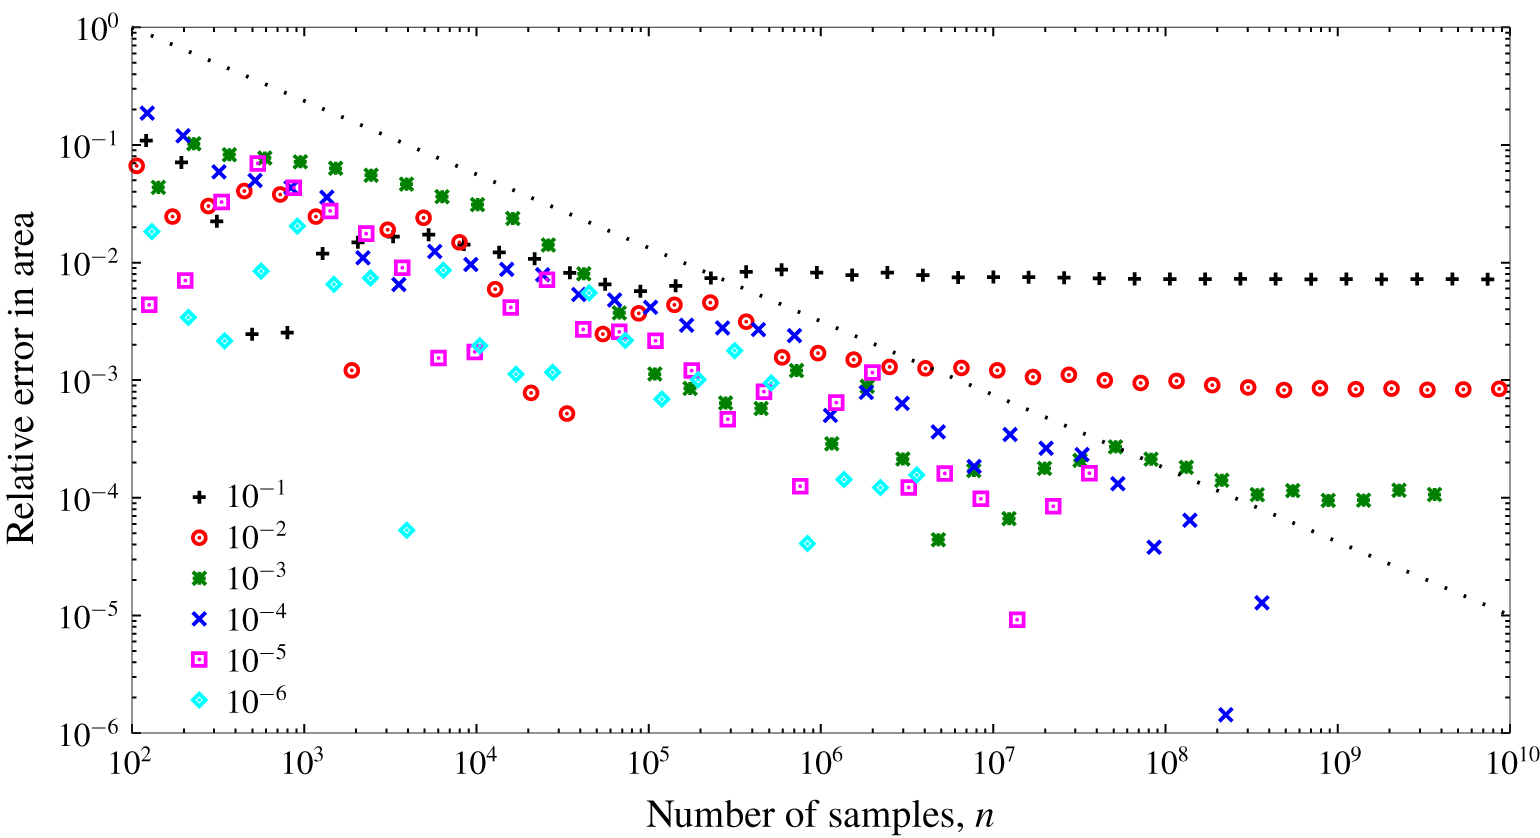
In figure 1 are shown the results of sampling  $\unicode[STIX]{x1D719}$ many times and accumulating the statistics for various values of
 $\unicode[STIX]{x0394}\unicode[STIX]{x1D719}$. It is observed that the relative area in the area estimate for a given value of
 $\unicode[STIX]{x0394}\unicode[STIX]{x1D719}$ converges with
 $n^{-1/2}$, where
 $n$ is the number of samples. This is expected since a pseudo-random sequence is used for the sampling in this test case (Press et al. Reference Press, Teukolsky, Vetterling and Flannery2007, pp. 404–409). The sampling of the DNS cases, discussed in § 5, is a hybrid of pseudo-random and quasi-random with somewhat faster convergence. For each
 $\unicode[STIX]{x0394}\unicode[STIX]{x1D719}$, a minimum relative error is reached given enough samples. The term ‘relative error’ is not strictly correct because the method arrives at the correct areas based on layers of finite thickness. For this simple case, the area of the surface with
 $\unicode[STIX]{x1D719}=\unicode[STIX]{x1D713}+\unicode[STIX]{x0394}\unicode[STIX]{x1D719}$ will always be larger than the area of the isosurface
 $\unicode[STIX]{x1D719}=\unicode[STIX]{x1D713}$. For example, the relative difference between the analytically determined areas of the surfaces with
 $\unicode[STIX]{x1D713}=4$ and 4.01 is approximately 0.001, which is consistent with figure 1. Importantly, though, the area estimate converges linearly with
 $\unicode[STIX]{x0394}\unicode[STIX]{x1D719}$ as expected from the derivation of (2.6). This is apparent from figure 1 because, for the three layer thicknesses for which the evaluation of (2.6) is converged, the area estimate improves by an order of magnitude as
 $\unicode[STIX]{x0394}\unicode[STIX]{x1D719}$ is decreased by an order of magnitude.
Relative error in the estimate for the area of an isosurface in the simple example with  $\unicode[STIX]{x1D713}=4$.

We conclude from this simple case that the method can be used to measure isosurface areas with arbitrary accuracy given a sufficiently small  $\unicode[STIX]{x0394}\unicode[STIX]{x1D719}$ and sufficient samples. The area converges with
 $n^{-1/2}$ and with
 $\unicode[STIX]{x0394}\unicode[STIX]{x1D719}$. One caveat is that care must be used in accumulating the statistics, such as by using 128-bit floating-point arithmetic and, perhaps, the method of Kahan (Reference Kahan1965) to reduce round-off errors; both techniques are used in this paper. A second caveat is that pseudo-random sequences have limitations that are beyond the scope here but are discussed in, for example, Vadhan et al. (Reference Vadhan2012). Also, it is interesting to note that the quantity
 $V(\unicode[STIX]{x1D713},\unicode[STIX]{x0394}\unicode[STIX]{x1D719})/(V\unicode[STIX]{x0394}\unicode[STIX]{x1D719})$ is in fact a first-order approximation to
 $P(\unicode[STIX]{x1D719};\unicode[STIX]{x1D719}=\unicode[STIX]{x1D713})$ provided that the Monte Carlo integration is converged. Further discussion of this is given in appendix A.
4 Direct numerical simulations
The simulated flows are the solution to the Navier–Stokes equations and passive scalar transport equation in three spatial dimensions:
 $$\begin{eqnarray}\displaystyle & \displaystyle \unicode[STIX]{x1D735}\boldsymbol{\cdot }\boldsymbol{u}=0, & \displaystyle\end{eqnarray}$$
 $$\begin{eqnarray}\displaystyle & \displaystyle \frac{\unicode[STIX]{x2202}\boldsymbol{u}}{\unicode[STIX]{x2202}t}+\boldsymbol{u}\boldsymbol{\cdot }\unicode[STIX]{x1D735}\boldsymbol{u}=-\unicode[STIX]{x1D735}p+\unicode[STIX]{x1D708}\unicode[STIX]{x1D6FB}^{2}\boldsymbol{u}+\boldsymbol{b}, & \displaystyle\end{eqnarray}$$
 $$\begin{eqnarray}\displaystyle & \displaystyle \frac{\unicode[STIX]{x2202}\unicode[STIX]{x1D719}}{\unicode[STIX]{x2202}t}+\boldsymbol{u}\boldsymbol{\cdot }\unicode[STIX]{x1D735}\unicode[STIX]{x1D719}=-\boldsymbol{u}\boldsymbol{\cdot }\unicode[STIX]{x1D735}\unicode[STIX]{x1D6F7}+D\unicode[STIX]{x1D6FB}^{2}\unicode[STIX]{x1D719}. & \displaystyle\end{eqnarray}$$
 $\boldsymbol{u}=[u,v,w]$ with kinematic viscosity
 $\unicode[STIX]{x1D708}$, the pressure
 $p$ has been divided through by the (constant) density, and
 $\boldsymbol{b}$ is a time-varying force applied to maintain the flow statistically stationary. The passive scalar is decomposed into
 $\unicode[STIX]{x1D6F7}+\unicode[STIX]{x1D719}$, with time-invariant
 $\unicode[STIX]{x1D6F7}$ having a uniform gradient in the direction of
 $w$, and being uniform in the other spatial directions;
 $\unicode[STIX]{x1D719}$ denotes the fluctuations relative to
 $\unicode[STIX]{x1D6F7}$ with molecular diffusivity
 $D$.
Spatial discretisation is via Fourier series truncated according to the  $2/3$ rule to remove all effects of aliasing. The advection terms are computed in real space in vorticity form for momentum and in convective and conservation forms on alternating time steps for the scalars. The equations are advanced in time using a third-order-accurate fractional step method for the advection and pressure gradient terms, while the diffusion terms are integrated exactly in Fourier space.
The velocity fields are forced isotropically so that the three-dimensional kinetic energy spectrum at length scales larger than the integral length scale matches Pope’s model spectrum with his  $p_{0}=2$ and his
 $c_{L}=6.78$ (Pope Reference Pope2000, equation (6.247)). Each time step, a second-order ordinary differential equation is advanced in time for each shell of the shell-averaged spectrum to determine how much energy to add to that shell. The energy is distributed randomly, but consistent with continuity, across all the wavenumbers composing the shell. The solution to these differential equations and the random distributions produces the Fourier-space equivalent of
 $\boldsymbol{b}$. This approach is introduced by Overholt & Pope (Reference Overholt and Pope1998) to efficiently converge a simulation to a target spectrum; Rao & de Bruyn Kops (Reference Rao and de Bruyn Kops2011) reviews a variety of forcing techniques for the type of simulation used for this research. After the simulation was determined to be statistically stationary based on mean quantities, it was advanced for an additional large-eddy turnover time before taking a snapshot for analysis of the isosurface areas.
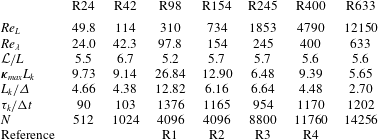
Velocity parameters and statistics for the highest resolution of each case. Here  $N$ and
 $\unicode[STIX]{x1D73F}_{max}L_{k}$ are shown for each velocity field at it highest resolution (
 $Sc=7$); lower resolution is used for the cases with lower
 $Sc$ in simulations R245, R400 and R633, and the resolution for each scalar case is given in table 2 in terms of
 $L_{k}/\unicode[STIX]{x1D6E5}$. ‘Reference’ indicates the names used for statistically equivalent simulations in Almalkie & de Bruyn Kops (Reference Almalkie and de Bruyn Kops2012a), de Bruyn Kops (Reference de Bruyn Kops2015), Muschinski & de Bruyn Kops (Reference Muschinski and de Bruyn Kops2015) and Portwood et al. (Reference Portwood, de Bruyn Kops, Taylor, Salehipour and Caulfield2016).

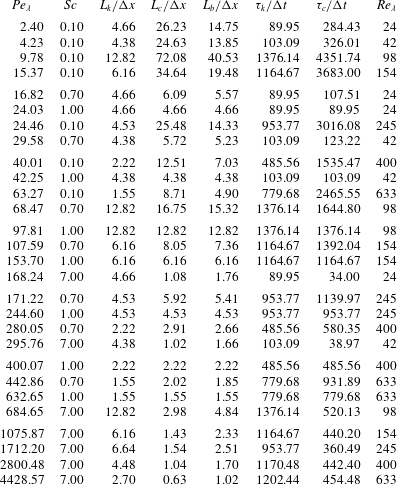
Scalar field parameters and statistics for all cases.

Seven velocity fields are considered for this research, with each convecting four scalar fields with differing Schmidt numbers  $Sc=\unicode[STIX]{x1D708}/D$. The velocity field statistics are tabulated in table 1 and the scalar statistics in table 2, with
 $Re_{L}$ the Reynolds number based on the root mean square (r.m.s.) velocity and the integral length scale
 $L$,
 $Re_{\unicode[STIX]{x1D706}}$ the Reynolds number based on the r.m.s. velocity and the Taylor microscale, and
 $Pe_{\unicode[STIX]{x1D706}}$ the corresponding Péclet number. There
 $L_{k}$,
 $L_{b}$ and
 $L_{c}$ are the Kolmogorov, Batchelor and Obukhov–Corrsin length scales, respectively,
 $$\begin{eqnarray}L_{k}=\left(\frac{\unicode[STIX]{x1D708}^{3}}{\unicode[STIX]{x1D716}}\right)^{1/4},\quad L_{b}=\left(\frac{\unicode[STIX]{x1D708}D^{2}}{\unicode[STIX]{x1D716}}\right)^{1/4},\quad L_{c}=\left(\frac{D^{3}}{\unicode[STIX]{x1D716}}\right)^{1/4},\end{eqnarray}$$
with corresponding times scales
 $$\begin{eqnarray}\unicode[STIX]{x1D70F}_{k}=\frac{\unicode[STIX]{x1D708}}{\unicode[STIX]{x1D716}}^{1/2},\quad \unicode[STIX]{x1D70F}_{c}=\frac{D}{\unicode[STIX]{x1D716}}^{1/2}.\end{eqnarray}$$
Here  $\unicode[STIX]{x1D716}$ is the dissipation rate of kinetic energy. The maximum wavenumber after dealiasing is
 $\unicode[STIX]{x1D73F}_{max}$, the grid spacing is
 $\unicode[STIX]{x0394}x$, and the time step size is
 $\unicode[STIX]{x0394}t$. The domain size is
 ${\mathcal{L}}$ in each spatial direction discretised by
 $N$ grid points.
The velocity fields are denoted by an R followed by  $Re_{\unicode[STIX]{x1D706}}$ rounded to an integer, e.g. R24. Four of the cases have been reported elsewhere, so that cases R98, R154 and R245 are statistically equivalent to cases R1, R2 and R3 reported by Almalkie & de Bruyn Kops (Reference Almalkie and de Bruyn Kops2012a) and R400 is equivalent to the homogeneous isotropic case denoted R4 in Almalkie & de Bruyn Kops (Reference Almalkie and de Bruyn Kops2012b), de Bruyn Kops (Reference de Bruyn Kops2015) and Portwood et al. (Reference Portwood, de Bruyn Kops, Taylor, Salehipour and Caulfield2016). The R400 is denoted R4 by Muschinski & de Bruyn Kops (Reference Muschinski and de Bruyn Kops2015) and used to study models for scalar energy spectra.
5 Numerical considerations
Before proceeding to evaluating isosurface areas in the DNS as a function of Reynolds and Schmidt numbers in § 6, it is important to apply the tests from § 3 to understand the accuracy to which the areas can be evaluated from the DNS. It is also important to understand the extent to which the spatial and temporal resolutions of the DNS may affect the area calculations. These are the topics of this section. We do not review the numerical errors in Fourier spectral methods because they are discussed so extensively in the literature and instead refer the reader to, for example, de Bruyn Kops & Riley (Reference de Bruyn Kops and Riley2001, § 3).
Fourier spectral simulations represent the scalar fields as infinite series with all but a few of the series coefficients identically zero. This is in contrast to, say, a laboratory time series that has been Fourier-transformed and represented by a truncated series. This characteristic of the current simulations allows us to sample the scalar fields at an arbitrary number of locations via phase shifting so that each sample has the same accuracy as the simulation as a whole and no interpolation error is introduced. Also in Fourier spectral simulations,  $\unicode[STIX]{x1D735}\unicode[STIX]{x1D719}$ is known with the same accuracy as
 $\unicode[STIX]{x1D719}$ because the derivative of each term in the series expansion is known analytically.
The sampling process begins with the scalar field in Fourier space. A random phase shift with wavenumber vector  $\unicode[STIX]{x1D73F}$ is applied, the field is transformed to real space, and all of the points in the resulting field are used to accumulate data for evaluating (2.6). The process is repeated as many times as desired. The result is a Monte Carlo method in which for every
 $N^{3}$ samples of the field only one random vector
 $\unicode[STIX]{x1D73F}$ is chosen. Because the samples for a single value
 $\unicode[STIX]{x1D73F}$ are uniformly distributed across the entire simulation domain, this method is a type of ‘quasi-random’ sampling (cf. § 3).
The spatial and temporal resolution requirements in DNS have been continually refined over the last three decades as computers have become more powerful so as to enable simulations with higher internal intermittency. The large-scale requirement for decaying homogeneous isotropic turbulence (HIT) was established by experimentation to be approximately 20 times the integral length scale  $L$ by de Bruyn Kops & Riley (Reference de Bruyn Kops and Riley1998b) and recently verified by de Bruyn Kops & Riley (Reference de Bruyn Kops and Riley2019). In simulations forced to be statistically stationary, such as those used for the current research, no large-scale resolution requirement has been established to our knowledge, and we have used domains that are approximately
 $5L$ because this resolution has been shown to produce structure functions and spectra that match theoretical predictions in the inertial and dissipation ranges (Almalkie & de Bruyn Kops Reference Almalkie and de Bruyn Kops2012a).
Small-scale resolution requirements for DNS were first established by Eswaran & Pope (Reference Eswaran and Pope1988), who showed that  $\unicode[STIX]{x1D73F}_{max}L_{k}>1$ is required for the scalar variance to decay as expected from theory in decaying HIT. Since then, the dependence of small-scale statistics on Reynolds number has been analysed in several studies (Yeung & Sawford Reference Yeung and Sawford2002; Yeung, Donzis & Sreenivasan Reference Yeung, Donzis and Sreenivasan2005; Gulitski et al. Reference Gulitski, Kholmyansky, Kinzelbach, Lüthi, Tsinober and Yorish2007a,Reference Gulitski, Kholmyansky, Kinzelbach, Lüthi, Tsinober and Yorishb; Ishihara et al. Reference Ishihara, Kaneda, Yokokawa, Itakura and Uno2007; Ishihara, Gotoh & Kaneda Reference Ishihara, Gotoh and Kaneda2009) and the effects on intermittency of insufficient small-scale resolution in DNS investigated (Yakhot & Sreenivasan Reference Yakhot and Sreenivasan2005; Schumacher, Sreenivasan & Yakhot Reference Schumacher, Sreenivasan and Yakhot2007; Watanabe & Gotoh Reference Watanabe and Gotoh2007; Donzis, Yeung & Sreenivasan Reference Donzis, Yeung and Sreenivasan2008). Recently, Yeung, Sreenivasan & Pope (Reference Yeung, Sreenivasan and Pope2018) report on not only the spatial resolution required to resolve small-scale intermittency but also the temporal resolution for
 $Re_{\unicode[STIX]{x1D706}}=390$ and 650, which are comparable to our cases R400 and R633. Because of our need to resolve
 $Sc=7$, our spatial resolutions are finer than those shown to be sufficient in the paper just referenced. Therefore, when we satisfy the Courant number condition established by Yeung et al. (Reference Yeung, Sreenivasan and Pope2018), our time step is smaller than theirs, which gives us confidence that the time scale of intermittency is resolved. The time step in each simulation is given in table 1, relative to the Corrsin and Kolmogorov time scales, from which it is apparent that these time scales are very well resolved in the simulations.
The foregoing gives us confidence that all the scalar and velocity fields are well resolved and so we move to the question of the effect of layer thickness  $\unicode[STIX]{x0394}\unicode[STIX]{x1D719}$ used in numerically evaluating (2.6). For the simple example illustrated by figure 1, the error in an isosurface area reduces unbounded and proportionally to
 $n^{-1/2}$ and
 $\unicode[STIX]{x0394}\unicode[STIX]{x1D719}$. Recall that the exact area in that case is known. In the DNS fields, though, the exact area is not known, so that the error in the area must be based on the best available area estimate, e.g. that computed with the scalar field at the highest resolution available and with the smallest practicable layer thickness. Also, we can surmise that, even with careful attention to mitigating them with 128-bit arithmetic and the method of Kahan (Reference Kahan1965), round-off errors will limit the accuracy of the numerical evaluation of (2.6).
Our test case for numerical studies is R245 because the Reynolds number is high enough for there to be significant intermittency yet we have resolved it with much finer spatial resolution than required per Yeung et al. (Reference Yeung, Sreenivasan and Pope2018). The value  $Pr=7$ is considered since it has the smallest diffusive length scale. The relative errors for the area of a single isosurface
 $\unicode[STIX]{x1D713}$ computed using various layer thicknesses is shown in figure 2. The dimensionless layer thickness is
 $$\begin{eqnarray}\widetilde{\unicode[STIX]{x0394}\unicode[STIX]{x1D719}}=\frac{\unicode[STIX]{x0394}\unicode[STIX]{x1D719}}{L_{r}\langle |\unicode[STIX]{x1D735}\unicode[STIX]{x1D719}|\rangle _{\boldsymbol{X}_{\unicode[STIX]{x1D713}}}},\end{eqnarray}$$
with  $L_{r}$ being some resolution length scale appropriate for the scalar. In this paper we set
 $L_{r}=\unicode[STIX]{x0394}x$ because, in our simulations,
 $\unicode[STIX]{x0394}x<L_{b}$ for
 $Pr\geqslant 1$ and
 $\unicode[STIX]{x0394}x\leqslant L_{c}$ for
 $Pr\leqslant 1$.
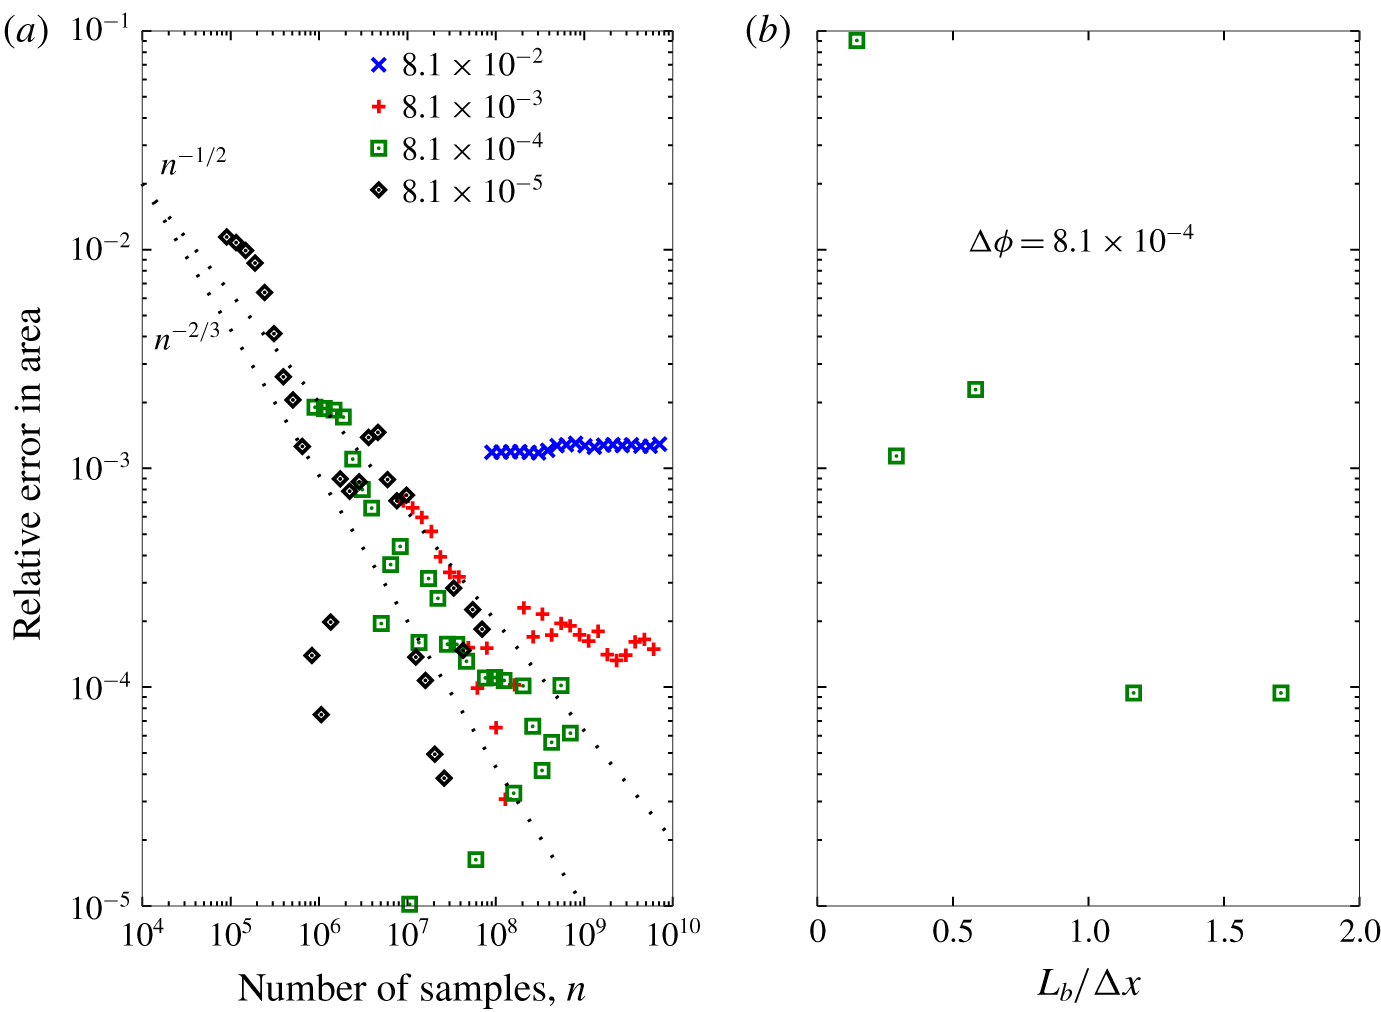
Error in the area of one isosurface in the case R245,  $Pr=7$, for various non-dimensional layer thicknesses
 $\widetilde{\unicode[STIX]{x0394}\unicode[STIX]{x1D719}}$ (a) and grid resolutions (b). The dotted lines labelled
 $n^{-1/2}$ and
 $n^{-2/3}$ mark the convergence rates expected for pseudo-random and quasi-random sampling, respectively (Press et al. Reference Press, Teukolsky, Vetterling and Flannery2007).

The first thing to note from figure 2(a) is that the leftmost symbol in each set is the number of samples  $n$ in a layer of thickness
 $\widetilde{\unicode[STIX]{x0394}\unicode[STIX]{x1D719}}$ before phase shifting, e.g. when
 $\widehat{\unicode[STIX]{x0394}\unicode[STIX]{x1D719}}=8.1\times 10^{-5}$ approximately
 $10^{5}$ points are in
 $[\unicode[STIX]{x1D719},\unicode[STIX]{x1D713}+\unicode[STIX]{x0394}\unicode[STIX]{x1D719})$. Next it is noted that when
 $\widetilde{\unicode[STIX]{x0394}\unicode[STIX]{x1D719}}=8.1\times 10^{-2}$, the minimum relative error is approximately
 $10^{-3}$ and does not decrease with more sampling. For smaller
 $\widetilde{\unicode[STIX]{x0394}\unicode[STIX]{x1D719}}$, the isosurface area estimates converge at a rate between
 $n^{-1/2}$, which is expected for pseudo-random sequences, and
 $n^{-2/3}$, which is expected for quasi-random sequences. Our sampling method is based on phase shifting the entire field based on a randomly selected
 $\unicode[STIX]{x1D73F}$ so that the sampling for a single phase shift is quasi-random but the phase shifts are pseudo-random.
Given enough samples for a given  $\unicode[STIX]{x0394}\unicode[STIX]{x1D719}$, the area estimate converges just as it does in § 3. For example, when
 $\widetilde{\unicode[STIX]{x0394}\unicode[STIX]{x1D719}}=8.1\times 10^{-3}$ then the minimum relative error is approximately
 $1\times 10^{-4}$, meaning that the isosurface area estimate converges to a value different from the ‘exact’ value taken to be the estimate when
 $\widetilde{\unicode[STIX]{x0394}\unicode[STIX]{x1D719}}=8.1\times 10^{-5}$. As explained in § 3, the term ‘relative error’ is not quite correct because the method computes the area based on a layer of finite thickness so that the area based on
 $\widetilde{\unicode[STIX]{x0394}\unicode[STIX]{x1D719}}=8.1\times 10^{-3}$ is expected to be different from that based on
 $\widetilde{\unicode[STIX]{x0394}\unicode[STIX]{x1D719}}=8.1\times 10^{-5}$ even if both areas are computed exactly.
From figure 2(a) we conclude that the error in the area estimate can be made arbitrarily small given a small enough layer thickness and a sufficient number of samples produced by phase shifting. This conclusion is conditioned on the assumption that the simulations are sufficiently resolved at the small scale. We have already concluded that we expect them to be so, based on the requirements determined by Yeung et al. (Reference Yeung, Sreenivasan and Pope2018), but we verify it one more time with figure 2(b). The ‘exact’ area for this plot is from a simulation with  $L_{b}/\unicode[STIX]{x0394}x=2.5$ that is filtered with a spectral cutoff filter to produce the fields with lower values of
 $L_{b}/\unicode[STIX]{x0394}x$ used to make the figure. It is observed that the error in the area estimate converges to its minimum value when
 $L_{b}/\unicode[STIX]{x0394}x=1$. Note from figure 2(a) that this minimum value of approximately
 $1\times 10^{-4}$ is set by the layer thickness, not by the resolution of the simulation.
6 Effects of  $Re_{\unicode[STIX]{x1D706}}$ and $Sc$ on isosurfaces


The time rate of change of the area of a non-material isosurface is determined by the balance between stretching tangential to the surface and diffusion normal to the surface. A detailed derivation is included in Dopazo et al. (Reference Dopazo, Martin, Cifuentes and Hierro2018) for the case of a chemically reacting flow. For our purpose here we follow their notation and consider an infinitesimal piece of an isosurface having area  ${\mathcal{S}}$ with normal vector
 $\boldsymbol{n}_{i}$ and strain rate
 $S_{ij}$, so that the strain rate tangential to the surface is
 $a_{T}=(\unicode[STIX]{x1D6FF}_{ij}-\boldsymbol{n}_{i}n_{j})S_{ij}$. A point on an isosurface moves by diffusion, relative to the speed at which the surface is advected, with speed
 $S_{d}=-D\unicode[STIX]{x1D6FB}^{2}\unicode[STIX]{x1D719}/\unicode[STIX]{x1D735}\unicode[STIX]{x1D719}$. Therefore, the fractional change in area of this piece of an isosurface is (cf. Dopazo et al. Reference Dopazo, Martin, Cifuentes and Hierro2018, equation (25))
 $$\begin{eqnarray}\frac{1}{{\mathcal{S}}}\frac{\unicode[STIX]{x2202}{\mathcal{S}}}{\unicode[STIX]{x2202}t}=a_{T}+S_{d}\frac{\unicode[STIX]{x2202}\boldsymbol{n}_{i}}{\unicode[STIX]{x2202}x_{i}}.\end{eqnarray}$$
For the statistically stationary flows, the integral of (6.1) over an entire isosurface is zero, meaning that the integrals of the two terms on the right-hand side of (6.1) come into equilibrium.
The central physics question motivating this paper is how the equilibrium surface area  $A_{\unicode[STIX]{x1D713}}$ is affected by the Reynolds and Schmidt numbers. Catrakis, Aguirre & Ruiz-Plancarte (Reference Catrakis, Aguirre and Ruiz-Plancarte2002) measured area–volume properties of fluid interfaces in a laboratory water jet with jet Reynolds number
 ${\sim}20\,000$ and
 $Sc\sim 2000$ and report that, while large and small length scales contribute to the area–volume ratio, the dominant effect is at the small scales. They conclude that self-similarity at the small scales can be expected to enable extrapolation of area–volume behaviour to higher Reynolds number. Schumacher & Sreenivasan (Reference Schumacher and Sreenivasan2005) consider DNS of a passive scalar with a mean gradient in HIT with
 $10\leqslant Re_{\unicode[STIX]{x1D706}}\leqslant 42$ and
 $2\leqslant Sc\leqslant 32$ and observe that the area–volume ratio increases with both
 $Sc$ and
 $Re_{\unicode[STIX]{x1D706}}$ but that a power law is not observed. They further note that power-law behaviour is not expected because, at the Reynolds and Schmidt numbers considered, neither the inertial–convective nor the viscous–convective subranges exist. O’Neill & Soria (Reference O’Neill, Soria, May and Roberts2005) also consider DNS of HIT with a mean scalar gradient with
 $Sc=0.25$ and 5.0 and
 $Re_{\unicode[STIX]{x1D706}}=41$, 42 and 77. They observe that increasing either
 $Re_{\unicode[STIX]{x1D706}}$ or
 $Sc$ results in the size of the isoscalar surfaces decreasing. We note that they determine the areas with a geometric method and review in § 1 some of the challenges with using geometric methods to find the areas of turbulent isosurfaces.
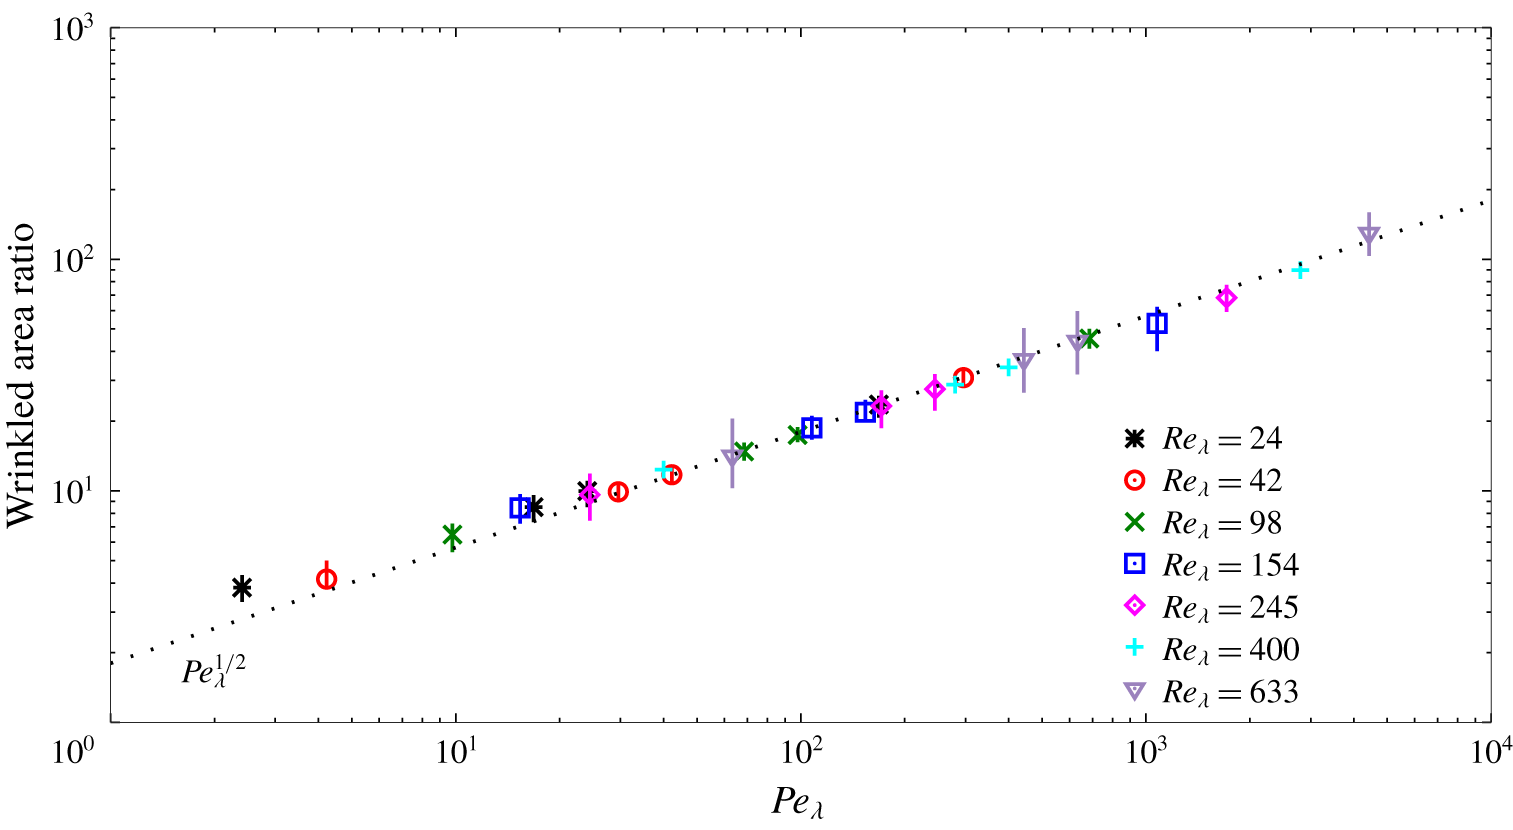
In the literature just cited, the metric for isosurface area is the area–volume ratio. Our simulations are computed in periodic domains, however, so that the scalar can be convected out of the domain to a periodic domain above or below. Given this configuration, we find it to be more clear to take advantage of homogeneity in the flows and consider the dimensionless ratio of the wrinkled surface to the initial surface area, which is that of a plane normal to the mean scalar gradient. The wrinkled surface area includes that of any portions of the surface advected across the periodic boundaries. To be precise, we compute the volume of a very thin wrinkled layer with  $\widetilde{\unicode[STIX]{x0394}\unicode[STIX]{x1D719}}=1\times 10^{-4}$ and relate it to an isosurface area via (2.6). The results are given in figure 3. For each case, the areas are measured for 20 isovalues spanning the range of
 $\unicode[STIX]{x1D719}$ in the simulation. It is noted that there is more scatter in some cases than in others, and this appears to be due to limited large-scale resolution so that large structures occur that are resolved in space but not resolved statistically. In appendix B, we demonstrate for several simulation cases that the scatter in the areas is much smaller when the simulation domain is eight times larger.
Isosurface areas normalised by the area of a horizontal plane in the simulations. The symbols mark the average for 20 isovalues and the bars indicate the range from the largest to smallest areas. The dotted line is a reference line, not a fitted line.

The provisional conclusion drawn from figure 3 is that the area increases with  $Pe_{\unicode[STIX]{x1D706}}^{1/2}$ for
 $Pe_{\unicode[STIX]{x1D706}}^{1/2}>50$ and may deviate from power-law scaling for
 $Pe_{\unicode[STIX]{x1D706}}^{1/2}<50$. The second part of this conclusion is influenced by the finding by Schumacher & Sreenivasan (Reference Schumacher and Sreenivasan2005) that the area increases with Péclet number but with no power-law scaling; they consider flows with lower
 $Re_{\unicode[STIX]{x1D706}}$ than all but our cases R24 and R48. We consider this conclusion in more detail in the remainder of this section, but we immediately note that it is not in agreement with the results of O’Neill & Soria (Reference O’Neill, Soria, May and Roberts2005), who report a decrease in area with increasing Reynolds and Schmidt numbers. Their result, however, is based on visual geometric methods, the limitations of which we discuss in § 1. Our results are in broad agreement with the conclusion of Catrakis et al. (Reference Catrakis, Aguirre and Ruiz-Plancarte2002) that small-scale similarity is expected; note that the current flow configuration does not allow us to compare with their results regarding variations in large-scale features of the flow, but we do consider the effects of large-scale resolution in appendix B and show that the average isosurface area does not change with domain size but the scatter in the areas of different isosurfaces in a simulation decreases as the domain size increases and the large-scale statistics improve.
Our range of  $Pe_{\unicode[STIX]{x1D706}}$ overlaps that of Schumacher & Sreenivasan (Reference Schumacher and Sreenivasan2005), but, except for our cases R24 and R42, our Reynolds numbers are much higher. So now let us consider our conclusions from the previous paragraph in more detail and, in particular, the point made by Schumacher & Sreenivasan (Reference Schumacher and Sreenivasan2005) that they do not expect to see fractal-like behaviour of isosurfaces because of the absence of inertial–convective and the viscous–convective subranges. Definitive identification of these subranges in a simulation is difficult because of noisy statistics in the spectra and structure functions and the presence of the so-called spectral blocking ‘bump’ at the top of the dissipation range; Ishihara et al. (Reference Ishihara, Gotoh and Kaneda2009, Reference Ishihara, Morishita, Yokokawa, Uno and Kaneda2016) provide reviews. We can say with confidence that we do not expect an inertial subrange in our cases R24, R42 and R98 but that subranges do exist in cases R245, R400 and R633. This is based not only on detailed analysis of our data (Almalkie & de Bruyn Kops Reference Almalkie and de Bruyn Kops2012a; de Bruyn Kops Reference de Bruyn Kops2015) but also on simulations by Yeung et al. (Reference Yeung, Donzis and Sreenivasan2005) and the two papers just cited (Ishihara et al. Reference Ishihara, Gotoh and Kaneda2009, Reference Ishihara, Morishita, Yokokawa, Uno and Kaneda2016). Yeung et al. (Reference Yeung, Donzis and Sreenivasan2005) show very clear inertial subranges for
 $Re_{\unicode[STIX]{x1D706}}\geqslant 240$, which corresponds to our cases R245, R400 and R633. Given the robust literature on the existence of inertial ranges as a function of
 $Re_{\unicode[STIX]{x1D706}}$, we do not show the inertial range analyses for all of our datasets here. We do so next for our case with the highest Péclet number because it has not been previously published.
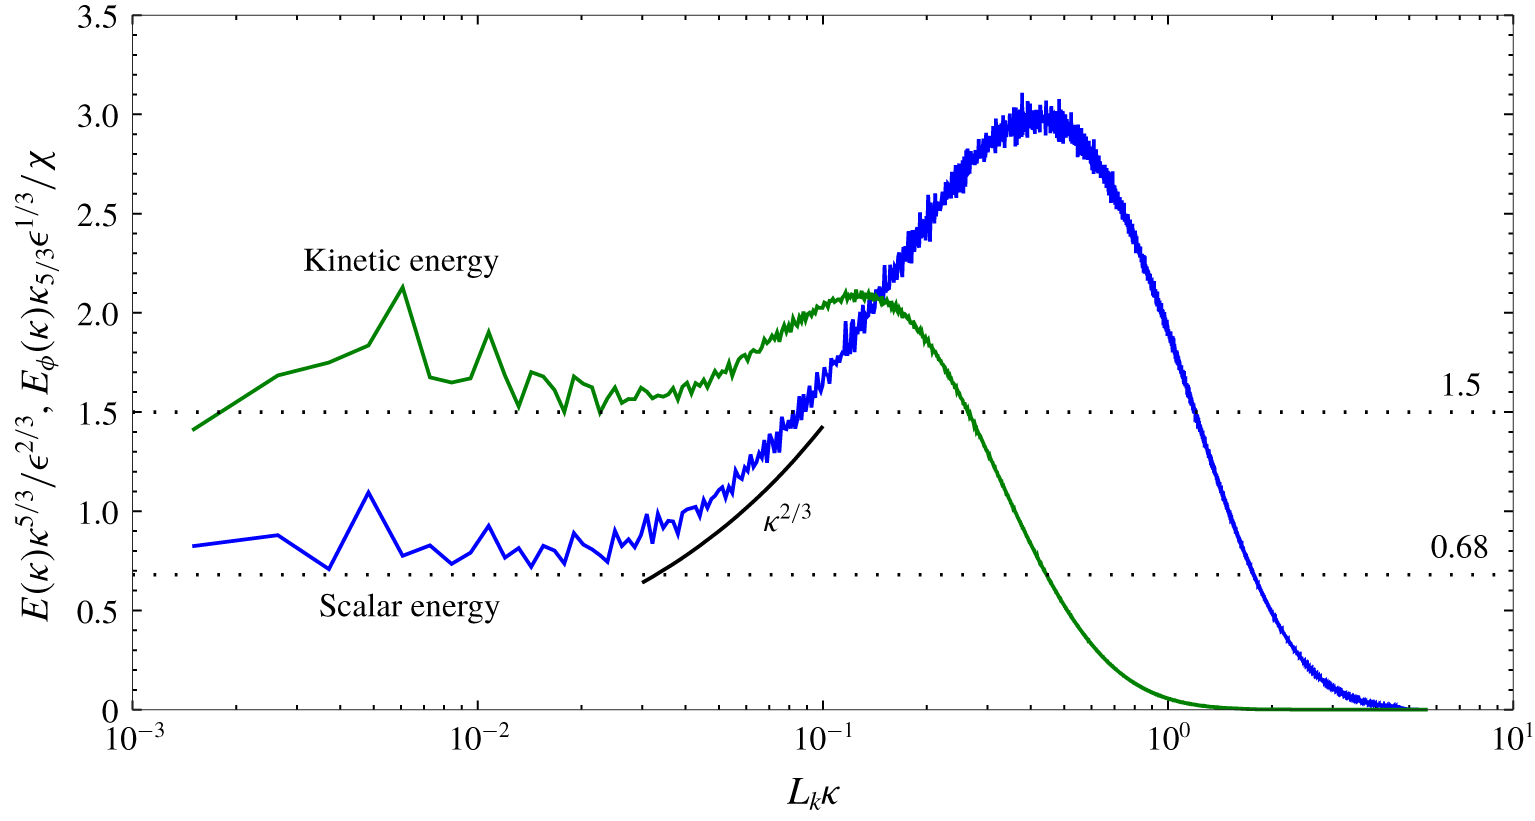
The compensated shell-averaged spectra of kinetic and scalar energies for the case with  $Pe_{\unicode[STIX]{x1D706}}=4429$ are shown in figure 4 with
 $E(\unicode[STIX]{x1D73F})$ and
 $E_{\unicode[STIX]{x1D719}}(\unicode[STIX]{x1D73F})$ the kinetic and scalar energy spectra, respectively,
 $\unicode[STIX]{x1D716}$ the domain-averaged dissipation rate of kinetic energy, and
 $\unicode[STIX]{x1D712}$ the corresponding value for scalar variance. The textbook value for the Kolmogorov constant of
 $C=1.5$ (Pope Reference Pope2000) is indicated by a horizontal dotted line on figure 4. The Obukhov–Corrsin constant
 $C_{\unicode[STIX]{x1D719}}=0.68$ is determined by Muschinski & de Bruyn Kops (Reference Muschinski and de Bruyn Kops2015) for a simulation very similar to the current cases with
 $Pe_{\unicode[STIX]{x1D706}}=280$ and 400 and is consistent with values determined by Sreenivasan & Kailasnath (Reference Sreenivasan and Kailasnath1996) and Watanabe & Gotoh (Reference Watanabe and Gotoh2004); it is also marked by a horizontal dotted line on figure 4. We conclude that the inertial–convective subrange spans approximately a decade in wavenumber based on the range over which the plateaus in both spectra correspond with the appropriate dotted line. The span of the subrange is consistent with the results of Yeung et al. (Reference Yeung, Donzis and Sreenivasan2005) for their case with
 $Re_{\unicode[STIX]{x1D706}}=700$.
Spherical shell-averaged spectra of kinetic and scalar energies for the case with  $Pe_{\unicode[STIX]{x1D706}}=4429$. The dotted lines indicate the expected levels for the inertial–convective range discussed in the text. The solid line marked
 $\unicode[STIX]{x1D73F}^{2/3}$ is the ‘slope’ of the compensated Batchelor spectrum, not a fitted curve.

The viscous–convective subrange is not as easy to identify because of the so-called ‘Hill bump’ that includes this subrange and continues into the dissipation range (Hill Reference Hill1978). The viscous–convective range, if it exists, is expected to begin at approximately  $L_{k}\unicode[STIX]{x1D73F}=0.03$ (Muschinski & de Bruyn Kops Reference Muschinski and de Bruyn Kops2015). If the viscous–convective subrange exists, then we expect to see the compensated scalar spectrum scaling with
 $\unicode[STIX]{x1D73F}^{2/3}$ and this scaling is marked on figure 4 with a solid line labelled accordingly. It appears that the scalar spectrum exhibits this scaling over a fraction of a decade of wavenumbers in the viscous–convective subrange. Of course, the spectrum necessarily transitions from the plateau to the Hill bump in the dissipation range, and so it is difficult to clearly identify a narrow viscous–convective subrange, which is why we do not present this analysis for the cases with lower
 $Pe_{\unicode[STIX]{x1D706}}$.
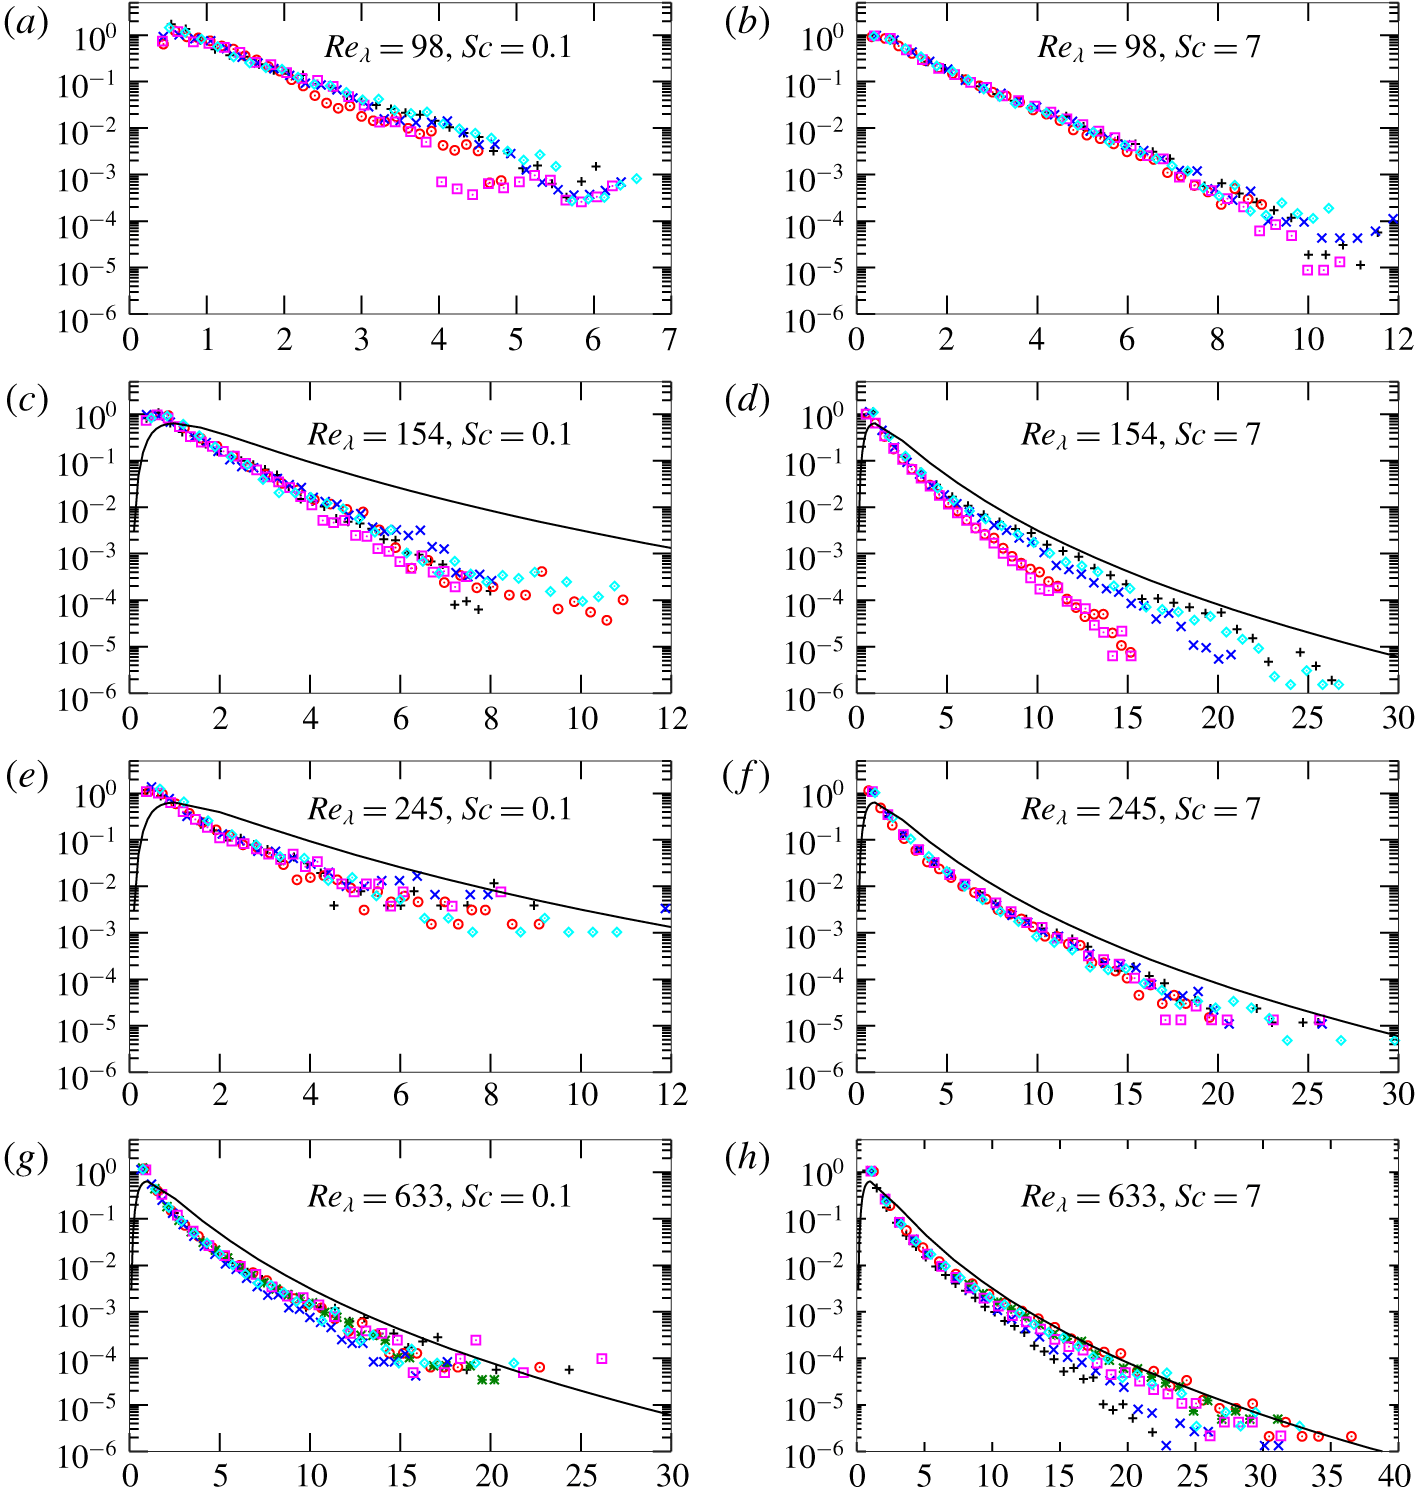
The p.d.f.s of the local gradient magnitudes on a layer normalised by the mean for that layer. The horizontal axis is  $|\unicode[STIX]{x1D735}\unicode[STIX]{x1D719}|_{V(\unicode[STIX]{x1D713},\unicode[STIX]{x0394}\unicode[STIX]{x1D719})}/\langle |\unicode[STIX]{x1D735}\unicode[STIX]{x1D719}|\rangle _{V(\unicode[STIX]{x1D713},\unicode[STIX]{x0394}\unicode[STIX]{x1D719})}$. Five layers are shown for each case with their nominal locations distributed uniformly over the vertical extent of the domain in this order of lowest to highest
 $\unicode[STIX]{x1D719}$: plus, circle, cross, square, diamond. In panels (c–h), the solid line marks the standard lognormal distribution.

Next, let us consider the probability density functions (p.d.f.s) of the local scalar gradient on an isosurface plotted for five layers in each case. In figure 5(a,b) the distributions are very close to exponential, consistent with the results of Schumacher & Sreenivasan (Reference Schumacher and Sreenivasan2005). In figure 5(e–h) they tend towards lognormal with the lognormal distribution being a very good model for some of the layers in panel (h). In figure 5(c,d), it is difficult to draw a conclusion, although in our opinion neither are the curves straight enough to be considered exponential nor is the lognormal distribution a good model. Note that the change in the distribution from exponential to one closer to lognormal appears primarily to be due to increased  $Re_{\unicode[STIX]{x1D706}}$ largely independent of either
 $Pe_{\unicode[STIX]{x1D706}}$ or
 $Sc$. This suggests that the exponential distribution occurs when there is no inertial–convective subrange. Recall that case R98 has no inertial subrange whereas our cases R245, R400 and R633 have characteristics of inertial subranges.
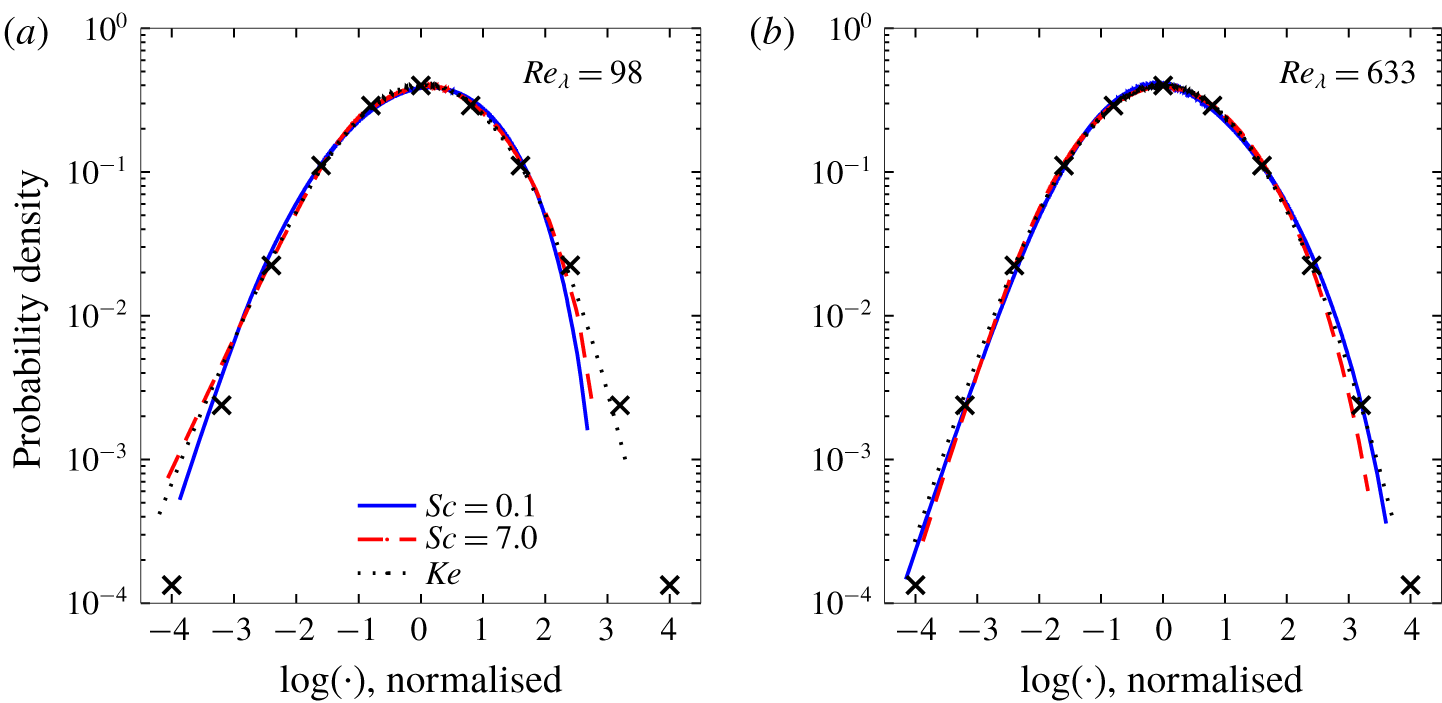
The p.d.f.s of the logarithm of the dissipation rates for the variances of scalars with  $Sc=0.1$ and 7.0 and for kinetic energy, all normalised by their means and variances. The crosses mark the standard Gaussian.

Significant scatter is observed figure 5 among the distributions for the five layers in each set. The governing equations we solve numerically describe a homogeneous flow, but in a simulation domain of finite size the homogeneity is not perfect. In appendix B we conclude that the areas of different isosurfaces converge to a common value as the domain size increases. So the effects of limited domain size observed in the scatter in figure 5 are interesting. This is most clear in figure 5(d) in which the lowest curve is approximately exponential while the upper curve is approximately lognormal. Recall from the literature reviewed in this section that an inertial–convective range is expected for  $Re_{\unicode[STIX]{x1D706}}>240$ but not necessarily at
 $Re_{\unicode[STIX]{x1D706}}=154$, which is the value for figure 5(c,d). The result is consistent with
 $Re_{\unicode[STIX]{x1D706}}>154$ being between
 $Re_{\unicode[STIX]{x1D706}}=98$, for which an inertial–convective range is not expected, and
 $Re_{\unicode[STIX]{x1D706}}=245$, for which one is expected.
A different view of the same data is presented in figure 6. More precisely, the p.d.f.s are shown for the natural logarithm of the local dissipation rate of scalar variance  $\unicode[STIX]{x1D712}_{0}=2D\unicode[STIX]{x1D735}\unicode[STIX]{x1D719}\boldsymbol{\cdot }\unicode[STIX]{x1D735}\unicode[STIX]{x1D719}$ using data for the whole domain. By plotting this quantity, comparisons can be made with the logarithm of the p.d.f. of the local dissipation rate of kinetic energy
 $\unicode[STIX]{x1D716}_{0}$. For
 $Re_{\unicode[STIX]{x1D706}}=98$,
 $\unicode[STIX]{x1D716}_{0}$ has an approximately lognormal distribution, except for very small values of
 $\unicode[STIX]{x1D716}_{0}$, whereas the scalar does not. For both cases shown with
 $Re_{\unicode[STIX]{x1D706}}=98$ and for
 $Re_{\unicode[STIX]{x1D706}}=633$ with
 $Sc=0.1$, we observe that the p.d.f. for high values of
 $\unicode[STIX]{x1D712}_{0}$ lies inside that of
 $\unicode[STIX]{x1D716}_{0}$. This behaviour was first noted, to our knowledge, in laboratory measurements in boundary layers (Antonia & Sreenivasan Reference Antonia and Sreenivasan1977) and later in DNS of HIT (e.g. Vedula, Yeung & Fox Reference Vedula, Yeung and Fox2001). For
 $Re_{\unicode[STIX]{x1D706}}=633$ and
 $Sc=7.0$, however, this behaviour occurs only at the very highest values of
 $\unicode[STIX]{x1D712}_{0}$. This suggests that, if the Péclet number were high enough, then the lognormal model would be a good approximation for
 $\unicode[STIX]{x1D712}_{0}$, except for very small values at which the p.d.f.s of
 $\unicode[STIX]{x1D712}_{0}$ and
 $\unicode[STIX]{x1D716}_{0}$ depart from lognormality but agree with each other.
7 Conclusions
The area of a scalar isosurface can be written exactly in terms of the limit of the volume of a thin layer as the layer thickness goes to zero, which is shown in the development of (2.6). Numerically evaluating (2.6) to arbitrarily small relative error in DNS via a Monte Carlo method requires being able to evaluate accurately the scalar field at arbitrary locations, which can be done in the case of pseudospectral simulations. We demonstrate the evaluation of the surface areas for an analytical test case and then with DNS data and observe the expected convergence behaviours as the thickness of the layer is reduced and the number of samples increases. For the DNS, it is observed that, with sufficient spatial resolution of the simulation and a sufficiently thin layer width, the relative error in the area of an isosurface can be reduced to  $1\times 10^{-4}$ or smaller. In the process of determining this, we verify the small-scale resolution criterion recently provided by Yeung et al. (Reference Yeung, Sreenivasan and Pope2018).
Next the methodology is applied to 28 DNS cases of statistically stationary HIT with a mean scalar gradient,  $0.1\leqslant Sc\leqslant 7$ and
 $24.0\leqslant Re_{\unicode[STIX]{x1D706}}\leqslant 633$. It is observed that the layer area is very nearly proportional to
 $Pe_{\unicode[STIX]{x1D706}}^{1/2}$ over the range
 $50\leqslant Pe_{\unicode[STIX]{x1D706}}\leqslant 4429$ and may depart from this scaling when
 $Pe_{\unicode[STIX]{x1D706}}<50$. This result is broadly consistent with the literature although direct comparisons are not possible because other studies used geometric estimates for isosurface areas rather than direct calculations.
To understand the results better, we expand on analysis by Schumacher & Sreenivasan (Reference Schumacher and Sreenivasan2005) and examine the p.d.f.s of the scalar gradient on multiple layers in each simulation and observe that at low  $Re_{\unicode[STIX]{x1D706}}$ they are modelled very well by an exponential distribution. For our highest
 $Re_{\unicode[STIX]{x1D706}}$ case, the lognormal distribution is a much better model, and we also see convincing evidence of the existence of a viscous–convective subrange in this case. Indeed, for
 $Re_{\unicode[STIX]{x1D706}}=633$ and
 $Sc=7.0$, the lognormal model is very good for the p.d.f. of the scalar dissipation rate, and the difference between the p.d.f. of the scalar and kinetic energy dissipation rates is extremely small. These results, combined with those of Schumacher & Sreenivasan (Reference Schumacher and Sreenivasan2005), suggest that the isosurface area scales with
 $Pe_{\unicode[STIX]{x1D706}}^{1/2}$ only if there is an inertial–convective subrange but does not require there to be a viscous–convective subrange. The new results also suggest that the difference between the p.d.f.s of the scalar and kinetic energy dissipation rates, which has long been observed, might occur only when the Reynolds number is not sufficiently high.
Acknowledgements
We thank Professors D. Storti and J. Riley for their valuable insights. High-performance computing resources were provided through the US Department of Defense High Performance Computing Modernization Program by the Army Engineer Research and Development Center and the Army Research Laboratory under Frontier Project FP-CFD-FY14-007.
Appendix A. Relationship between $A(\unicode[STIX]{x1D713})/V$ and $P(\unicode[STIX]{x1D719};\unicode[STIX]{x1D719}=\unicode[STIX]{x1D713})$


At the end of § 3 we note that the ratio  $V(\unicode[STIX]{x1D713},\unicode[STIX]{x0394}\unicode[STIX]{x1D719})/(V\unicode[STIX]{x0394}\unicode[STIX]{x1D719})$ is an approximation to
 $P(\unicode[STIX]{x1D719};\unicode[STIX]{x1D719}=\unicode[STIX]{x1D713})$. We show here our rationale for that statement and also present an analysis for the order of accuracy of (2.6). Recall from § 2 that
 $A(\unicode[STIX]{x1D713})$ denotes the exact area of the surface with
 $\unicode[STIX]{x1D719}=\unicode[STIX]{x1D713}$. The ratio
 $V(\unicode[STIX]{x1D713},\unicode[STIX]{x0394}\unicode[STIX]{x1D719})/V$ is the ratio of the number of locations with scalar value between
 $\unicode[STIX]{x1D713}$ and
 $\unicode[STIX]{x1D713}+\unicode[STIX]{x0394}\unicode[STIX]{x1D719}$ to the total number of locations, which equals the probability
 $p(\unicode[STIX]{x1D719};\unicode[STIX]{x1D713}\leqslant \unicode[STIX]{x1D719}<\unicode[STIX]{x1D713}+\unicode[STIX]{x0394}\unicode[STIX]{x1D719})$ of finding a point with scalar value in the range
 $[\unicode[STIX]{x1D719},\unicode[STIX]{x1D719}+\unicode[STIX]{x0394}\unicode[STIX]{x1D719})$. This equivalence of
 $V(\unicode[STIX]{x1D713},\unicode[STIX]{x0394}\unicode[STIX]{x1D719})/V$ with the probability of finding a position
 $\boldsymbol{x}$ such that
 $\unicode[STIX]{x1D719}(\boldsymbol{x})\in [\unicode[STIX]{x1D713},\unicode[STIX]{x1D713}+\unicode[STIX]{x0394}\unicode[STIX]{x1D719})$ follows from
 $\boldsymbol{x}$ being a uniformly distributed random variable. If
 $P(\unicode[STIX]{x1D719})$ is the p.d.f. of
 $\unicode[STIX]{x1D719}$ then, from the definition of a p.d.f.,
 $$\begin{eqnarray}\frac{V(\unicode[STIX]{x1D713},\unicode[STIX]{x0394}\unicode[STIX]{x1D719})}{V}=p(\unicode[STIX]{x1D719};\unicode[STIX]{x1D713}\leqslant \unicode[STIX]{x1D719}+\unicode[STIX]{x0394}\unicode[STIX]{x1D719})=\int _{\unicode[STIX]{x1D713}}^{\unicode[STIX]{x1D713}+\unicode[STIX]{x0394}\unicode[STIX]{x1D719}}P(\unicode[STIX]{x1D719})\,\text{d}\unicode[STIX]{x1D719}.\end{eqnarray}$$
Using the rectangle rule, the left-hand side of (2.4) can be written as
 $$\begin{eqnarray}\int _{\unicode[STIX]{x1D713}}^{\unicode[STIX]{x1D713}+\unicode[STIX]{x0394}\unicode[STIX]{x1D719}}A(\unicode[STIX]{x1D719})\,\text{d}\unicode[STIX]{x1D719}=A(\unicode[STIX]{x1D713})\unicode[STIX]{x0394}\unicode[STIX]{x1D719}+k_{A}(\unicode[STIX]{x0394}\unicode[STIX]{x1D719})\unicode[STIX]{x0394}\unicode[STIX]{x1D719}^{2},\end{eqnarray}$$
where  $k_{A}(\unicode[STIX]{x0394}\unicode[STIX]{x1D719})$ denotes the maximum value of
 $\text{d}A(\unicode[STIX]{x1D719})\,\text{d}\unicode[STIX]{x1D719}$ in the domain
 $[\unicode[STIX]{x1D713},\unicode[STIX]{x1D713}+\unicode[STIX]{x0394}\unicode[STIX]{x1D719})$. Using (2.4), (A 1) and (A 2), we arrive at
 $$\begin{eqnarray}\frac{A(\unicode[STIX]{x1D713})\unicode[STIX]{x0394}\unicode[STIX]{x1D719}+k_{A}(\unicode[STIX]{x0394}\unicode[STIX]{x1D719})\unicode[STIX]{x0394}\unicode[STIX]{x1D719}^{2}}{V}=\int _{\unicode[STIX]{x1D713}}^{\unicode[STIX]{x1D713}+\unicode[STIX]{x0394}\unicode[STIX]{x1D719}}P(\unicode[STIX]{x1D719})\,\text{d}\unicode[STIX]{x1D719}\,\langle |\unicode[STIX]{x1D735}\unicode[STIX]{x1D719}|\rangle _{V(\unicode[STIX]{x1D713},\unicode[STIX]{x0394}\unicode[STIX]{x1D719})}.\end{eqnarray}$$
Dividing through by  $\unicode[STIX]{x0394}\unicode[STIX]{x1D719}$ yields
 $$\begin{eqnarray}\frac{A(\unicode[STIX]{x1D713})}{V}=\frac{\displaystyle \int _{\unicode[STIX]{x1D713}}^{\unicode[STIX]{x1D713}+\unicode[STIX]{x0394}\unicode[STIX]{x1D719}}P(\unicode[STIX]{x1D719})\,\text{d}\unicode[STIX]{x1D719}}{\unicode[STIX]{x0394}\unicode[STIX]{x1D719}}\langle |\unicode[STIX]{x1D735}\unicode[STIX]{x1D719}|\rangle _{V(\unicode[STIX]{x1D713},\unicode[STIX]{x0394}\unicode[STIX]{x1D719})}-\frac{k_{A}(\unicode[STIX]{x0394}\unicode[STIX]{x1D719})}{V}\unicode[STIX]{x0394}\unicode[STIX]{x1D719},\end{eqnarray}$$
which is a first-order approximation for the area-to-volume ratio. Finally, approximating the integral of the p.d.f. with the rectangle rule results in
 $$\begin{eqnarray}\frac{A(\unicode[STIX]{x1D713})}{V}=\frac{P(\unicode[STIX]{x1D719};\unicode[STIX]{x1D719}=\unicode[STIX]{x1D713})\unicode[STIX]{x0394}\unicode[STIX]{x1D719}+k_{p}(\unicode[STIX]{x0394}\unicode[STIX]{x1D719})\unicode[STIX]{x0394}\unicode[STIX]{x1D719}^{2}}{\unicode[STIX]{x0394}\unicode[STIX]{x1D719}}\langle |\unicode[STIX]{x1D735}\unicode[STIX]{x1D719}|\rangle _{V(\unicode[STIX]{x1D713},\unicode[STIX]{x0394}\unicode[STIX]{x1D719})}-\frac{k_{A}(\unicode[STIX]{x0394}\unicode[STIX]{x1D719})}{V}\unicode[STIX]{x0394}\unicode[STIX]{x1D719},\end{eqnarray}$$
where  $k_{P}(\unicode[STIX]{x0394}\unicode[STIX]{x1D719})$ is the maximum value of
 $\text{d}P(\unicode[STIX]{x1D719})\,\text{d}\unicode[STIX]{x1D719}$ in the domain
 $[\unicode[STIX]{x1D713},\unicode[STIX]{x1D713}+\unicode[STIX]{x0394}\unicode[STIX]{x1D719})$. By comparing (A 5) and (2.6) we see that, if the Monte Carlo integration of the latter is converged, then it provides a first-order approximation of
 $P(\unicode[STIX]{x1D719};\unicode[STIX]{x1D719}=\unicode[STIX]{x1D713})$. The integral in (A 2) can also be evaluated with a higher-order approximation. Shete (Reference Shete2019, chap. 5, figure 5.10) evaluates the integral using the midpoint rule, which is a second-order method, and obtain second-order convergence with layer thickness. The definition of
 $P(\unicode[STIX]{x1D719})$ in the turbulence literature (e.g. Pope Reference Pope2000) is as the limit of a histogram with bins extending from
 $\unicode[STIX]{x1D719}$ to
 $\unicode[STIX]{x1D719}+\unicode[STIX]{x0394}\unicode[STIX]{x1D719}$. To strictly preserve the relationships discussed in this appendix, we have used first-order integration to evaluate isosurface areas in this paper.
Appendix B. Effect of large scales
Equation (2.3) shows that an isosurface area is a function of  $\unicode[STIX]{x1D735}\unicode[STIX]{x1D719}$, and Catrakis et al. (Reference Catrakis, Aguirre and Ruiz-Plancarte2002) conclude that, while large and small length scales in a jet contribute to the area–volume ratio, the dominant effect is at the small scales. Therefore, we do not expect the area calculations to be strongly affected by domain size. Also, in conjunction with figure 3 we assert that, while the equations and boundary conditions describe a homogeneous flow, the simulations are not perfectly homogeneous because the domain size is finite so that different isosurfaces have slightly different areas. The error bars in figure 3 indicate the extent to which the statistics of the large scales are not resolved in each simulation. In principle the large-scale statistics can be improved by aggregating them over time, but it is impracticable to advance large simulations for sufficiently long times, and doing so would not improve the statistics for a single snapshot of the flow. Therefore, in this appendix, we examine the effects on our conclusions of the large scales and their statistical convergence in single snapshots in time.
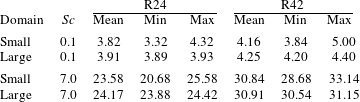
We compare here the isosurface areas for pairs of equivalent simulations. The first simulation in each pair is that used for the main body this paper and denoted either R24 or R42. The second simulation in each pair is statistically the same but resolved in a domain eight times larger in each dimension. The small-scale resolution for both variants of R24 is the same, while for R42 the grid spacing in the large domain is twice that in the small domain. The ratio of the domain size to the integral length scale  ${\mathcal{L}}/L$ is approximately 45 for the large domain size, which is significantly larger than the value of 20 reported by de Bruyn Kops & Riley (Reference de Bruyn Kops and Riley1998a) as being necessary for decaying HIT to have sufficiently large-scale resolution to decay at the same rate as grid turbulence in a wind tunnel.
The results from this test are tabulated in table 3 for the scalar fields with the highest and lowest Schmidt numbers. In each case, the mean surface area for the large domain is within the range of areas for the small domain, and the difference between the minimum and maximum areas is smaller for the larger domain. We conclude that the surface areas are insensitive to the size of the domain and that the areas of all isosurfaces approach the same value as the domain size increases.
The mean, minimum and maximum isosurface areas in equivalent simulations run in differing domain sizes. All areas are per unit volume times the volume of the smaller domain.