I. INTRODUCTION
Membrane separation technologies generally have the advantages of low energy consumption, suitable for the separation of heat-sensitive material, easy recycling, and no secondary pollution. Therefore, the technologies have broad applying prospect. However, current commercial membranes are expensive, and membrane fouling sharply increases the frequency of backwashing, so the lifetime of membranes is impaired. Therefore, research and development of low-cost, highly hydrophilic, and preferable antifouling property membranes is eagerly needed. Reference Le-Clech, Chen and Fane1–Reference Van der Bruggen, Mänttäri and Nyström5
Poly(vinyl butyral) (PVB) can be regard as an attractive material for preparing membrane, because it can endure low temperature, light, change in humidity, bacteria, microorganism, alkali, and diluent acid. Reference Qiu, Qi and Wei6–Reference Qiu, Hideto, Zhong, Ye and Huang9 In addition, PVB is a product of the reaction between poly (vinyl alcohol) (PVA) and butyl aldehyde in the presence of an acid catalyst. Therefore, PVB is hydrophilic to some extent, for it retains a PVA part. Reference Qiu and Matsuyama10,Reference Dhaliwal and Hay11 However, hydrophilicity of PVB is not necessarily enough to prevent the membrane fouling. Although it has good elasticity, the PVB membrane is brittle and not good enough in the membrane forming property and permeability. Reference Fu, Matsuyama, Teramoto and Nagai12 But overall, PVB is still a promising material in the membrane preparation field. To make the PVB membranes be widely used in the waste water treatment, modifying PVB membranes is necessary.
Currently, several research groups have focused on the modification of PVB membranes by blending, due to blending is the simplest method to modify PVB membranes. For instance, Yan and Wang Reference Yan and Wang13 reported the performance of the PVB/polyvinylidene fluoride (PVDF) blend membranes, and the results showed that the PVB/PVDF blending system was partially compatible and the permeability of the PVB/PVDF blended membranes was much more than that of the pure PVB and PVDF membranes. However, the addition of PVDF was useless for the enhancement of mechanical performances. Qiu et al. Reference Qiu, Hideto, Zhong, Ye and Huang9 reported the effects of blend composition on the performance of hydrophilic PVB/Pluronic F127 (F127) blend hollow fiber membranes. The results showed that when the hollow fiber membranes were prepared under the following conditions: take-up speed 0.172 m·s−1, water bath temperature 25 °C, and air-gap 5 mm, the water permeability obviously increased. In contrast, the rejection slightly changed with the increase of the F127 content when it was less than 5 wt%. In addition, more F127 in the polymer solution could increases the hydrophilicity of the blend membrane prepared at air-gap 5 mm and the bovine serum albumin (BSA) adsorption decreased with the increase of the F127 content when F127 content was less than 5 wt%. Fu et al. Reference Fu, Matsuyama, Teramoto and Nagai12 prepared PVB/poly (ethylene-co-vinyl alcohol) (EVOH) blend hollow fiber membranes by thermally induced phase separation and polyethylene glycols (PEG) (Mw = 200) as diluent. The results showed that with increasing EVOH content, the PVB/EVOH blend membranes had higher hydrophilicity and water permeability. In particular, the addition of EVOH could improve the mechanical property of hollow fiber membrane effectively.
Polyethersulfone (PES) is widely used in membrane preparation for various applications, due to its toughness, good thermal resistance, and chemical inertness. However, hydrophobic property and high price of PES often limit its application. Reference Kim and Kim14,Reference Ulbricht, Schuster, Ansorge, Ruetering and Steiger15 To circumvent these problems, numerous studies on the improvement of PES membrane hydrophilicity have been performed, such as coating, Reference Ma, Su, Sun, Wang and Jiang16,Reference Moghimifar, Raisi and Aroujalian17 grafting, Reference Peng, Su, Shi, Chen and Jiang18,Reference Yune, Kilduff and Belfort19 blending, Reference Mahendran, Malaisamy and Mohan20–Reference Rahimpour and Madaeni22 and so on. Among these methods, sulfonation of PES is proven to be an effective way to obtain desired properties, which can be achieved by supplying sulfonic acid groups (–SO3H) into polymer chain of PES. Reference Gao, Robertson, Guiver, Jian, Mikhailenko, Wang and Kaliaguine23–Reference Kang, Choi, Choi, Yoon and Moon25 Sulfonated polyethersulfone (SPES) is much more extensively utilized due to its high hydrophilicity, excellent protein resistance, and superior biocompatibility. In addition, SPES also retains the excellent properties of PES. Reference Guan, Zou, Lu, Gong and Liu26 For example, Zhao et al. Reference Zhao, Mou, Zhang, Shi, Sun and Zhao27 synthesized SPES by introducing sulfonic groups onto amino-substituted PES. The results showed that the SPES/PES blending system was fully miscible. The water contact angles decreased after the PES sulfonated, and the water fluxes had increased sharply when the blended amount of SPES increased from 0 to 2 wt%. In addition, the activated partial thromboplastin time and plasma recalcification time increased dramatically and the blood platelet adhesion on the PES membrane was largely suppressed for the modified membrane. Guan et al. Reference Guan, Zou, Lu, Gong and Liu26 prepared SPES by sulfonating poly (ether sulfone) with chlorosulfonic acid as sulfonating agent and concentrated sulfuric acid as solvent. The results showed that with the increase of degree of sulfonation (DS), the water uptakes and hydrophilicity of SPES membranes became higher. Moreover, SPES membranes became more hydrophilic than PES membranes.
A PVB/SPES blending system has not yet been reported. Therefore, the purpose of this work is to develop a new polymer membrane—PVB/SPES blend membranes using the solvent–nonsolvent diffusion-induced phase separation method and investigate the effects of DS on the properties of the PVB/SPES blend membranes. The compatibility of PVB/SPES blending systems was studied by shear viscosity and Fourier transform infrared attenuated total reflection (FTIR-ATR). The morphologies of blend membranes were investigated by scanning electron microscope (SEM), and hydrophilicity was demonstrated by contact angle, equilibrium water content (EWC) and x-ray photoelectron spectroscopy (XPS). Other performances, such as water flux, rejection, tensile strength, and fouling resistance measurements, were also researched in this study.
II. EXPERIMENTAL SECTION
A. Materials
PVB (aircraft-grade, Mw = 4000–7000), PES (Ultrason E6020P, Mw = 59,000) and dried at 100 °C for 24 h before use. N,N-dimethylacet-amide (DMAC), concentrated sulfuric acid (98%) and fuming sulfuric acid (20%), BSA (Mw = 67,000), phosphate buffer solution (PBS) were reagent grade.
B. Synthesis of the SPES
The SPES was synthesized as follows Reference Guan, Zou, Lu, Gong and Liu26,Reference Gao, Robertson, Guiver and Jian28,Reference Nolte, Ledjeff, Bauer and Mülhaupt29 : first a specified volume of PES flakes was introduced into a three-neck flask with a certain amounts of concentrated sulfuric acid and the mixture was stirred sufficiently for about 4 h at room temperature to form homogeneous solution. Then, the variation of ratio of fuming sulfuric acid (20%) was added dropwise into the reaction vessel with continuous stirring at a constant temperature of 25 °C. The resulting reaction mixture was stirred for an additional 12 h. Then, the polymer product was dipped in ice-cold deionized water under agitation, and washed sufficiently with deionized water until the pH was 6–7. The SPES was collected and dried completely in an oven at 80 °C. The DS, which can reflect the sulfonation level, is calculated according to the Eq. (1):
 $${\rm{DS}} = {{0.232M \times V} \over {m - 0.08M \times V}} \times 100\% \quad ,$$
where M (mol/L) is the concentration of standard NaOH solution, V (mL) is the NaOH solution volume used to neutralize, and m (g) is the SPES sample mass.
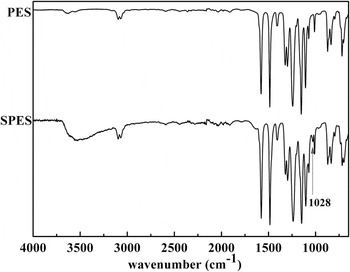
To confirm the successful polymerization of sulfonic acid groups (–SO3H) onto PES, the SPES was studied by FTIR-ATR (TENSOR37, BRUKER, Karlsruhe, Germany).
C. Compatibility study of the PVB/SPES blending system
Compatibility is a qualitative description, which is a main factor in choosing the optimum blend ratio and deciding morphologies and performance of blended polymers. A better compatibility makes the blend membrane has better performance than any of those pure polymers. However, if the blending system has a poor compatibility, the structure of blend membrane is disorder and its mechanical properties are bad.
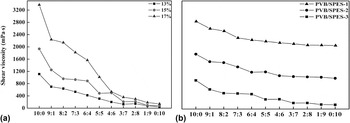
Shear viscosities of the solutions with different blend ratios of PVB/SPES were measured in a rotating viscometer (DNJ-1, JINGH-AI, China) with a constant shear rate at a temperature of 85 °C.
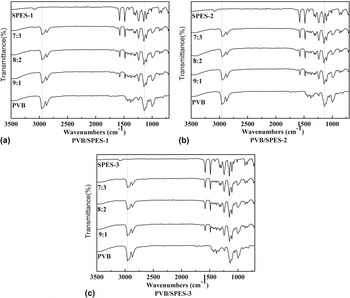
FTIR-ATR was another way to estimate the compatibility of the PVB/SPES blending systems. The casting polymer solutions were prepared by dissolving polymers in DMAC at different blend ratios of PVB/SPES. The samples were placed on the sample holder and all spectra were recorded across a wave number range of 4000–650 cm−1 by cumulating 32 scans at a resolution of 2 cm−1.
D. Preparation of blend membranes
Flat sheet porous PVB/SPES blend membranes were prepared by the solvent–nonsolvent diffusion-induced phase separation method. The casting solutions were prepared at 85 °C for dissolution of PVB/SPES in DMAC with a certain concentration of the polymer and stirred to form a homogenous solution. The casting solutions were filtered and then evacuated to remove any undissolved residuals and air bubbles at the above referenced temperature. The homogenous solutions were then cast on a glass plate and immediately immersed in a coagulation bath maintained at 20 °C. Then, the membranes were removed from the glass plate and leached overnight in water to remove completely any traces of solvent. The membranes were subsequently held in 50 wt% glycerol aqueous solution for 24 h to avoid the collapse of the porous structure. Membranes were freeze-dried (Heto PowerDry LL 3000, Gene) and stored for testing.
E. Characterization of the PVB/SPES blend membranes
1. Structure of the blend membranes
The morphologies of PVB/SPES blend membranes were observed by SEM (JSM-5600LV, Akishima, Japan). The membranes were frozen in liquid nitrogen, broken, and sputtered with gold before SEM analysis.
2. The permeability and rejection of the blend membranes
To measure the transport properties of flat membranes in relation to water, a cross-flow cell was used. The system consisted of a filtration cell (self-made) with a volume capacity of 200 mL and a filter area of 24 cm2. The pressure required for the testing of membranes was secured by micro diaphragm pump (DP-310). The water flux (J w) was calculated from measurements of the volume of the permeate unit of time under a pressure of 0.1 MPa at a temperature of 20 ± 1 °C. Each membrane was initially pressurized until there was no further variation in permeate flux for 2 h at 0.10 MPa before use. The water flux J w [L/(m2·h)] is calculated by the following Eq. (2):
 $${J_{\rm{w}}} = {V \over {At}}\quad ,$$
where V (L), A (m2), and t (h) are the volume of permeated water, the membrane filtering area, and the permeation time, respectively.
The same cell was filled with 1.0 mg/mL BSA solution (at pH 7.0 in PBS) for the rejection experiment at a stirring speed of 300 rpm and a temperature of 20 ± 1 °C. Then, the concentration of both feed (C f) and permeate solution (C p) was determined by a total organic carbon analyzer (TOC-VCPN, Shimadzu, Kyoto, Japan) at an operating pressure of 0.1 MPa for 2 h. The BSA rejection (R) is calculated by the following Eq. (3):
 $$R = {{{C_{\rm{f}}} - {C_{\rm{p}}}} \over {{C_{\rm{f}}}}} \times 100\% \quad ,$$
where C f (mg/L) and C p (mg/L) are the protein concentrations of the feed solution and permeate solution, respectively.
3. Water contact angle, EWC, and the surface chemical composition of the PVB/SPES blend membranes
Contact angles were measured with a contact angle meter (SL200C, SOLON, Shanghai, China) at a temperature of 20 °C. A dry membrane was cut into a rectangular shape, a few drops of water were dripped onto the membrane sample with a microinjector. The static contact angle was obtained by the average value of contact angles measured 5 times at different places on the membrane sample.
EWC was measured with a moisture analyzer (DHS-16A, QINGHAI, Shanghai, China). The membranes were swollen at 20 °C for 12 h, and the free liquid on all surfaces of the swollen membrane was padded dry with filter paper before weighing. The EWC was calculated by the following Eq. (4):
 $${\rm{EWC}} = {{{G_{{\rm{wet}}}} - {G_{{\rm{dry}}}}} \over {{G_{{\rm{wet}}}}}} \times 100\% \quad ,$$
where G dry (g) and G wet (g) are the weights of the dry membrane and the swollen membrane in equilibrium with water, respectively.
The chemical compositions of the PVB/SPES blend membrane surfaces were analyzed by XPS (PHI). XPS experiments were carried out on a RBD upgraded PHI-5000C ESCA system (Perkin Elmer) using Mg Ka as radiation source (hʋ = 1253.6 eV). The take-off angle of the photoelectron was set at 90°. Survey spectra of membranes were collected over a range of 0–1100 eV.
4. Tensile strength and elongation
The tensile strength and elongation of the blend membranes were measured with a materials testing machine (H5K-S, Salfords, UK) with a stretching rate of 20 mm/min at room temperature. Each specimen was fixed vertically between two pairs of tweezers with the length of 50 mm. The tensile strengths were calculated on the basis of the cross-sectional areas of the blend membranes. The average of the three membranes was taken as the mean tensile strength and elongation for each type of membranes.
5. Fouling resistance tests
A cross-flow stirred cell filtration system connected with a micro diaphragm pump and solution reservoir was designed to evaluate the filtration performance of membranes. All fouling resistance tests were carried out using a filtration cell as mentioned in Sec. II. E. 2 and at a stirred speed of 450 rpm and a temperature of 20 ± 1 °C. Each PVB/SPES blend membrane with blend ratio of 8:2 was initially compacted at a trans-membrane pressure of 0.1 MPa with distilled water until the constant pure water flux (J w1) value was obtained (about 5 h). The cell was then filled with protein solution (1.0 mg/mL BSA at pH 7.0 in PBS) immediately. The permeate flux of the BSA solution (J wB) was also recorded at a constant trans-membrane pressure of 0.1 MPa about 5 h. After that, the cell was completely emptied, and the membrane was brought out of the cell and removed surface dirt with a brush and thoroughly washed with plenty of distilled water. Afterward, a backwash was performed at a trans-membrane pressure of 0.2 MPa for 15 min, and the after-cleaning pure water flux (J w2) was measured in the similar way as J w1. The flux recovery ratio (FRR), the total fouling ratio (R t), reversible fouling ratio (R r), and irreversible fouling ratio (R ir) are determined by the following Eqs. (5)–(8) (Refs. Reference Daraei, Madaeni, Ghaemi, Khadivi, Astinchap and Moradian30–Reference Vatanpour, Madaeni, Moradian, Zinadini and Astinchap32):
 $${\rm{FRR}} = {{{J_{{\rm{w}}2}}} \over {{J_{{\rm{w}}1}}}} \times 100\% \quad ,$$
 $${R_{\rm{t}}} = 1 - {{{J_{{\rm{wB}}}}} \over {{J_{{\rm{w}}1}}}} \times 100\% \quad ,$$
 $${R_{\rm{r}}} = {{{J_{{\rm{w}}2}} - {J_{{\rm{wB}}}}} \over {{J_{{\rm{w}}1}}}} \times 100\% \quad ,$$
 $${R_{{\rm{ir}}}} = {{{J_{{\rm{w}}1}} - {J_{{\rm{w}}2}}} \over {{J_{{\rm{w}}1}}}} \times 100\% \quad .$$
The ratio R t is the sum of R r and R ir.
Obviously, a higher FRR indicates preferable antifouling properties of the ultrafiltration membranes.
Reversible fouling allows water flux recovery, which can be removed by simple hydraulic cleaning. In contrast, irreversible fouling is attributed to any observed decrease in the flux of pure water before and after the filtration of a BSA solution and strong adsorption of BSA molecules on the surface or entrapment of BSA molecules in pores. Reference Peng, Su, Shi, Chen and Jiang18,Reference Vatanpour, Madaeni, Moradian, Zinadini and Astinchap32,Reference Pieracci, Crivello and Belfort33
III. RESULTS AND DISCUSSION
A. FTIR-ATR analysis of SPES
FTIR-ATR spectra could be used to confirm the pendant –SO3H group on the polymer chain. Figure 1 shows the respective IR spectra of PES and SPES. Strong FTIR characteristic peak of –SO3H (1208 cm−1) is observed for the SPES, indicating that the sulfonic acid groups have been successfully introduced into the SPES chains. Reference Guan, Zou, Lu, Gong and Liu26,Reference Lawrence and Yamaguchi34
FTIR-ATR spectra of the PES and SPES.

B. Compatibility of the PVB/SPES blend membranes
The studies of Kuleznev et al. Reference Kuleznev, Melnikova and Klykova35 and Singh Y.P. Reference Singh and Singh36 revealed that the compatibility of polymer blending system could be described by the curve of the viscosity–constitute. If the curve of the viscosity–constitute of the blending system is linear, the polymers are fully miscible; if the curve of the viscosity–constitute is nonlinear, the polymers are partial miscible; if the curve of the viscosity–constitute is an S-segment, the polymers are fully immiscible.
The viscosity–constitute curves of the PVB/SPES blending systems with different concentrations (13, 15, and 17% wt%, DS = 27%) and DS (9, 15, and 27%) is showed in Fig. 2. The curves of viscosity–constitute of all PVB/SPES blending systems are nonlinear, which state that PVB/SPES blending systems are partially compatible.
The shear viscosity of the PVB/SPES blending systems, (a) for different concentrations of the PVB/SPES-3 blend system and (b) for different DS, respectively.

Figure 3 shows FTIR-ATR spectra of different amounts of PVB/SPES membranes with different DS. In the FTIR spectrum of the pure PVB membrane, the absorbance at 2956 cm−1 corresponded to the stretching vibration peaks of –CH3 and the band at 1144 cm−1 can be assigned to C–O–C stretching vibrations. It can be seen from the FTIR-ATR spectra of PVB/SPES-1 blend membranes that the peak position of –CH3 at 2956 cm−1 is slightly different from that of pure PVB membranes and intensity is decreased. When the blend ratio of PVB/SPES-1 is 7:3, the C–O–C stretching vibrations peak of PVB shifts to 1149 cm−1 and decreases in intensity. In the FTIR spectra of the PVB/SPES-2 blend membranes, the peak position of –CH3 at 2956 cm−1 slightly shifts to lower wave number. With increasing SPES-2 content, the C–O–C stretching vibrations of PVB at 1144 cm−1 decrease in intensity and shift to the higher-frequency direction. In the FTIR spectra of the PVB/SPES-3 blend membranes, the peak position of –CH3 at 2956 cm−1 shifts to lower frequency direction, and the C–O–C stretching vibrations at 1144 cm−1 of PVB are significantly shifted to a higher frequency direction and intensity decrease obviously. The changes of peak position and intensity of –CH3 at 2956 cm−1 and C–O–C at 1149 cm−1 are related to the C–H stretching vibration peak on the benzene ring at 3097 cm−1 and S=O stretching vibration peak at 1149 cm−1 of SPES.
FTIR-ATR spectra of different amounts of the PVB/SPES blend membranes with different DS of (a) 9%, (b) 15%, and (c) 27%.

These phenomena divulge that the PVB/SPES blending system is partially compatible. Reference Li37 Furthermore, it can be concluded from the results that the interaction between PVB and SPES-3 is the strongest, and the PVB/SPES-3 blending system exhibits the best compatibility, when the blend ratio varies from 9:1 to 7:3.
C. Morphology
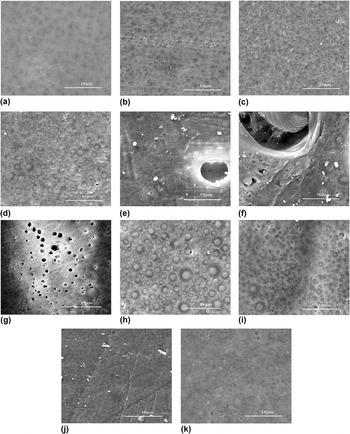
SEM is used to investigate the surface and cross-sectional microstructure of the PVB/SPES blend membranes with different composition and DS.
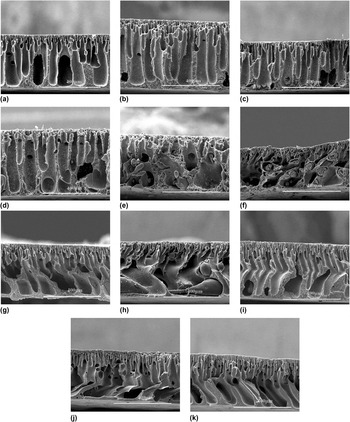
The surface and cross-sectional images of the PVB/SPES-3 blend membranes with different ratios are shown in Figs. 4 and 5, respectively. It can be clearly seen from the surface images of the PVB/SPES-3 blend membranes, with increasing SPES-3 content, the number and size of pores on the membrane surfaces increased, when the blend ratio ranges from 10:0 to 5:5. While, with the SPES-3 content continue to increase, the number and size of pores on the membrane surfaces decreased. As shown in Figs. 4(e) and 4(f), the pores on the PVB/SPES-3 blend membranes distribute irregularly, which may be because of the immiscibility of the blending system. It is obviously seen that when the blend ratio of PVB to SPES-3 changes from 10:0 to 7:3 and from 3:7 to 0:10, the cross-sectional structures of the PVB/SPES-3 blend membranes are consisted of finger-like structure and spongy structure. This phenomenon implies that the interaction between PVB and SPES-3 is strong and the compatibility of the PVB/SPES-3 blending system is good. Meantime, when the blend ratio varies from 9:1 to 7:3, due to the introduction of the hydrophilic SPES-3 group, the apertures of the fingerlike structures become larger. While, when the blend ratio varies from 3:7 to 1:9, with an increase in SPES-3 content, the skin layers of the PVB/SPES-3 blend membrane are denser, for the faster exchange rate between solvent and nonsolvent. Obviously, the membranes with blend ratios of 10:0 and 0:10 tend to generate bigger fingerlike and denser sponge like pores. This may be because of the segregation of PVB and SPES-3, respectively. However, when the blend ratio of PVB/SPES-3 varies from 4:6 to 6:4, the typical asymmetric structures of ultrafiltration or microfiltration membranes disappear, and the structures of cross section are irregular. This is due to the weak interaction between PVB and SPES-3 and the bad compatibility of the PVB/SPES-3 blending system.
SEM surface morphology images of the PVB/SPES-3 blending systems with different blend ratios of (a) 10:0, (b) 9:1, (c) 8:2, (d) 7:3, (e) 6:4, (f) 5:5, (g) 4:6, (h) 3:7, (i) 2:8, (j) 1:9, and (k) 0:10.

SEM cross-sectional images of the PVB/SPES-3 blending systems with different blend ratios of (a) 10:0, (b) 9:1, (c) 8:2, (d) 7:3, (e) 6:4, (f) 5:5, (g) 4:6, (h) 3:7, (i) 2:8, (j) 1:9, and (k) 0:10.

Above all, the variation trend of the surface and cross sectional of the PVB/SPES-3 blend membranes with different blend ratios furthermore implies that the PVB/SPES-3 blending system is partially compatible and is bound to have a great effect on flux, rejection, and mechanical properties.
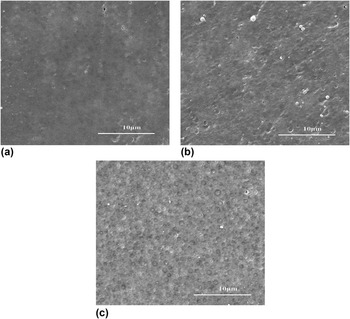
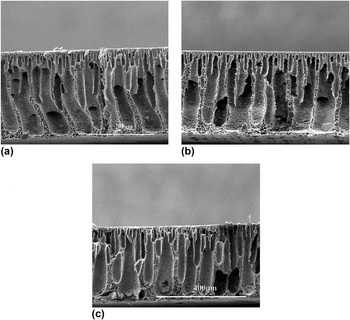
The surface morphologies of the PVB/SPES membranes with different DS (blend ratio is 8:2) are shown in Fig. 6. With increasing DS, the number of pores on the membrane surfaces increases. Meanwhile, Fig. 7 shows the SEM cross-sectional images of the PVB/SPES membranes with different DS. The cross-sectional microstructures of the PVB/SPES blend membranes are the typical asymmetric structure of ultrafiltration or microfiltration membranes, namely with dense skin layers, finger-like porous sublayers and spongy-like bottom layers. The addition of SPES with higher DS caused bigger finger-like pores.
SEM surface morphology images of the PVB/SPES blending systems with different DS of (a) 9%, (b) 15%, and (c) 27%.

SEM cross-sectional images of the PVB/SPES blending systems with different DS of (a) 9%, (b) 15%, and (c) 27%.

D. The flux and rejection of the PVB/SPES blend membranes
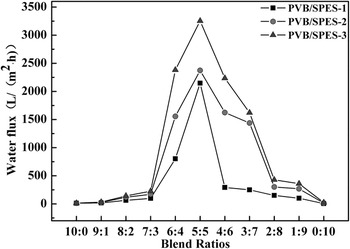
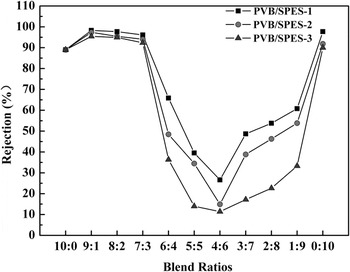
The effects of DS on the pure water flux and rejection of the PVB/SPES blend membranes are shown in Figs. 8 and 9, respectively. All the PVB/SPES blend membranes with different DS reveal the same phenomena with increasing SPES content. As shown in Fig. 8, the PVB/SPES-3 blend membranes have the highest water flux, and the PVB/SPES-1 blend membranes have the lowest water flux as a whole. When the blend ratios PVB to SPES changes from 10:0 to 7:3, the water flux increases slightly. Nevertheless, from 6:4 to 5:5, the water flux increases rapidly and with SPES content continues to increase, the water flux decreases once again. The reason for this phenomenon is that the microstructure of the PVB/SPES blend membranes changes with different blend ratios due to the partial compatibility of the PVB/SPES blending system. Additionally, there is an obvious peak for water flux when the blend ratio of PVB to SPES changes from 6:4 to 4:6, for the incompatiblity of the PVB/SPES blending system with blend ratios of 6:4, 5:5, and 4:6.
The effects of DS on the pure water flux of the PVB/SPES blend membranes.

The effects of DS on the rejection of the PVB/SPES blend membranes.

From Fig. 9, it can be found that the rejection is opposite to the water flux change trend as a whole. However, when the blend ratios PVB to SPES varies from 9:1 to 7:3, the rejection is higher than the pure PVB membranes. From 6:4 to 4:6, rejection decreases sharply, from 3:7 to 0:10, rejection increases slightly. The reason for these phenomena may be because that the surfaces and cross-sectional microstructures of the PVB/SPES membranes. In addition, partial compatibility of the PVB/SPES blending system also plays a role in the variation trend of the water flux and rejection.
E. The hydrophilicity of the PVB/SPES blend membranes
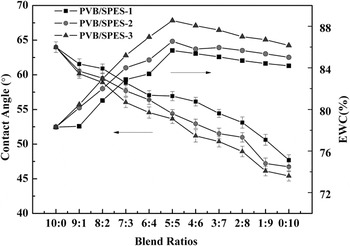
The effects of the DS on the contact angles and EWC of the PVB/SPES blend membrane surfaces are shown in Fig. 10. It can be clearly seen that the variation trend of the PVB/SPES blend membranes with different DS in the whole range is similar. In addition, the contact angles decrease and EWC increases with increasing DS, indicating an increase in hydrophilicity of the blend membrane surface. The pure PVB membrane has the biggest water contact angle of 63.99, meaning that it has the lowest hydrophilicity among the membranes. Increasing the content of SPES on the membrane surface results in a decrease in the water contact angle, meaning the hydrophilicity of the PVB/SPES blend membranes is enhanced gradually. In contrast, the EWC values increase in a whole. In detail, EWC values dramatically increase in the range of 10:0 to 5:5, then from 5:5 to 0:10, EWC values decrease slightly. This may be related to the morphologies of the PVB/SPES blend membranes. These phenomena mean that the hydrophilicity of the PVB/SPES blend membranes is improved to some extent with increasing SPES content in the PVB/SPES blend membrane surface. Meantime, PVB/SPES blend membranes show the higher hydrophilicity with increasing DS.
Measurement of contact angle and EWC of the PVB/SPES blend membranes.

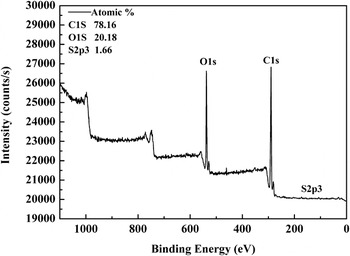
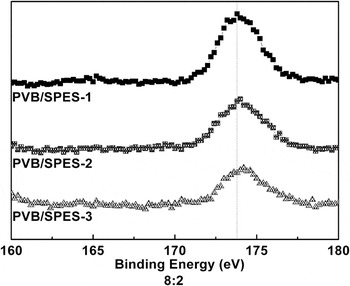
The surface compositions of the PVB/SPES-3 blend membranes are determined by XPS analysis. Figure 11 shows a representative XPS spectrum for the PVB/SPES-3 blend membrane, and the intense of XPS peaks for C, O, and S elements all appear in the spectrum as expected. The atomic percentages of C, O, and S elements are 78.16, 20.18, and 1.66%, respectively. The high-resolution spectra of S2p3 core level XPS spectra for the PVB/SPES blend membranes at blend ratio of 8:2 with different DS are shown in Fig. 12. The peak position of S2p3 in the XPS spectra shifts from 173.8 to 174.3 eV because of the increase of DS. The shift of S2p3 binding energy indicates that the chemical microenvironment of S atom on the membrane surface changes with increasing DS.
The XPS analysis result of the PVB/SPES-3 blend membranes at the blend ratio of PVB to SPES-3 8:2.

S2p3 scan of XPS spectra of the PVB/SPES blend membranes at the blend ratio of 8:2 with different DS.

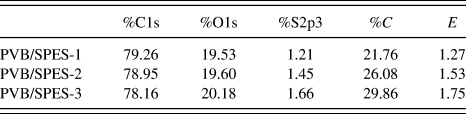
The atomic percentages of C, O, and S elements on blend membranes (blend ratio is 8:2, with different DS) surfaces are shown in Table I. The increase of DS enhances S at.% on the blend membrane surfaces. The percentage of S element on the PVB/SPES blend membrane surface can be used to represent the degree of SPES near surface coverage (C) for SPES is the only S source in the PVB/SPES blend membranes. C is calculated by the following Eq. (9) (Ref. Reference Mu, Su, Sun, Chen and Jiang38):
 $$C = {{{A_{{\rm{mS}}}}} \over {{A_{{\rm{SPES}}}}}} \times 100\% \quad ,$$
where A mS is the S at.% on the blend membrane surface measured by XPS, and A SPES is the S at.% of the SPES material.
A summary of atomic percentages on membrane surfaces, the degree of SPES surface coverage, and the degree of SPES surface enrichment of the PVB/SPES blend membranes with different DS.

From Table I, it can be seen that C values increase from 21.76 to 29.86% with increasing DS, which means the PVB/SPES blend membrane surfaces covered with SPES segments increased from 21.76 to 29.86%, while the SPES content in the blending system only 20%. This phenomenon illustrates that the increase of DS enhances the hydrophylicity of SPES. Furthermore, the hydrophylicity of the PVB/SPES blend membrane surfaces would be enhanced sufficiently, which is consistent with the measurement of water contact angle and EWC.
Table I can also state the degree of PES-g-PEGMA surface enrichment (E), which is calculated by the following Eq. (10): Reference Mu, Su, Sun, Chen and Jiang38,Reference Su, Li, Zhao, Shi, Wang, Jiang and Zhu39
 $$E = {{{A_{{\rm{mS}}}}} \over {{A_{{\rm{tS}}}}}}\quad ,$$
where A mS is the S at.% on the blend membrane surface measured by XPS, A tS is the theoretical value of the S at.% based on the total C, H, O, and S elements.
In Table I, E values of the PVB/SPES blend membranes increase from 1.27 to 1.75 with increasing DS of SPES, due to the membrane become more hydrophilic. Meanwhile, the E values for the PVB/SPES blend membranes are all greater than 1, which implies the substantial enhancement of SPES on the membrane surfaces.
These phenomena occur due to the hydrophilic segments of SPES spontaneously segregate on the membrane surface, which is driven by the difference in surface free energy of each component. Results also reveal that with an increasing DS, the content of SPES on the blend membrane surfaces increases, due to the stronger interaction between the hydrophilic groups of –SO3H and water molecules, which results in the higher hydrophilicity of the blend membrane. This result is consistent with the measurements as shown in Fig. 10.
F. Mechanical properties of the PVB/SPES blend membranes
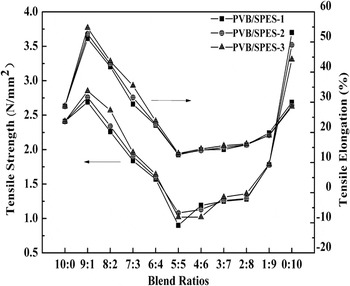
The effects of different composition and DS on the mechanical properties of the PVB/SPES blend membranes are shown in Fig. 13. The variation trend of the tensile strength and elongation of the PVB/SPES blend membranes with different DS in the whole range is similar. Meanwhile, the mechanical properties of blend membranes improve slightly, when the blend ratio varies from 9:1 to 7:3, due to the stronger interaction between PVB and SPES with increasing DS. From Fig. 13, it also can be seen, when the blend ratio is 9:1, the mechanical properties of the PVB/SPES blend membranes dramatically enhance and there is a peak for mechanical properties at this blend ratio, for the strongest interaction between PVB and SPES. Meanwhile, when the blend ratio varies from 9:1 to 7:3, the tensile elongation is all greater than the pure PVB membranes, indicating that blend membranes with these blend ratios have better flexibility than the pure PVB membranes. However, the mechanical properties then deteriorate from 8:2 to 5:5 and the tensile strength and elongation of PVB/SPES blend membranes increase again, when the blend ratio varies from 5:5 to 0:10. It also can be seen from Fig. 13, the PVB/SPES blend membranes explicit the worst mechanical properties, when the blend ratio is 5:5, for the weak interaction between PVB and SPES and the irregular structure.
The effects of DS on the mechanical properties of the PVB/SPES blend membranes.

This variation trend of mechanical properties is mainly related to the partial compatibility of the blending system, which can be directly reflected in the SEM surface and cross-sectional images of the PVB/SPES blend membranes with different composition.
G. Organic fouling evaluation of the PVB/SPES blend membranes
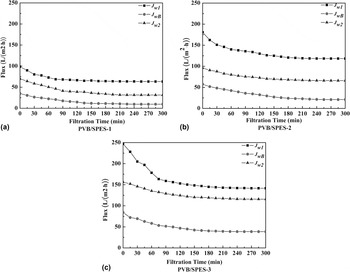
To investigate the filtration performance, the cross-flow filtration experiment was conducted. Figure 14 shows the pure water flux (before and after BSA filtration) and BSA flux behavior of PVB/SPES blend membranes (blend ratio is 8:2) with different DS. Generally, all the fluxes decline gradually and then become stable. Nevertheless, after backwashing, the pure water flux does not fully recover, due to irreversible fouling on the membrane surface. In addition, all blend membranes' fluxes of BSA solution are lower than pure water flux with increasing feed concentration, as a consequence of the concentration polarization effect. In other words, the adsorption and deposition of proteins on the membrane surface seems to be the dominant factor controlling the flux of the blend membranes. Reference Vatanpour, Madaeni, Rajabi, Zinadini and Derakhshan40 At the same time, with increasing DS, the PVB/SPES blend membrane with higher DS has a higher steady-state flux for overall long-term application. Furthermore, the flux increases sharply, due to pore formation and hydrophilicity enhancement.
Flux behavior of the PVB/SPES blend membranes with different DS of (a) 9%, (b) 15%, and (c) 27%.

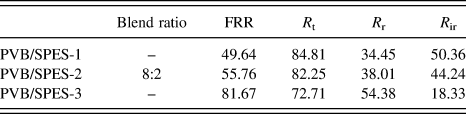
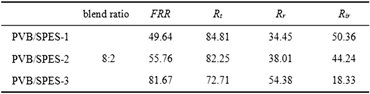
A summary of FRR, R r, R ir, and R t of the PVB/SPES blend membranes are shown in Table II. With the DS of SPES becomes higher, the FRR values increase rapidly from 49.64 to 81.67. In contrast, R t values decrease, but within the R t values, the R r values of the PVB/SPES blend membranes increase and R ir values decrease with increasing DS, which indicated lower total flux loss and less protein adsorption or deposition on the blend membrane surfaces.
Antibiofouling properties of the PVB/SPES blend membranes with different DS.

This result illustrates that the blend membranes with higher DS have better antifouling properties due to the increase of –SO3H groups in a skin membrane layer and the improvement of the blend membrane hydrophilicity. Namely, the introduction of SPES substantially reduces total membrane fouling especially irreversible membrane fouling, which can be attributed to that the highly hydrophilic –SO3H groups held high portion of free water on the membrane surfaces. Reference Ishihara41,Reference Lu, Murphy, Su, Lewis, Stratford and Satija42 In addition, the surface of PVB/SPES blend membranes carries a negative charge, due to the existence of –SO3H groups on the membrane surface. Meanwhile, BSA has a negative charge as well in the pH range of natural waters. The PVB/SPES blend membrane surfaces exhibit electrochemical repulsion against BSA and blend membranes with higher –SO3H groups in a skin membrane layer show stronger electrochemical repulsion. Reference Kochkodan and Hilal43,Reference Al-Amoudi and Lovitt44 As a result, the membrane fouling is reduced and the PVB/SPES blend membranes with higher DS values exhibit superior antifouling properties.
IV. CONCLUSIONS
All PVB/SPES blending systems (DS = 9, 15, and 27%, respectively) were partially compatible systems and FTIR-ATR results revealed that the interaction between PVB and SPES was much stronger at higher DS. The hydrophylicity of the PVB/SPES blend membranes was improved with increasing DS. The contact angle of the PVB/SPES blend membranes was decreased, the EWC and the enrichment of SPES segments on the membrane surface confirmed by XPS were increased with increasing DS to some extent. Meanwhile, PVB/SPES blend membranes with higher DS showed higher fluxes but exhibited lower rejection due to their membrane structures and morphologies. The comparison of mechanical properties of the PVB/SPES blend membranes with different DS stated that the higher DS lead to a better mechanical property. The organic fouling evaluation indicated that the PVB/SPES blend membranes at higher DS exhibited higher antifouling property at blend ratio of PVB to SPES was 8:2.