The Federal Emergency Management Agency (FEMA) recommends that every family be prepared to care for itself for 3 days, because it takes time, bureaucracy, and resources for emergency services to arrive at the site of a disaster. 1 However, the majority of Americans are not prepared to do this or are unaware that they should. 1 Children with special health care needs (CSHCN) are a population whose needs often require services and support beyond those of the general population, because they are children and persons with disabilities, a combination of 2 at-risk populations for greater adverse post-disaster side effects. Disaster planning until recently rarely took children and disability into account and was largely designed for the average able-bodied, adult American.
When a disaster or emergency occurs, CSHCN may have heightened vulnerability to injury, death, or post-disaster health complications, and in general, households that include persons with disabilities tend to be less prepared than households of the general population.Reference Baker and Baker 2 - Reference Osaki and Minowa 7 CSHCN may have specific needs for evacuation, transportation, communication, or medical care, which result in unique challenges for caretakers and emergency providers, particularly in rural communities. Stressed or underdeveloped rural public health systems often lack resources and medical expertise to adequately care for CSHCN.Reference Durch and Lohr 8
An additional layer of vulnerability, rurality, can influence a family’s disaster preparedness. Rural settings often have limited resources and personnel available during disasters for both CSHCN and the general population. In Iowa, 98.3% of the area is considered rural, and over one-third of the population live in a rural area. 9 If the rural health care infrastructure cannot sufficiently meet the needs of the general population during or after a disaster situation,Reference Putzer, Koro-Ljungberg and Duncan 10 then it is unlikely to meet the unique and complex needs of CSHCN. More recently, disaster management organizations have begun to consider the effects of various emergencies on CSHCN, who may have mobility, communication, emotional, medical, or power limitations or special needs.
Personal disaster preparedness, however, remains suboptimal in the United States.Twenty-nine percent of individuals say they are not prepared because emergency personnel will help them, with 61% expecting to rely on emergency responders in the first 72 hours following a disaster. 1 In general, CSHCN are not immune to this problem of lack of individual preparedness. 1 A recent study found that persons with disabilities do not have high supply (46.5%) or communication plan (41.0%) preparedness, which was not significantly different from the preparedness of nondisabled persons.Reference Eisenman, Zhou and Ong 11
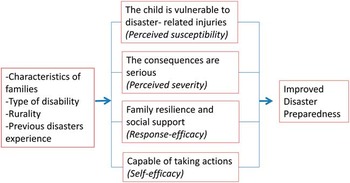
To date, we know little about the factors that influence preparedness in homes with CSHCN. Guided by the Extended Parallel Process Model (EPPM),Reference Maloney, Lapinski and Witte 12 which includes constructs related to perceived susceptibility, perceived severity, response-efficacy, and self-efficacy, this study investigated the disaster preparedness of families with CSHCN who live in rural Iowa. In the context of EPPM, families with CSHCN would be expected to engage in disaster preparedness strategies and behaviors if they believe that their child has heightened vulnerability to disaster-related injuries and death, if they believe that the consequences of disasters can be serious, if they have a high level of response efficacy (believe that the family resilience and social support they have could effectively mitigate their family’s risk), and if they have a high level of self-efficacy (believe that they are capable of taking action or implementing strategies to prevent or reduce disaster-related injuries and deaths). The conceptual model is presented in Figure 1. This study aimed to describe the level of disaster preparedness among rural families with CSHCN and, more specifically, to examine the effect of self-efficacy and response-efficacy on families’ engagement in preparedness.
Extended Parallel Process Model and Disaster Preparedness Among Families With Children With Special Health Care Needs.

METHODS
Data for this study were drawn from the baseline survey of a randomized controlled trial examining the impact of an intervention on disaster preparedness in families with CSHCN in rural Iowa. Baseline surveys were completed via computer-aided telephone interviews between July 2012 and April 2013 and data were analyzed in the fall of 2014. Participants were compensated with a $10 check for completing the survey.
Participants
Parents of CSHCN living in rural zip codes in Iowa were eligible for the study. To be in the study, the CSHCN must have had, at minimum, a mobility and/or sensory limitation that was confirmed by using functional status questions from the National Survey of Children with Special Health Care Needs. 13 Rurality was determined by the 4-category classification of Rural Urban Commuting Area (RUCA) codes, which are based on 2000 Census commuting data and 2004 zip codes, with zip codes categorized into urban, large rural, small rural, or isolated rural. 14 RUCA codes take into account population density and commuting patterns to and from work.
Eligible participants were then recruited from lists of patients, aged 17 years or younger, who had been seen either in the statewide Child Health Specialty Clinics, the Center for Developmental Disabilities, or the Continuity of Care Clinic within the University of Iowa Hospitals and Clinics in the previous 2 years. Participants were also recruited via e-mail distribution lists, fliers, and mailing lists of the Iowa members of the following groups: Champions for Autism and ADHD, Iowa Hands and Voices, and the Muscular Dystrophy Association.
Variables
Preparedness Strategies and Behaviors (Main Outcome)
Four new scores were created specifically for this study to measure preparedness: overall preparedness, supplies, discussion/practice, and emergency plan. A composite score for supplies preparedness was created by adding all yes answers to having the following: emergency kit, first aid kit, flashlights, extra batteries, smoke detector, carbon monoxide detector, fire extinguisher, radio (battery-powered or hand-cranked), 3-day supply of food and water for entire household in event of a disaster, special medical equipment or supplies for child with special needs, 3-day supply of medication for child with special needs, and an emergency plan (Cronbach’s α=0.73).
A composite score for discussion/practice preparedness was calculated by adding all yes answers (over the past year) for the following items: discussed disaster preparedness with household members, practiced disaster response plan, discussed disaster preparedness with neighbors, identified an alternate sheltering location for household, and discussed special disaster procedures with child’s service providers (Cronbach’s α=0.66).
For those who reported having an emergency plan, a composite plan score was calculated for the following plan components: easily accessed emergency contact reference card; special communications plan for child; medical response plan for child; household evacuation plan; document with medical, health, and insurance information; document summarizing child’s special needs; special plan for evacuating child; support network who can assist with child’s needs; and safe place to shelter during a tornado (Cronbach’s α=0.74).
An overall disaster preparedness score was also calculated by adding the supplies/equipment and discussion/practice scores as described above (Cronbach’s α=0.80). All of the preparedness scores were standardized to a 100-point scale.
Response Efficacy (Main Exposure)
Response efficacy was measured by the following 3 variables: family resilience attitudes, family resilience sources, and social support.
Family Resilience–Internal Sources. Internal sources of family resilience were measured by using a 9-item adapted version of the 30-item Family Crisis Oriented Personal Evaluation Scales (F-COPES).Reference Mccubbin, Olson and Larsen 15 F-COPES is designed to measure how families are prepared in terms of problem-solving attitudes and behaviors that would allow them to respond effectively when a problem arises. Reliability of the original 30-item scale was good (Cronbach’s α=0.77) and acceptable for the 9-item adapted version (Cronbach’s α=0.62). Attitudes related to how the family responds to a disaster were measured on a 4-point Likert scale for 9 items: knowing we have the power to solve major problems, seeking information and advice from other families who have faced the same or similar problems, facing problems head on and trying to get solution right away, accepting stressful events as a fact of life, knowing luck plays a big part in how well we are able to respond to a disaster, accepting that disasters can occur unexpectedly, feeling that no matter what we do to prepare we will have difficulty responding to a disaster, having faith in a higher being, and feeling we can effectively respond to a disaster by preparing ourselves and our households.
Family Resilience–External Sources. We also created a family resilience external sources scale, which was adapted and augmented for this study from the F-COPESReference Mccubbin, Olson and Larsen 15 external family coping patterns section. This was measured by asking participants to answer on a 4-point Likert scale (strongly disagree to strongly agree) the statement, “If faced with a disaster, we respond by seeking support or assistance from”: relatives, friends, neighbors, community agencies or programs, family doctor, law enforcement, emergency medical services, church, professional counselor, and other. This scale had good reliability (Cronbach’s α=0.79).
Social Support. Social support was measured by using an 8-item adapted version of the 24-item Social Provisions Scale.Reference Cutrona and Russell 16 The original scale had excellent reliability (Cronbach’s α=0.93). Our adapted 8-item version had good reliability (Cronbach’s α=0.79). The 8 items are drawn from 4 subscales of the Social Provisions Scale: guidance, opportunity for nurturance, social integration, and reliable alliance. Participants rated their agreement with 8 items on a 4-point Likert scale: there is no one I can turn to for guidance in times of stress; there are people who depend on me for help; I feel personally responsible for the well-being of another person; I feel part of a group of people who share my attitudes and beliefs; if something went wrong, no one would come to my assistance; there is no one who shares my interests and concerns; there is a trustworthy person I could turn to for advice if I were having problems; and there are people I can count on in an emergency.
Self-Efficacy (Main Exposure)
Self-efficacy was measured by asking participants to rate on a 4-point Likert scale how confident they were that adult members of their household would be able to do a list of disaster-related tasks without assistance from neighbors, friends, or the local community, including communicate disaster-specific instructions to child, assist child in personal care needs, and manage all the medical, transportation, and care needs of their child. A score was created by adding the items together and dividing by the number of items. This scale had good reliability (Cronbach’s α=0.83).
Disaster Expectations
Disaster expectations were measured by asking participants how likely they would be affected in the next 5 years, on a scale from 1 to 10, by flood, tornado, severe storms, severe heat wave, or fire. A score was created by adding together the scores for each question and dividing by the number of items. Reliability was good (Cronbach’s α=0.73).
Family and Child Characteristics
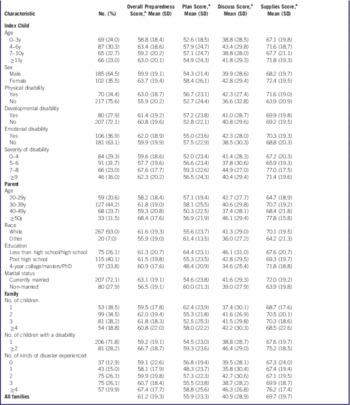
Child and parent demographic characteristics were collected (Table 1). Parents were also asked to report on the index child’s (child included in the study) disability type. Because children with physical or sensory abilities may also have other types of disabilities, CSHCN were grouped into 3 categories: developmental, physical, and emotional. Developmental disabilities included autism spectrum disorders, intellectual disability, or developmental delay. Physical disabilities included conditions affecting the following systems: respiratory, neurologic, genetic, endocrine, hematologic, cardiac, rheumatology, and gastroenterology (dietary restrictions). Emotional disabilities included attention deficit hyperactivity disorder, depression, anxiety, eating disorders, or other emotional problems.
Disaster Preparedness by Child, Parent, and Family Characteristics of Rural Families With Special Needs Children, Iowa, N=287

a All scores were standardized to a 100-point scale.
Number of Types of Disasters Experienced
Participants were asked to indicate whether they had ever experienced any of the following 9 types of disaster: flood, tornado, winter storm/snowstorm/ice storm, severe thunder/wind/hail storm, severe heat wave, fire in their home, earthquake, hurricane, or other disaster/emergency. Participants were given the following definition of disaster prior to answering this question: “man-made or natural event that distressed you, your family, or your community and required resources or assistance from outside sources.”
Statistical Analysis
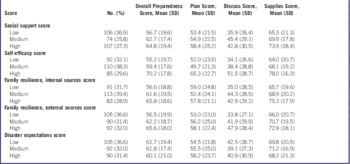
All disaster preparedness scores (overall, supply, discussion/practice, emergency plan) were standardized to a 0 to 100 scale. The EPPM construct scores (social support, self-efficacy, family resilience, and disaster expectations) were standardized to a 10-point scale. For Table 2, scores were categorized into low, medium, and high by tertile cutoffs.
Disaster Preparedness Scores by 5 Predicting Scores Based on the Extended Parallel Process Model, N=287

Distributions of child, parent, and family characteristics by preparedness were examined. Predictors of overall disaster preparedness, emergency plan, discussion/practice, and supplies were examined by using a theory-driven yet statistically sound modeling approach that retained all EPPM variables (hypothesized predictors) that significantly contributed together. Predictors considered included social support score, self-efficacy score, family resilience (attitudes), family resilience (sources), disaster expectations, child age, child gender, child physical disability, child developmental disability, child emotional disability, severity of child’s disability, parent age, parent race, parent education, parent marital status, number of children in family, number of children in family with special needs, and number of different kinds of disaster family has experienced.
To select possible important confounders, univariate analysis of the effect of each variable on the 4 outcomes was performed. For each outcome, variables that were statistically significant at the 0.05 level were chosen. Multicollinearity of variables was also assessed. None of the variables entered into the models were highly correlated; the highest correlation was 0.28 between the self-efficacy score and family resilience.
All 5 EPPM variables were included in the model together with the aforementioned selected demographic variables and then the least significant EPPM variable was excluded one by one until all remaining EPPM variables were statistically significant. Using this approach, 4 multivariate linear models were constructed to examine the 4 preparedness scores as outcomes.
Analyses for this study were conducted by using SAS software, version 9.3 (SAS Institute Inc, Cary, NC). This study was approved by the University of Iowa Institutional Review Board.
RESULTS
The majority of the special needs children included in this study were aged 6 or younger (54.3%) and male (64.5%; Table 1). The CSHCN in this study had a wide array of self-reported disabilities, although at a minimum all met the eligibility criteria of having some type of sensory and/or mobility limitation. Emotional disabilities were most prevalent (36.9%), but approximately one-quarter reported physical (24.4%) or developmental (27.9%) disabilities. These categories were not mutually exclusive. Eighty-one families (28.2%) in the study reported having more than one child with special health care needs.
Overall, preparedness across all categories was lacking, but the highest across all demographic categories was for disaster supplies, with 64% to 77% preparedness. Disaster preparedness discussion/practice had the lowest scores, ranging from 34% to 46% preparedness across characteristics. Emergency plan and overall preparedness scores averaged 55.9% and 61.2% across all families. As shown in Table 1, there was room for improvement in preparedness across all preparedness types and all demographic child, parent, and family characteristics.
Distributions of scores related to the EPPM constructs (social support, self-efficacy, family resilience—internal and external sources, and disaster expectations) were also examined by the 4 disaster preparedness scores (Table 2). Those who had high social support, self-efficacy, and family resilience sources (internal and external) also had the highest levels of overall preparedness and supplies preparedness. However, only 16% to 19% of the families in this study scored highly on those constructs. One-third (31.4%) of the families reported high expectations of a disaster happening in the next 5 years that would impact their family, but these families did not show increased preparedness with scores within the same range of families with low or medium disaster expectations.
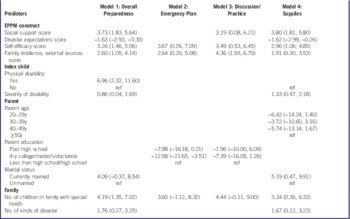
Results from all 4 linear regression models predicting level of disaster preparedness (overall, emergency plan, discussion/practice, and supplies) showed that with each unit increase in self-efficacy and family resilience sources, disaster preparedness increased (Table 3). Higher social support was associated with increased overall and disaster supplies preparedness. Disaster expectations was the only EPPM-related construct that did not predict increased preparedness. In fact, it was not significant in the plan and discussion score models. In the overall preparedness and supply models, higher disaster expectation was related to lower disaster preparedness, which was a relationship opposite of what was hypothesized.
Effects of Important Extended Parallel Process Model (EPPM) Variables on Disaster Preparedness

An examination of each of the EPPM constructs found that high social support and both internal and external sources of family resilience were associated with higher overall preparedness (Table 4). Internal sources of family resilience were not a significant predictor of the preparedness scores in adjusted models as shown in Table 3.
Effects of Individual Extended Parallel Process Model (EPPM) Variables on Disaster Preparednessa

a Each cell represents a separate model. All odds ratios were adjusted for demographic variables selected for the corresponding model.
DISCUSSION
This study examined the predictors of disaster preparedness in rural families in Iowa with children with special needs. According to the EPPM model,Reference Witte 17 a framework to help explain how people react to fear-inducing stimuli, several EPPM constructs were significant predictors of preparedness behaviors. Specifically, the more social support, self-efficacy, or external sources of resilience a family had, the higher their level of disaster preparedness. Hence, promising disaster preparedness programs should increase social support, improve self-efficacy in a variety of disaster response activities for their child (eg, communication, transportation, personal care), and enhance external sources of resilience (eg, connecting families to neighbors, friends, and community agencies).
Interestingly, internal sources of family resilience—which measures how much families use problem-solving skills and behaviors when faced with a disaster—did not impact preparedness behaviors. It is not clear why internal sources of resilience would not affect disaster preparedness behaviors, such as developing a household disaster plan or maintaining supplies. Perhaps, families with internal sources of resilience may be overconfident in their problem-solving abilities to face a disaster if it occurred and pre-event planning is perceived incorrectly as an unnecessary step. In contrast, families with high external sources of resilience, including friends, neighbors, and community agencies, demonstrated higher preparedness behaviors. Future studies are needed to understand the differential sources of resilience and their relationships with preparedness behaviors.
Children with disabilities require complex accommodations, and in this population of special needs children, households that included a child with a physical disability had higher levels of overall preparedness. Those with developmental and emotional disabilities and no physical disabilities, in contrast, were not well-prepared. This finding is supported by results from a study conducted in Los Angeles County that found mental health illness and poor health status were associated with lower levels of disaster preparedness, whereas disability status (disabled or not disabled) was not associated with disaster preparedness.Reference Eisenman, Zhou and Ong 11 Results from our study suggest that some preparedness needs are more easily accommodated or easier to plan for. For example, it is widely known that those with mobility issues may have difficulty evacuating buildings or towns without assistance.Reference Mcclure, Boninger and Oyster 18 Also, planning for their evacuation or transportation, while complex, is a clear and directed priority task. On the other hand, children with autism or cognitive delay may display less obvious disaster-related challenges, such as understanding instructions or communicating medical needs. Unless disaster-specific assessments are conducted to understand the variety of disaster-related needs, households of children with developmental or cognitive limitations may be less prepared.
In general, disaster plans for CSHCN are not well developed. After the Hurricane Katrina disaster, the National Commission on Children and Disasters was formed and 4 recommendations for state standards for disaster preparedness in K-12 schools and child care facilities were developed, of which one was specific to CSHCN: 1) evacuation/relocation plan, 2) family-child reunification plan, 3) children with special needs plan, and 4) K-12 multiple disaster plan. 19 As of 2013, Iowa was among 4 states that have not met any of these standards. Schools in Iowa are among the least prepared in the country to respond to and care for schoolchildren with special health care needs. 19 Also problematic, on a broader scale, is that there are no federal or state standards for household preparedness for CSHCN.
Limitations
The current study relied on self-report and perceptions of preparedness, which is a possible limitation given that actual preparedness and response in the event of a disaster could not be observed. Additionally, the generalizability of results beyond rural residents in Iowa is unknown. However, it is expected that other families with CSHCN in the United States face similar challenges in the event of a disaster. However, the results of this study may be most generalizable to other rural CSHCN families across the nation owing to the unique vulnerabilities encountered by rural residents, such as limited availability of resources and personnel. 9 , Reference Putzer, Koro-Ljungberg and Duncan 10
CONCLUSIONS
Results from this study suggest that social support, self-efficacy, and family resilience are factors that impact level of disaster preparedness and that should be considered in the design of preparedness intervention programs. Results also show that children with physical disabilities may be the most prepared because their needs may be more obvious to address than those without physical disabilities, therefore suggesting that those with nonphysical disabilities may need extra assistance in identifying their needs and finding solutions for accommodating those needs.
Acknowledgments
The authors thank all of the families who participated in this study as well as all of the agencies from which the participants were recruited: University of Iowa Hospitals and Clinics Child Health Specialty Clinics, Center for Developmental Disabilities, and Continuity of Care Clinic; Champions for Autism and ADHD; Iowa Hands and Voices; and the Muscular Dystrophy Association.
Funding
Funding for this research was provided by the US Department of Agriculture (grant no. 2011-67023-30606).