


1. Introduction
Secondary atomization is the process of breaking a liquid droplet into smaller units. Aerobreakup is one example of secondary atomization in which a liquid droplet is exposed to a high-speed stream of gas (generally air), causing its fragmentation. Aerobreakup applies in various natural and industrial processes. Mixing of air and fuel droplets inside an internal combustion engine, gelled propellants in a rocket engine (Padwal, Natan & Mishra Reference Padwal, Natan and Mishra2021), breakup of sneezed salivary droplets (Scharfman et al. Reference Scharfman, Techet, Bush and Bourouiba2016; Sharma et al. Reference Sharma, Pinto, Saha, Chaudhuri and Basu2021a), falling raindrops (Villermaux & Bossa Reference Villermaux and Bossa2009) and powder production by spray atomization of fruit pulps (Cervantes-Martínez et al. Reference Cervantes-Martínez, Medina-Torres, González-Laredo, Calderas, Sánchez-Olivares, Herrera-Valencia, Infante, Rocha-Guzman and Rodriguez-Ramirez2014) are few instances that involve aerobreakup of liquid droplets. Understanding the physics of aerobreakup is crucial in designing and controlling these processes. Significant research has already been done to study the aerobreakup of Newtonian droplets, which is well reviewed in the literature (Pilch & Erdman Reference Pilch and Erdman1987; Gelfand Reference Gelfand1996; Guildenbecher, López-Rivera & Sojka Reference Guildenbecher, López-Rivera and Sojka2009; Jackiw & Ashgriz Reference Jackiw and Ashgriz2021; Sharma et al. Reference Sharma, Singh, Rao, Kumar and Basu2021c, Reference Sharma, Chandra, Basu and Kumar2022). It is well established that the two most important dimensionless groups in the study of Newtonian droplet aerobreakup are Weber number ( $We$) and Ohnesorge number (
 $Oh$), defined as
 \begin{equation} We=\frac{\rho_g U_g^2 D_0}{\gamma};\quad Oh=\frac{\mu_l}{\sqrt{\rho_l \gamma D_0}}, \end{equation}
where  $\rho _g$ and
 $\rho _l$ are the gas- and liquid-phase densities,
 $U_g$ is the free-stream velocity of the gas,
 $\gamma$ is the surface tension at the liquid–gas interface,
 $D_0$ is the initial diameter of the droplet and
 $\mu _l$ is the dynamic viscosity of the liquid phase. Historically, based on morphology, droplet breakup has been categorized into five modes generally represented on a
 $We$–
 $Oh$ plane and occurs at increasing order of Weber number. These modes are: vibrational, bag, multimode (including bag and stamen), shear stripping or sheet thinning and catastrophic mode of breakup (Guildenbecher et al. Reference Guildenbecher, López-Rivera and Sojka2009; Jain et al. Reference Jain, Prakash, Tomar and Ravikrishna2015; Sharma et al. Reference Sharma, Chandra, Basu and Kumar2022). Breakup mode is among the several factors responsible for determining the final size distribution of atomized droplets (Chen et al. Reference Chen, Wagner, Farias, DeMauro and Guildenbecher2018; Sharma et al. Reference Sharma, Rao, Chandra, Kumar, Basu and Tropea2023). Aerobreakup of non-Newtonian droplets differs significantly from that of Newtonian droplets (Wilcox et al. Reference Wilcox, June, Brown and Kelley1961; Matta & Tytus Reference Matta and Tytus1982; Arcoumanis et al. Reference Arcoumanis, Khezzar, Whitelaw and Warren1994; Theofanous, Mitkin & Ng Reference Theofanous, Mitkin and Ng2013). Despite their occurrence in many practical processes, research in the aerobreakup of non-Newtonian droplets is still lacking. It has been pointed out that consensus on something as basic as the breakup modes and even the suitable dimensionless groups is not clear for non-Newtonian liquids (Guildenbecher et al. Reference Guildenbecher, López-Rivera and Sojka2009; Guildenbecher, López-Rivera & Sojka Reference Guildenbecher, López-Rivera and Sojka2011; Sharma et al. Reference Sharma, Chandra, Basu and Kumar2022). In several studies, polymeric solutions have been employed as the model fluid to investigate the aerobreakup of non-Newtonian liquids (Wilcox et al. Reference Wilcox, June, Brown and Kelley1961; Hoyt, Taylor & Altman Reference Hoyt, Taylor and Altman1980; Matta & Tytus Reference Matta and Tytus1982; Matta, Tytus & Harris Reference Matta, Tytus and Harris1983; Joseph, Beavers & Funada Reference Joseph, Beavers and Funada2002; Theofanous et al. Reference Theofanous, Mitkin and Ng2013). Long-chain polymer molecules impart elasticity when dissolved into viscous solvents, and the resulting solutions exhibit viscoelastic behaviour.
Early research in the area of polymeric droplet breakup was focused primarily on the resultant fragment size of liquid mass (Wilcox et al. Reference Wilcox, June, Brown and Kelley1961; Matta & Tytus Reference Matta and Tytus1982; Matta et al. Reference Matta, Tytus and Harris1983). These studies outlined the role of elasticity in the retardation of the breakup process in two aspects, larger fragment size and higher breakup time, when compared with the results of Newtonian (viscous) droplets under similar conditions. Later on, the focus of the research was shifted towards identifying the breakup modes and underlying mechanisms for aerobreakup of viscoelastic droplets (Arcoumanis et al. Reference Arcoumanis, Khezzar, Whitelaw and Warren1994; Joseph, Belanger & Beavers Reference Joseph, Belanger and Beavers1999; Joseph et al. Reference Joseph, Beavers and Funada2002; Ng & Theofanous Reference Ng and Theofanous2008; Theofanous Reference Theofanous2011; Theofanous et al. Reference Theofanous, Mitkin and Ng2013; Mitkin & Theofanous Reference Mitkin and Theofanous2017). Arcoumanis et al. (Reference Arcoumanis, Khezzar, Whitelaw and Warren1994) noted that aerobreakup always starts with the appearance of waves on the droplet surface. In the case of a polymeric droplet, these waves evolve into long ligaments and finally detach from the primary droplet but not in the form of daughter droplets like Newtonian fluids. At very high Weber numbers ( ${\sim }10^4$), droplets undergo a widespread catastrophic breakup marked at early times by the appearance of surface corrugations on the droplet frontal area. A match between experiments and theory for both Newtonian and viscoelastic liquids suggested that the surface corrugations are Rayleigh–Taylor (RT) waves (Joseph et al. Reference Joseph, Belanger and Beavers1999, Reference Joseph, Beavers and Funada2002). However, there is ambiguity concerning the existence of the RT waves and the catastrophic breakup mode itself at high Weber number (Theofanous & Li Reference Theofanous and Li2008; Theofanous Reference Theofanous2011; Theofanous et al. Reference Theofanous, Mitkin and Ng2013). Advancements in experimental facilities like high-speed cameras with better resolution, pulsed lasers with nanosecond accuracy and laser-induced fluorescence imaging techniques reignited research in the field of aerobreakup (Theofanous & Li Reference Theofanous and Li2008; Sharma et al. Reference Sharma, Singh, Rao, Kumar and Basu2021c). The possibility of unifying Newtonian and non-Newtonian breakup modes under a single roof has been explored (Theofanous Reference Theofanous2011). In this endeavour, RT and the Kelvin–Helmholtz (KH) instabilities were identified as the critical mechanism that governs the mode of aerobreakup. The respective modes due to these instabilities are RT piercing and shear-induced entrainment (SIE). A third mode, SIE with rupture, has been proposed only for viscoelastic liquids (Theofanous et al. Reference Theofanous, Mitkin and Ng2013). It is not always the case that only one of the two instabilities (RT and KH) will govern the breakup process; modulation of the two is also possible, as reported in the secondary atomization of coal water slurry and shear-thickening viscoelastic droplets (Zhao et al. Reference Zhao, Hou, Liu, Tian, Xu, Li, Liu, Wu, Zhang and Lin2014; Mitkin & Theofanous Reference Mitkin and Theofanous2017; Sharma et al. Reference Sharma, Singh, Rao, Kumar and Basu2021c).
Most of the existing literature agrees with the overall role of liquid elasticity as a retarding agent in the aerobreakup process. However, clear elucidation of the exact mechanism by which elasticity enters into play is missing. Some noteworthy efforts have been made by Joseph et al. (Reference Joseph, Beavers and Funada2002) and Theofanous et al. (Reference Theofanous, Mitkin and Ng2013), but not complete in all aspects. Theofanous et al. (Reference Theofanous, Mitkin and Ng2013) considered RT and KH instabilities as the main physics that decides the breakup mode, but the role of elasticity in modulating these governing instabilities needs investigation. Joseph et al. (Reference Joseph, Beavers and Funada2002) studied the role of elasticity only in RT instability observed at high Weber numbers, but the proposed theory is in disagreement with the widely reported experimental observation of elasticity as a retarding agent to aerobreakup.
Here we explore the role of elasticity and the mechanism by which it modulates the aerobreakup of viscoelastic droplets. Aqueous solutions of polyethylene oxide (PEO) have been employed as the model viscoelastic fluid. Variation in elastic properties is achieved by changing the polymer concentration and quantified in terms of the elasticity number,  $El$. This is the ratio of Deborah number
 $De$ and Reynolds number
 $Re_l$ in the liquid phase, such that
 \begin{equation} El= \frac{De}{Re_l} =\frac{\lambda\mu_0}{\rho_lD_0^2}, \end{equation}
where  $\lambda$ and
 $\mu _0$ are the relaxation time and the zero-shear viscosity of the polymeric solution. A wide range of
 $El$
 $({\sim }10^{-4}\unicode{x2013}10^2)$ and
 $We$
 $({\sim }10^2\unicode{x2013}10^4)$ is investigated while keeping the droplet diameter (
 ${\sim }1.8$ mm) fixed. Three distinct breakup modes, vibrational, SIE and catastrophic modes, are identified with increasing
 $We$ on a
 $We$–
 $El$ number plane. Based on the temporal evolution of liquid mass, we describe each breakup mode as a three-stage process. The dominant role of liquid elasticity is observed only in the final breakup stage, whereas it plays an insignificant role in the first two stages. The present study outlines the role of liquid elasticity in the underlying mechanism for each stage.
2. Materials and methods
The aerodynamic breakup of a polymeric droplet is achieved in the present work by interacting an acoustically levitating droplet with a uniform stream of induced airflow generated behind a normal shock wave. The studied mechanism involves two stages (Sharma et al. Reference Sharma, Singh, Rao, Kumar and Basu2021c). The first stage corresponds to the interaction of the shock wave with the droplet where different shock structures (such as reflected wave, transmitted wave, Mach stem, slip surface etc.) are formed. However, in our earlier work (Sharma et al. Reference Sharma, Singh, Rao, Kumar and Basu2021c), it has been shown that this stage has negligible influence on droplet deformation and breakup dynamics. Therefore shock wave dynamics is not discussed in this work. The second stage involves shock-induced airflow interaction with the droplet, which influences the droplet's deformation and breakup. The present work is focused only on the second stage.
2.1. Experimental set-up
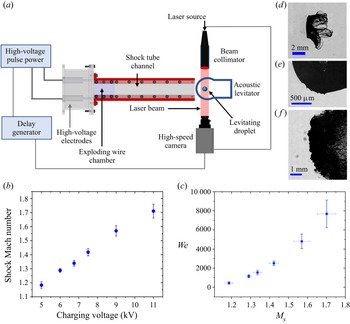
An exploding-wire-based shock tube set-up creates a shock-induced airflow that interacts with a levitating droplet as shown in figure 1(a). The operation of the shock tube is based on the passage of a high-current (of the order of kiloamperes) and high-voltage (of the order of kilovolts) electrical pulse through a thin metallic wire (35 SWG, bare copper wire) mounted on two high-voltage electrodes. The deposition of high electrical power in a short time duration (order of microseconds) results in the rapid Joule heating of the wire, its instant melting and vaporization into a column of dense vapours (Sembian et al. Reference Sembian, Liverts, Tillmark and Apazidis2016b; Sharma et al. Reference Sharma, Singh, Rao, Kumar and Basu2021c). The expansion of this vapour column results in the formation of a cylindrical shock wave. This cylindrical shock wave gets transformed into a normal shock by the rectangular confinement of the shock tube flow channel ( $320\,{\rm mm} \times 50\,{\rm mm}\times 20\,{\rm mm}$). A 2 kJ pulse power system (Zeonics Systech, India Z/46/12) that discharges a 5
 $\mathrm {\mu }$F capacitor is used to provide a high-voltage pulse across the exploding wire. The charging voltage for the capacitor is varied from 5 to 11 kV, causing the generation of shock waves with different strengths. The shock Mach number
 $(M_s=U_s/v)$ of produced shock waves ranges from
 $\sim$1.13 to 1.76 which results in a wide range of Weber number variation (
 ${\sim }10^2\unicode{x2013}10^4$) as presented in figures 1(b) and 1(c). Here,
 $U_s$ is the shock speed at instant of interaction with the droplet and is measured using the distance moved by the shock wave in two consecutive camera frames and
 $v$ is the speed of sound in the medium ahead of the shock wave, i.e. air at 1 atm and 298 K in the present case. A detailed overview of the exploding wire technique and its application in shock-wave generation can be found elsewhere (Fedotov-Gefen et al. Reference Fedotov-Gefen, Efimov, Gilburd, Gleizer, Bazalitsky, Gurovich and Krasik2010; Liverts et al. Reference Liverts, Ram, Sadot, Apazidis and Ben-Dor2015; Sembian et al. Reference Sembian, Liverts, Tillmark and Apazidis2016b; Sharma et al. Reference Sharma, Singh, Rao, Kumar and Basu2021c). In comparison with diaphragm-based conventional shock tubes, the present technique provides several advantages such as a small-size test facility, ease of operation, extensive range of shock Mach numbers (
 $M_s = 1$ to 6; Sembian et al. Reference Sembian, Liverts, Tillmark and Apazidis2016b) and high repeatability between the tests. However, it is important to note that the conventional shock tube set-ups provide uniform flow conditions for sufficiently long duration (
 ${\sim }10^0\unicode{x2013}10^2$ ms) as compared with the droplet breakup time scales (
 ${\sim }10^1\unicode{x2013}10^3$
 $\mathrm {\mu }$s). Whereas, due to the inherent characteristics of blast-wave-based shock tube set-ups, fluid properties like gas velocity, density and pressure decay rapidly with time. Therefore, a direct one-to-one comparison of droplet aerobreakup achieved by these two different shock-generation techniques should not be made. The usage of blast wave provides a parallel approach for investigating shock interactions, as done in several existing studies (Ram & Sadot Reference Ram and Sadot2012; Igra et al. Reference Igra, Falcovitz, Houas and Jourdan2013; Sembian, Liverts & Apazidis Reference Sembian, Liverts and Apazidis2016a; Pontalier et al. Reference Pontalier, Loiseau, Goroshin and Frost2018; Supponen et al. Reference Supponen, Akimura, Minami, Nakajima, Uehara, Ohtani, Kaneko, Farhat and Sato2018). However, its utilization for studying droplet aerobreakup is fairly a new approach (Sharma et al. Reference Sharma, Singh, Rao, Kumar and Basu2021c). Therefore, it is important to discuss the transient aspects of shock and shock-induced flow properties associated with the present set-up. Some features of the present experimental set-up have already been discussed in our previous work performed using the same set-up (Sharma et al. Reference Sharma, Singh, Rao, Kumar and Basu2021c). More insight into the transient fluid properties of the present set-up is provided in Appendix A.
(a) Schematic of the experimental set-up. (b) Shock Mach number  $M_s$ versus capacitor charging voltage of pulse power system. (c) Range of Weber number
 $We$ versus shock Mach number
 $M_s$ for the studied condition. (d–f) Sample images showing the three different zoom settings used in the present study. (d) Zoomed-out imaging for global observation. (e) Imaging with very high magnification on quarter portion of a droplet to capture the KH waves. ( f) Medium zoom to capture the RT waves on the flattened frontal area of the droplet.

A BIGlev acoustic levitator (Marzo, Barnes & Drinkwater Reference Marzo, Barnes and Drinkwater2017) is used in the present work to levitate the polymer–water droplets of size  $D_o \sim 1.8$ mm. The levitator comprises ultrasonic transducers of size 16 mm and operates at a frequency of 40 kHz. An array of 36 transducers is mounted on each of two curved plates separated by a designed distance for creating standing acoustic waves. The standing wave will have stable nodes at which a liquid droplet can be firmly trapped. The sound pressure level acting on the droplet is varied by changing the supplied DC voltage. High sound pressure level is used during droplet deployment, which is then reduced until the droplet takes on a spherical shape. Although care has been taken to maintain the spherical shape of a levitated droplet, some flattening of the droplet occurs due to the acoustic pressure acting on the droplet surface. The maximum aspect ratio (
 $AR = D_{max}/D_{min}$) of the levitated droplet prior to shock interaction is found to be 1.2. Here,
 $D_{max}$ and
 $D_{min}$ are the maximum and minimum diameters of a fitted ellipse on the droplet periphery and are obtained using the ‘Analyse particle’ plugin in ImageJ software. The equivalent droplet diameter is therefore obtained as
 $D_o = \sqrt [3]{{D_{max}}^2\times D_{min}}$.
The connection diagram of different types of equipment used for the operation of the shock tube set-up is shown in figure 1(a). A test fluid droplet is first trapped in the stable node of the acoustic levitator. Two high-voltage electrodes are connected with the pulse power system using high-tension wires. For achieving a wire explosion, a 5  $\mathrm {\mu }$F capacitor in the pulse power system is charged to a desired energy level depending on the required shock strength. Once the charging of the capacitor is complete, the charging circuit is cut off, and the capacitor's discharging circuit is closed by providing a trigger signal from a digital delay generator (BNC 575) unit. This results in the generation of a shock wave that travels along the shock tube's length and interacts with the levitating droplet. The droplet is centrally positioned to the shock tube cross-section at a distance of 15 mm from the exit. A simultaneous trigger signal is also provided to the imaging set-up for the synchronized recording of the interaction phenomenon.
2.2. Imaging set-up
The droplet aerobreakup process involves a multitude of length and time scales. A high-speed camera (Photron SA5) synchronized with an ultrahigh-speed pulsed nanosecond laser (Cavitar Cavilux smart UHS) allowed us to freeze the interaction phenomenon on the 10–40 ns time scale. The motion freezing avoids the streaking of high-speed droplet fragments, which otherwise might lead to observational errors. The breakup process is captured using the shadowgraphy imaging technique (see figure 1a). The diverging light from a high-speed laser is fed to a beam collimator (Thorlabs, BE20M-A), transforming it into a parallel light beam, resulting in the uniform illumination of the camera field of view. An acoustically trapped droplet is kept in the path of the parallel light beam, which results in the projection of droplet shadow on the camera sensor. Side-view images are obtained at different zoom settings to capture the different aspects of droplet breakup, as shown in figure 1(d–f).
Zoomed-out imaging is performed to make a global observation of the evolution of droplet morphology by keeping the droplet in the frame for a longer duration, as shown in figure 1(d). A macro lens (Sigma DG 105 mm) coupled with a high-speed camera is used for zoomed-out imaging. The interaction dynamics is captured at 40 000 frames per second (fps) with a frame size of  $640 \times 264$ pixels. A pixel resolution of 45.5
 $\mathrm {\mu }$m px
 $^{-1}$ is obtained, which results in a field of view of
 $29.1\,{\rm mm} \times 12\,{\rm mm}$.
Zoomed-in imaging is done on the quarter portion of a droplet at a very high spatial resolution to capture the evolution of KH waves appearing on the droplet surface (see figure 1e). The micrometre-size surface corrugations appear within a few microseconds of shock wave interaction, which necessitates the usage of an imaging system with high spatio-temporal resolution. A Navitar 6.5 $\times$ zoom lens with a 1.5
 $\times$ objective and 1
 $\times$ adapter tube is coupled with the high-speed camera, which captures the growth of KH waves at an imaging rate of 75 000 fps. A frame size of
 $320 \times 264$ pixels is used with a spatial resolution of 4.5
 $\mathrm {\mu }$m px
 $^{-1}$, which results in a field of view of
 $1.4\,{\rm mm} \times 1.2\,{\rm mm}$.
Medium-zoom imaging is performed to capture the RT waves, which appear as surface corrugations only after the windward side of the droplet has been sufficiently flattened by the aerodynamic forces, as shown in figure 1( f). A Navitar 6.5 $\times$ zoom lens with a 1
 $\times$ adapter tube is used for capturing medium-zoom images at 25 000 fps. A pixel resolution of 15.9
 $\mathrm {\mu }$m px
 $^{-1}$ and frame size of
 $640 \times 448$ pixels are used, resulting in a field of view of
 $10.2\,{\rm mm}\times 7.1\,{\rm mm}$.
The airflow direction is from left to right in all the experimental images presented in this article. The usage of high-quality and precise experimental arrangements and the wide range of non-dimensional numbers covered in the present work provide an excellent benchmark for future numerical and experimental studies.
2.3. Sample preparation and characterization
A known quantity of PEO with viscosity-averaged molecular weight of  $5\times 10^6$ g mol
 $^{-1}$ purchased from Sigma-Aldrich is dissolved into deionized (DI) water to prepare the polymeric solution of desired concentration,
 $c$. The solutions are prepared by using a magnetic stirrer set to rotate at 300 RPM. The water–polymer mixture is stirred until an optically transparent solution is obtained. The duration of stirring depends upon the concentration of the solution, and the maximum duration is
 $\sim$72 hours for the maximum concentration (1 % w/w) considered in the present study. The value of critical overlap concentration
 $c^*\approx 0.06\,\%$ (w/w) and relaxation times are estimated from the correlations available in the literature (Varma, Saha & Kumar Reference Varma, Saha and Kumar2021). A wide range of
 $c/c^*$ variation (
 ${\sim }10^{-2}\unicode{x2013}10^1$) is considered to cover from the dilute to the concentrated entangled regime of polymeric solution. This resulted in several orders of magnitude variation in
 $El$ (
 ${\sim }10^{-4}\unicode{x2013}10^2$). It should be noted that, since there is no variation in droplet size,
 $c/c^*$ and
 $El$ both represent the degree of elasticity, and they have been used interchangeably throughout this article. Values of
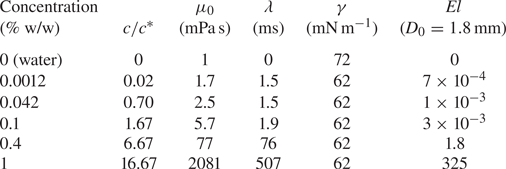
 $El$ for a liquid droplet with an initial diameter of 1.8 mm and different
 $c/c^*$ are provided in table 1. These values may vary slightly depending on the exact droplet diameter in each experimental run.
Properties of the test liquids.

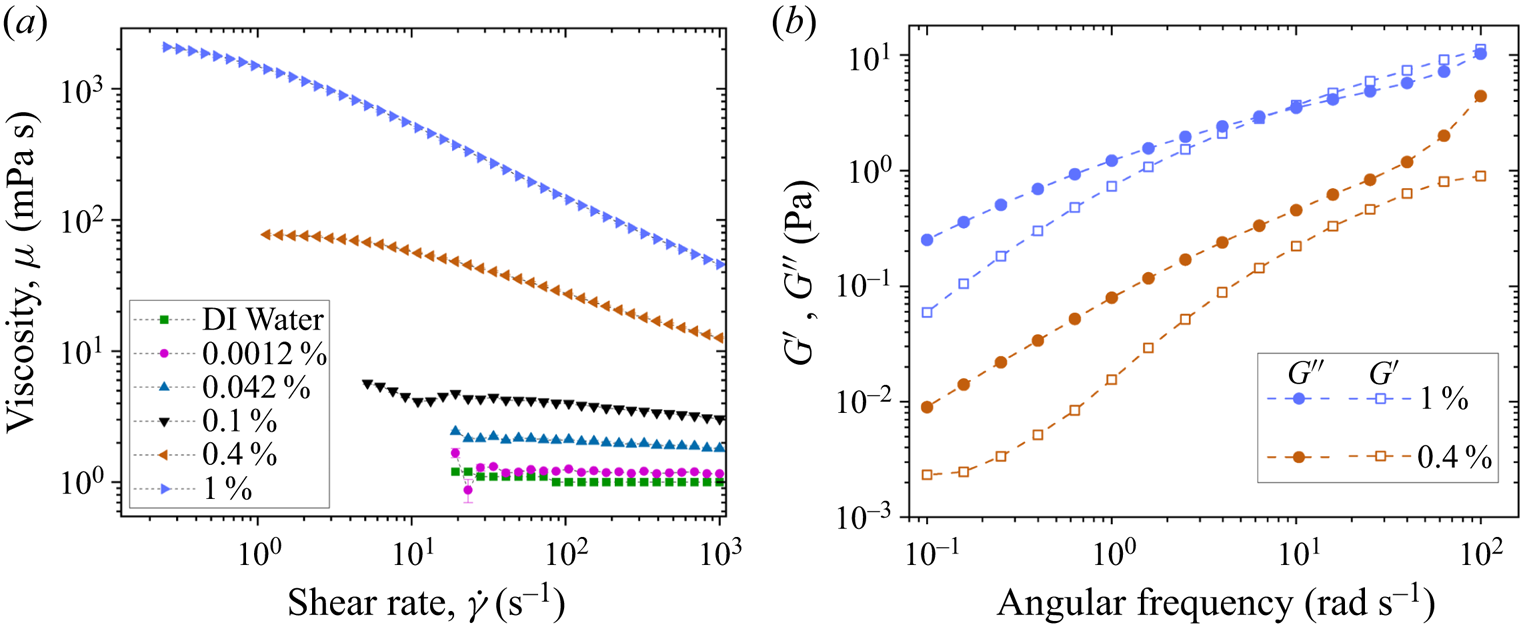
The surface tensions of DI water and polymeric solutions are measured using an optical contact angle measuring and contour analysis system (OCA25) instrument from DataphysicsVR by the pendant drop method. Rheological measurements are performed using cone-and-plate geometry (plate diameter: 40 mm; cone angle: 1  $\deg$) of a commercial rheometer (Anton Paar, model MCR302). A concentric cylinder geometry (cylinder diameter: 39 mm) having higher sensitivity compared with cone-and-plate geometry is used for the rheological characterization of water and dilute solutions. The flow curves for different solutions are shown in figure 2(a), and figure 2(b) shows the storage modulus
 $(G')$ and the loss modulus
 $(G'')$ obtained from frequency sweep of small-amplitude oscillatory shear (SAOS) tests at a strain amplitude of 10 %. Solutions with concentrations of 1 % and 0.4 % (w/w) fall in the entangled regime of the polymeric solution (Varma, Rajput & Kumar Reference Varma, Rajput and Kumar2022) and show significantly high zero-shear viscosity compared with the remaining solutions. These higher-concentration solutions also exhibit a significant amount of elasticity which can be inferred from their comparable magnitude of
 $G'$ and
 $G''$. The determination of
 $G'$ and
 $G''$ from SAOS for lower concentrations is beyond the resolution of the present rheometer; therefore, the data are shown only for higher concentrations in figure 2(b). It is interesting that, although the polymeric solutions with low concentrations (0.0012 % and 0.042 % w/w) exhibit properties similar to that of DI water in shear rheology, yet they show significant differences in aerobreakup (as we present in the later sections). A summary of different fluid properties is presented in table 1.
Rheological properties of PEO–water solution at different concentrations. (a) Viscosity variation with shear rate for different concentrations of PEO–water solution. (b) Variation of storage modulus  $(G')$ and loss modulus
 $(G'')$ with angular frequency in SAOS test for two different concentrations of PEO–water solution.

3. Results and discussion
3.1. Modes of droplet aerobreakup
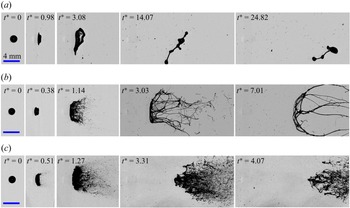
Figure 3 shows global observation of the temporal evolution of liquid droplet with  $c/c^*=0.70$ subjected to
 $M_s$ of 1.18, 1.34 and 1.71 with respective
 $We$ of 320, 949 and 7642. Here,
 $t^*=t/t_I$ is the non-dimensionalized time such that
 $t_I=({D_0}/{U_g})\sqrt {{\rho _l}/{\rho _g}}$ is the inertial time scale generally used in describing the results of liquid droplet aerobreakup (Nicholls & Ranger Reference Nicholls and Ranger1969; Theofanous et al. Reference Theofanous, Mitkin and Ng2013). Time
 $t$ is counted from the moment of droplet–shock wave interaction. The three cases shown in figure 3 illustrate the three different breakup modes observed in the present study (supplementary movies 1, 2 and 3 available at https://doi.org/10.1017/jfm.2023.377). At low
 $We$ (<700), the droplet suffers large deformation to form a flattened sheet (
 $t^*=3.08$ in figure 3a). Finally, the surface tension and the elastic forces (if present) overwhelm the aerodynamic forces leading to rebound and oscillation of the liquid mass. This is identified as the vibrational mode of breakup (figure 3a). In this regime, the liquid mass generally remains as a single integral structure, and even if it breaks up, only a few daughter droplets are formed. Liquid rebound is the main characteristic of the vibrational mode. At moderate
 $We$ (
 $700< We<2800$), in addition to droplet deformation, KH waves also appear on the droplet surface between the front stagnation point and the droplet equator. These waves grow with time and travel towards the equator region, finally leading to the ejection and liquid mass entrainment in the airflow near the equator region (
 $t^*=1.14$ in figure 3b). This is identified as the SIE mode of breakup. In this regime, the liquid mass drawn in the airflow goes beyond the rebound limit of restoring forces, and this feature separates it from the vibrational mode observed at low
 $We$. At high
 $We$ (>2800), in addition to droplet deformation and KH waves, RT waves also contribute to the breakup process. The RT waves appear as surface corrugations on the flattened frontal region of the droplet (
 $t^*=1.27$ in figure 3c), leading to a widespread erratic breakup of liquid mass which is identified as the catastrophic breakup mode (figure 3c).
Global observation of temporal evolution of polymeric droplet with  $c/c^*=0.70$ subjected to
 $M_s$ of (a) 1.18, (b) 1.34 and (c) 1.71. Respective Weber numbers are 320, 949 and 7642. The three examples shown here represent the three modes of droplet breakup: (a) vibrational, (b) SIE and (c) catastrophic modes.

It is observed that the range of  $We$ corresponding to different breakup modes discussed above is independent of the polymer concentration, and even the water droplets follow the same trend. But this
 $We$ range is different from the range of
 $We$ for the aerobreakup of Newtonian droplets reported in conventional shock tube flow or continuous air jet flow-based studies. Further, two approaches are employed in existing literature for classifying the breakup modes. First is the classical approach in which five different breakup modes (vibrational, bag, multi-bag, shear-stripping, catastrophic) are identified based on the morphology of the atomizing liquid mass (Guildenbecher et al. Reference Guildenbecher, López-Rivera and Sojka2009; Jain et al. Reference Jain, Prakash, Tomar and Ravikrishna2015; Sharma et al. Reference Sharma, Chandra, Basu and Kumar2022). Second is the modern approach where breakup modes (RT piercing and SIE) are classified based on the underlying hydrodynamic instabilities (Theofanous & Li Reference Theofanous and Li2008; Theofanous Reference Theofanous2011; Sharma et al. Reference Sharma, Singh, Rao, Kumar and Basu2021c). We adopted the modern way of classification, but the present range of
 $We$ corresponding to a particular breakup mode differs from that of the existing studies. For instance, the maximum
 $We$ for the vibrational breakup mode is
 $\sim$700 in the present work, whereas it is reported as
 $\sim$11 in the existing literature (Guildenbecher et al. Reference Guildenbecher, López-Rivera and Sojka2009). This difference arises because
 $We$ reported in the present work is based on the gas flow properties (
 $\rho _g$,
 $U_g$) at the instant of droplet–shock wave interaction, which decays rapidly with time in the present experimental set-up (exploding-wire-based shock tube). This is in contrast to most of the existing studies where a conventional shock tube or continuous air jet set-up has been employed, resulting in constant gas flow properties during droplet breakup. Further details of the transient characteristics associated with our experimental set-up can be found in Appendix A. The present shock tube provides a new approach for investigating droplet aerobreakup and its usage is justified because it has several advantages, like ease of operation, the small size of the test facility, precise control and high repeatability compared with the conventional shock tube set-up. In fact, the blast wave obtained in an exploding-wire-based shock tube set-up is more relevant to many practical scenarios compared with the ideal conditions obtained in the conventional shock tube set-up (Igra et al. Reference Igra, Falcovitz, Houas and Jourdan2013; Pontalier et al. Reference Pontalier, Loiseau, Goroshin and Frost2018). Further, the primary objective of the present work is to study the role of liquid elasticity in the aerobreakup of polymeric droplets. This remains unaltered by choice of the present experimental set-up because conclusions are drawn by testing all the liquid samples in the same experimental conditions.
3.2. Stages of droplet aerobreakup
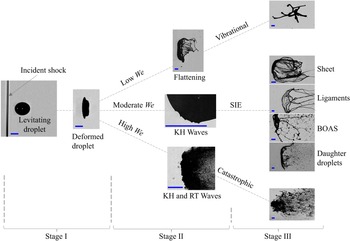
On the basis of the temporal evolution of the liquid mass, we describe each mode of droplet aerobreakup as a three-stage process (supplementary movie 4). Figure 4 illustrates the three stages with representative experimental images showing the state of liquid mass in each stage. Stage I is the droplet deformation that occurs immediately after the passage of the shock wave at the droplet location. In this stage the cross-stream diameter of the droplet increases, and the shape of the droplet changes from spherical to a cupcake geometry. Stage II marks the appearance and the growth of different hydrodynamic instabilities. State of the liquid mass obtained in stage II acts as a precursor for stage III, where breakup modes are decided, and morphological evolution of liquid mass is observed. In stage II and stage III, three different regimes are observed based on  $We$. At low
 $We$ (<700), a deformed droplet undergoes further deformation to form a flattened sheet. Sometimes small ligaments are also observed emanating from the periphery of the flattened sheet. Finally, the liquid mass is pulled back, leading to the vibrational mode of breakup. At moderate
 $We$ (
 $700< We<2800$), the droplet undergoes KH wave-assisted SIE mode. At high
 $We$ (>2800), RT wave-assisted catastrophic mode of breakup is observed. A clear-cut demarcation between the three stages is not always possible, and the overlap of two consecutive stages also happens. At high
 $We$, due to a higher growth rate and quick appearance of hydrodynamic instabilities, it appears that stage I and stage II proceed simultaneously. Capturing them separately is beyond the scope of the present temporal resolution. It is important to provide a stage-wise description of the aerobreakup process because the effect of liquid elasticity is insignificant in the first two stages. The dominant role of elasticity appears only in stage III in terms of the morphology of the liquid mass. In this stage, depending upon liquid elasticity, different liquid morphologies like sheet, ligaments and beads-on-a-string (BOAS) can be observed. Detailed discussion of each stage is provided in the following subsections.
The three stages in droplet aerobreakup based on the temporal evolution of the liquid mass. Scale bar in each image represents 1 mm.

3.3. Stage I: droplet deformation
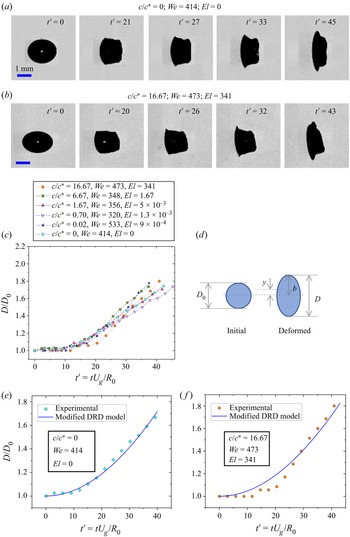
At early times of droplet–airflow interaction, the air stream almost achieves stagnation pressure at the windward and the leeward side of the droplet. Under the action of this pressure, the droplet deforms to change its shape from a sphere to a cupcake geometry, often approximated to an oblate spheroid for modelling purposes (Sor & García-Magariño Reference Sor and García-Magariño2015; Sharma, Singh & Basu Reference Sharma, Singh and Basu2021b). Deformation is quantified in terms of aspect ratio  $D/D_0$, where
 $D$ is the maximum cross-stream diameter of the deformed droplet. Figures 5(a) and 5(b) show the temporal evolution of the aspect ratio for water and polymeric droplet with
 $c/c^*=16.67$ at comparable
 $We$. Deformation data for all concentrations are collated in 5(c). Here,
 $t' =tU_g/R_o$ is the non-dimensional time and
 $R_0$ is the initial radius of the droplet. Time
 $t$ is counted from the instant of droplet–shock wave interaction and until
 $D/D_0 \sim 1.7$. It is clear from figure 5(a–c) that variation of polymer concentration and hence
 $El$ have no significant effect on the deformation dynamics of the polymeric droplets.
Effect of liquid elasticity on droplet deformation dynamics. (a,b) Experimental images showing aspect ratio evolution for water and polymeric droplet with  $c/c^*=16.67$. (c) Temporal variation of droplet deformation for water and polymeric droplets with different
 $c/c^*$ at comparable
 $We$. (d) Schematic of a spherical droplet deforming into the shape of an oblate spheroid. Comparison of experimental deformation with the modified DRD model for
 $c/c^*$ values of (e) 0 and ( f) 16.67.

A deforming droplet is assumed to undergo purely extensional flow, changing its shape from spherical to an oblate spheroid with semi-major axis length  $b$ as shown in the schematic diagram figure 5(d). Parameter
 $y$ is the distance between the half-droplet centre of mass and the centre of the spheroid such that
 $b=\frac {8}{3}y$. To predict the deformation, force balance is performed in terms of motion of the half-droplet centre of mass. Sor & García-Magariño (Reference Sor and García-Magariño2015) proposed a droplet ratio deformation (DRD) model to predict the deformation of Newtonian droplets. Here we present a modified DRD model for polymeric droplets by adding the viscoelastic force term. The final force balance is given by
 \begin{equation} m a_c=F_v+F_s+F_p+F_{ve} .\end{equation}
Here,  $m$ is the mass of the half-droplet and
 $a_c$ is the deformational acceleration, i.e. acceleration in the cross-stream direction, of the half-droplet centre of mass. Terms on the right-hand side of (3.1) represent the forces on the half-droplet due to viscous
 $(F_v)$, surface tension
 $(F_s)$, pressure
 $(F_p)$ and viscoelastic
 $(F_{ve})$ effects. It should be noted that
 $F_v$ is the viscous force only due to contribution from solvent (water in the present case), whereas
 $F_{ve}$ is the viscoelastic force due to polymer contribution. Except for
 $F_{ve}$, all the other terms in (3.1) can be evaluated in the same manner as done in the literature (Sor & García-Magariño Reference Sor and García-Magariño2015). To estimate
 $F_{ve}$, we have used the upper convected Maxwell model for viscoelastic fluid subjected to a two-dimensional incompressible and purely elongational flow. The expression for
 $F_{ve}$ is provided in Appendix B. After substituting the expression for all the terms in (3.1) and performing suitable non-dimensionalization, the equation which governs the deformation is given by
 \begin{equation} \frac{{\rm d}^2y'}{{\rm d} t'^2} ={-}\frac{8N}{KRe} \left(\frac{1}{y'^2}\frac{{{\rm d}y}'}{{\rm d} t'}\right) - \frac{4}{KWe} \left(\frac{{\rm d} A_s'}{{\rm d} b'}\right) + \frac{3C_p}{4K} - \frac{2M}{KReDe} \left(\frac{\xi}{y'}\right).\end{equation}
Here, quantities with primes represent non-dimensional terms. Parameters  $R_0$ and
 ${R_0}/{U_g}$ have been used as the length scale and time scale for non-dimensionalization,
 $C_p$ is the coefficient of pressure and
 $A_s'={A_s}/{{\rm \pi} R_0^2}$ such that
 $A_s$ is the surface area of a half-spheroid. Non-dimensional terms appearing in (3.2) are density ratio (
 $K$), viscosity ratio (
 $N$ and
 $M$), Reynolds number (
 $Re$) and Deborah number (
 $De$) defined as
 \begin{equation} K=\frac{\rho_l}{\rho_g};\quad N=\frac{\mu_s}{\mu_g};\quad M=\frac{\mu_p}{\mu_g};\quad Re=\frac{\rho_g U_g D_0}{\mu_g};\quad De=\frac{\lambda U_g}{R_0}. \end{equation}
Here,  $\mu _p$ is the polymer contribution to the zero-shear viscosity of the polymeric solution and
 $\mu _g$ and
 $\mu _s$ are the dynamic viscosities of the gas phase and the solvent (water in the present case). Since deformation occurs at early times of droplet–shock wave interaction, a constant value of gas-phase velocity obtained at the initial time instant can be used in (3.2) to get an estimation of deformation. Comparison of deformation predicted from (3.2) with experimental data is shown in figures 5(e) and 5( f) for two extreme values of
 $c/c^*$ studied in the present work. Here,
 $C_p$ is used as a fitting parameter, and from the different experimental data on deformation rate, its suitable value is obtained between 0.3 and 0.4. For the present range of parameters, it can be checked from (3.2) that contributions of viscous, viscoelastic and surface tension forces are at least an order of magnitude less than that of the pressure term. This suggests that droplet deformation is mainly governed by the balance between aerodynamic pressure and the inertia of the deforming liquid. Since liquid properties play an insignificant role in the deformation dynamics, this explains that the temporal evolution of the aspect ratio is unaffected by the variation in
 $c/c^*$ of the test liquid (figure 5c). In non-dimensional form, equation (3.2), neglecting viscous, viscoelastic and surface tension terms, leads to a constant deformational acceleration of the half-droplet. This means that the net deformation should be quadratic in time which is indeed observed experimentally as well as predicted theoretically (figure 5).
3.4. Stage II: KH instability
Stage II represents the appearance and growth of the hydrodynamic instabilities. As shown in figure 4, three different regimes based on  $We$ can be observed in stage II. With increasing
 $We$, the first transition (
 $We\sim 700$) is observed when instead of only deformation, KH waves also appear on the droplet surface. To probe this further, KH instability wavelength
 $\lambda _{KH}$ is measured for different cases. To measure
 $\lambda _{KH}$, high-speed imaging (75 000 fps) at high resolution (4.5
 $\mathrm {\mu }$m px
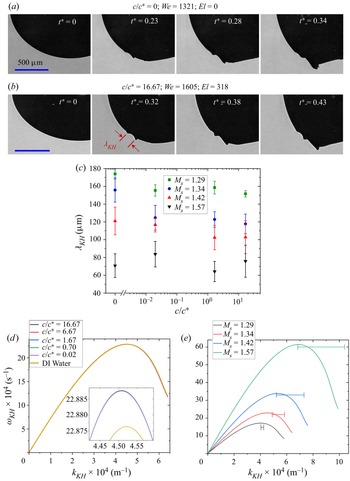
 $^{-1}$) is performed as shown in figures 6(a) and 6(b). These experimental images show the formation and evolution of KH waves for the case when a normal shock wave with
 $M_s=1.34$ interacts with a water and polymeric droplet with
 $c/c^*=16.67$, which is the maximum concentration considered in the present study. Only a quarter portion of the initially spherical droplet is captured to keep a high spatio-temporal resolution. Levitating droplet makes it convenient to keep the desired portion of the droplet in the camera field of view. The use of levitating droplets proves to be superior than the pendant droplet (Jackiw & Ashgriz Reference Jackiw and Ashgriz2021) and the falling droplet (Arcoumanis et al. Reference Arcoumanis, Khezzar, Whitelaw and Warren1994; Theofanous et al. Reference Theofanous, Mitkin and Ng2013) methods used in previous studies. Pendant droplets are not symmetric due to the presence of needle contact on one side, whereas in the case of a falling droplet, it is difficult to synchronize everything to capture images at high speed and high resolution in a small field of view. Moreover, falling polymeric droplets may exhibit asymmetry due to the presence of a long liquid tail formed while detaching from the source needle. All these challenges are overcome by using a levitating droplet.
Effect of liquid elasticity on the dynamics of KH instability. Zoomed-in images showing KH waves on the surface of droplets with  $c/c^*$ values of (a) 0 and (b) 16.67. (c) Experimental value of KH wavelength for different concentrations at different shock Mach number. (d) Dispersion plot of KH instability for different concentrations at
 $M_s=1.34$. Inset shows the dispersion plot near peak growth rate values. (e) Dispersion plot of KH instability for
 $c/c^*=16.67$ at different shock Mach numbers. Horizontal line corresponds to the experimental wavenumbers with standard error as the span.

To understand the effect of liquid elasticity,  $\lambda _{KH}$ is measured for water and polymeric droplets with three different concentrations subjected to four different
 $M_s$. The result is shown in figure 6(c). Insignificant effect of
 $c/c^*$ variation on
 $\lambda _{KH}$ is observed for a given
 $M_s$. However, a monotonic decrease in
 $\lambda _{KH}$ with increasing
 $M_s$ is observed for all concentrations. Considering an inviscid and incompressible airflow on the droplet surface, neglecting gravity effects and assuming a finite vorticity layer in the gas phase, one can apply the linear perturbation analysis to obtain a dispersion relation for KH instability as done for Newtonian droplets (Marmottant & Villermaux Reference Marmottant and Villermaux2004; Padrino & Joseph Reference Padrino and Joseph2006). We extended this approach for viscoelastic liquids by using the Oldroyd-B constitutive equation for the liquid phase. The details are provided in Appendix C. Finally, The dispersion relation for KH instability in an Oldroyd-B fluid can be written as
 \begin{equation} {\rm e}^{{-}2 \eta}=[1+(\varOmega-\eta)] \left[\frac{\varPhi+(\varOmega+\eta)\left\{2 \hat{\rho}-(1+\hat{\rho}) (\varOmega+\eta)-(1+\hat{\mu}) \beta \eta^{2}\right\}}{\varPhi+(\varOmega+\eta) \left\{2 \hat{\rho}-(1-\hat{\rho})(\varOmega+\eta)-(1-\hat{\mu}) \beta \eta^{2}\right\}}\right].\end{equation}
Equation (3.4) is the same as (C.4) and meanings of different symbols are provided in Appendix C. This equation is solved numerically to get the dispersion plot of KH instability. Since the growth of these instability waves happens on a very short time scale ( ${\sim }10^1$
 $\mathrm {\mu }$s), the dispersion relation can be solved by neglecting the transient decay and considering a constant value of
 $U_g$. Figure 6(d) shows the dispersion plot for water and polymeric droplets with different concentrations subjected to
 $M_s=1.34$. The dispersion curve for all the concentrations overlaps for a given
 $M_s$. Near the peak point, the growth rate for water is slightly lower compared with that for the polymeric droplet, as shown in the inset of figure 6(d). This is because of the small difference in surface tension of water as compared with the polymeric solution. Figure 6(e) shows the KH instability dispersion curve for a polymeric droplet with
 $c/c^*=16.67$ subjected to different
 $M_s$, and the horizontal line on the plot indicates the experimental value of wavenumbers with standard error as the span. It should be noted that the growth rate is not measured experimentally, and hence the horizontal lines are accurate only to the wavenumbers. Although the linear stability analysis only accounts for the first-order effects of perturbation, it is a powerful tool for deciphering the essential physics. This is evident from figure 6(e), where the predicted wavenumber
 $k_{KH_{max}}$ corresponding to the maximum growth rate of KH instability is in reasonable agreement with the experimental values. It is clear from the experimental observations and theoretical predictions (figure 6) that the dynamics of KH instability is governed by
 $M_s$ (and hence
 $We$), but the elasticity of the liquid phase plays an insignificant role.
3.5. Stage II: RT instability
As  $We$ is increased, the second transition (
 $We\sim 2800$) in stage II is marked by the appearance of RT waves, in addition to the deformation and the KH waves (figure 4). Again, the onset of critical
 $We$ for this transition is independent of
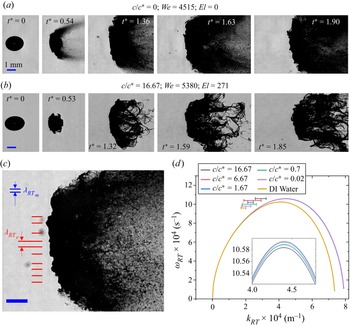
 $El$, similar to the first transition due to KH waves, as discussed in the previous section. The RT waves appear as surface corrugations on the flattened front surface of the droplet as shown in figures 7(a) (
 $t^*=1.63$), 7(b) (
 $t^*=1.59$) and 7(c). Figures 7(a) and 7(b) present the development of RT waves on the surface of a water droplet and high-concentration-polymer droplet (
 $c/c^*=16.67$) both subjected to a shock wave with
 $M_s=1.57$. For a given aerodynamic condition, the wavelength of front-surface corrugations has a similar magnitude irrespective of elastic properties. Joseph et al. (Reference Joseph, Beavers and Funada2002) provided a theoretical analysis to relate these surface corrugations with the RT waves. Later, Theofanous & Li (Reference Theofanous and Li2008) and Theofanous et al. (Reference Theofanous, Mitkin and Ng2013) performed laser-induced fluorescence imaging at an oblique angle of
 $30^{\circ }$ from the direction of side-view imaging and showed that the windward surface of the droplet remains smooth even at high
 $We$. They claimed that the appearance of surface corrugation at high
 $We$ is an artefact due to side-view shadowgraphic imaging. Despite this ambiguity in existing literature, there is no denying a few facts. First, even with the shadowgraphic images, the transition from smooth to the corrugated front surface of the droplet is observed when
 $We$ is increased from moderate to high value. Second, the RT waves do not appear as quickly as the KH waves due to large differences in their growth rate (Sharma et al. Reference Sharma, Singh, Rao, Kumar and Basu2021c). Before the appearance of RT waves, the droplet has already suffered some deformation and growth of KH waves, resulting in the development of a significant cross-sectional area normal to the airflow direction. This liquid–air interface, perpendicular to the airflow direction, provides a suitable platform for the RT instability to occur. Further, the cross-stream dimension of the flattened front surface is observed to be at least 1.3 times
 $D_0$ at the time of appearance of corrugations, whereas Theofanous & Li (Reference Theofanous and Li2008) reported the span of the front smooth surface to be only 0.65 times
 $D_0$. This means that even if the RT waves do not form in the central portion of the front surface, there is enough normal surface area away from the central portion for the RT waves to form. This also suggests the possibility of hybrid KH–RT instability where RT waves are modulated on the crest of KH waves (Zhao et al. Reference Zhao, Hou, Liu, Tian, Xu, Li, Liu, Wu, Zhang and Lin2014; Mitkin & Theofanous Reference Mitkin and Theofanous2017; Sharma et al. Reference Sharma, Singh, Rao, Kumar and Basu2021c) and appear as front-surface corrugations. It is worth noting that the ‘hybrid KH–RT’ mechanism referred to here is different from the ‘combined KH–RT’ mechanism studied by Vadivukkarasan & Panchagnula (Reference Vadivukkarasan and Panchagnula2016, Reference Vadivukkarasan and Panchagnula2017) in which the KH and the RT instabilities occur simultaneously as equal contributors to the destabilization process. Whereas, in the hybrid KH–RT mechanism, the KH waves appear first, leading to an increase in the area of the air–liquid interface normal to the airflow direction, which provides a suitable platform for the subsequent occurrence of RT instability. The combined KH–RT mechanism could provide an explanation for the periodicity of ligaments in the azimuthal direction as shown in figure 4 (stage III of the SIE regime) and figure 3(b), but studying this is beyond the scope of the present work. However, as far as the corrugations in the frontal surface of the liquid mass are concerned, the hybrid KH–RT mechanism is more suited. In a recent study, Mansoor & George (Reference Mansoor and George2023) used a digital holography imaging technique and provided evidence for the presence of RT instability on the droplet front surface in the catastrophic regime of shock-induced aerobreakup.
Effect of liquid elasticity on the dynamics of RT instability. Development of RT waves as surface corrugations on the flattened front surface of (a) water droplet and (b) polymeric droplet with  $c/c^*=16.67$. (c) Image of RT waves on the front surface of polymeric droplet with
 $c/c^*=1.2\times 10^{-3}$ at
 $M_s=1.57$,
 $We=5062$. Red lines indicate the wavelength of the surface corrugations, i.e. the experimental value of RT wavelength,
 $\lambda _{RT_e}$. Two horizontal blue lines show the RT wavelength
 $\lambda _{RT_m}$ predicted by the theoretical model. (d) Dispersion plot of the RT instability for different concentrations at
 $M_s=1.57$. Inset shows the dispersion plot near peak growth rate values. Horizontal line corresponds to the experimental wavenumbers with standard error as the span. Scale bar for all the experimental images corresponds to 1 mm.

In the previous section, we have already shown that the viscoelastic properties do not play a significant role in the KH instability for the considered range of parameters. Now we show that similar results are obtained for the RT instability. We have used the dispersion relation for RT instability at high  $We$ in an Oldroyd-B fluid derived by Joseph et al. (Reference Joseph, Beavers and Funada2002). For all practical purposes,
 $\rho _g<<\rho _l$ holds true. Therefore, neglecting
 $\rho _g/(\rho _l+\rho _g)$ and assuming
 $\rho _l/(\rho _l+\rho _g)=1$, the dispersion relation for RT instability with growth rate
 ${\rm i}\omega _{RT}$ and wavenumber
 $k_{RT}$ can be written as
 \begin{align} & -1+ \frac{1}{\omega_{RT}^2} \left({-}ak_{RT}+\frac{\gamma k_{RT}^3}{\rho_l}\right) + \frac{4k_{RT}^2}{{\rm i}\omega_{RT}} \left( \frac{\mu_g-\mu_{eff}}{\rho_l}\right) \nonumber\\ &\quad -\frac{4k_{RT}^3}{\omega_{RT}^2} \left( \frac{\mu_g-\mu_{eff}}{\rho_l}\right)^2 \left( q_{2}-k_{RT}\right)=0, \end{align}
where
 \begin{equation} q_2 = \sqrt{ k_{RT}^2 + \frac{{\rm i}\omega_{RT}\rho_l}{\mu_{eff}} }.\end{equation}
Here,  $\mu _{eff}$ can be obtained from (C.3) by replacing
 $\omega _{KH}$ with
 $\omega _{RT}$. Acceleration
 $a$ of the deformed droplet in the streamwise direction can be estimated from the following relation (Zhao et al. Reference Zhao, Wu, Li, Xu and Liu2018):
 \begin{equation} a = \frac{3\rho_g U_g^2 C_d D_m^2}{4 D_0^3 \rho_l}, \end{equation}
where  $C_d$ is the drag coefficient and
 $D_m$ is the maximum cross-stream diameter of the liquid mass. The RT instability depends strongly on the acceleration of the air–liquid interface. For an exact estimation of acceleration, in (3.7),
 $U_g$ should be replaced by relative velocity between the air and the droplet, which changes continuously with time. Coefficient
 $C_d$ depends on
 $D_m$, which in turn is a transient quantity. This makes it difficult to obtain the exact value of acceleration. However, an approximate estimate can be obtained using (3.7) and taking
 $C_d=1.2$ and
 $D_m=2.15D_0$ (Zhao et al. Reference Zhao, Wu, Li, Xu and Liu2018). Now, (3.5) can be solved numerically to plot the dispersion curve for RT instability. In the original formulation, Joseph et al. used retardation time as a fitting parameter to match the theory with experiments. However, retardation time is not an independent parameter for an Oldroyd-B fluid. It depends on the relaxation time, zero-shear viscosity of the solution and the solvent viscosity such that
 $\lambda _r=(\mu _s/\mu _0)\lambda$ (Larson Reference Larson2013). Using the correct value of
 $\lambda _r$, (3.5) is solved to get the RT dispersion plot for all the test liquid droplets subjected to
 $M_s=1.57$ equivalent to
 $We \approx 4900$ for polymeric droplet with
 $D_0=1.8$ mm. The results are shown in figure 7(d). The inset shows the dispersion plot near peak growth rate values, and horizontal lines represent wavenumbers measured from experimental images with standard error as the span. Growth rates are not measured experimentally; therefore, the location of the horizontal lines in figure 7(d) corresponds only to the wavenumbers but not the growth rates. It can be observed that the dispersion curve overlaps for all the polymeric liquids. Water shows a slight deviation from the polymeric liquids, mainly because of the small difference in the surface tension values. Wavelength of RT instability
 $\lambda _{RT_{m}}$ (blue) predicted from the model is shown in figure 7(c) for comparison with the experimental data,
 $\lambda _{RT_{e}}$ (red). Due to various approximations in theory, especially in estimating the acceleration
 $a$, this model is good only for an order-of-magnitude estimation of RT wavelengths. Despite its drawbacks, this model brings out the essential physics that the RT instability is insensitive to the liquid elasticity for a wide range of values studied in the present work.
3.6. Stage III: breakup morphology
From the perspective of viscoelastic droplet aerobreakup, stage III is the most important stage where the effect of the liquid elasticity enters into play. This stage corresponds to the evolution of liquid mass morphology pertaining to different modes of aerobreakup. Three distinct modes are identified in the present study as shown in stage III of figure 4. At low  $We$, the droplet undergoes large deformations and subsequent rebound of the liquid mass, leading to the vibrational mode of breakup. At moderate
 $We$, the droplet undergoes KH wave-assisted SIE mode and, at high
 $We$, the droplet experiences RT wave-assisted catastrophic mode. These breakup modes are governed by the underlying hydrodynamic instabilities during stage II. We have already shown in the previous subsections that the liquid elasticity plays an insignificant role in the first two stages; therefore, the critical
 $We$ for the onset of different breakup modes is also independent of
 $El$. However, the effect of
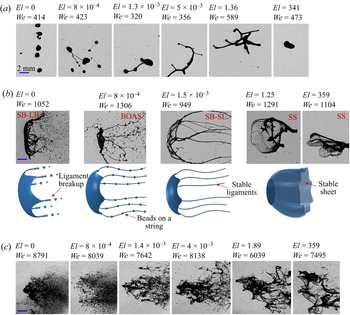
 $El$ is seen during stage III in terms of the liquid mass morphology obtained within a particular mode of breakup (figure 8). An increase in
 $El$ caused a higher degree of rebound in the vibrational regime and a larger size of fragmented chunks in the catastrophic regime. The effect of elasticity is even more prominent in stage III of the SIE mode. In this regime, based on
 $El$, a hierarchy of well-defined morphological structures is observed. At high
 $El$, the liquid mass entrained in the airflow forms a stable sheet denoted as SS in figure 8(b). As
 $El$ is lowered, sheet structure is not stable, they break and long stable ligament structures are observed, denoted as SB–SL. In the case of water, ideally
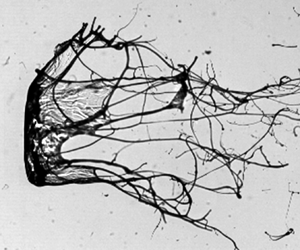
 $El=0$, neither sheet nor ligament structure is stable, and they break to form fine daughter droplets denoted as SB–LB. Schematic representations of these different morphologies observed during stage III of the SIE mode are shown below their corresponding experimental images in figure 8(b). Another interesting observation is the formation of a BOAS structure, reported widely in extensional flows of dilute polymeric solutions (Clasen et al. Reference Clasen, Eggers, Fontelos, Li and McKinley2006; Bhat et al. Reference Bhat, Appathurai, Harris, Pasquali, McKinley and Basaran2010; Malkin, Arinstein & Kulichikhin Reference Malkin, Arinstein and Kulichikhin2014; Scharfman et al. Reference Scharfman, Techet, Bush and Bourouiba2016). The BOAS structure consists of small beads of liquid mass connected by threadlike ligaments, as shown in figure 8(b). The BOAS structure is observed for a moderate
 $We$ (SIE regime) and a lower range of
 $El$. Below this
 $El$, ligaments are not stable and form fine droplets through the mechanism of Rayleigh–Plateau instability. Above this
 $El$, stable ligaments are formed. The BOAS is the intermediate morphology, representing the transition from the stable ligament to the fine daughter droplet formation.
Effect of  $El$ on morphology of liquid mass obtained in stage III of (a) vibrational mode, (b) SIE mode and (c) catastrophic breakup mode. Well-defined morphologies obtained in stage III of the SIE mode are denoted as: SB–LB, sheet breakup–ligament breakup; BOAS, beads on a string; SB–SL, sheet breakup–stable ligament; SS, stable sheet. Schematic representations of these morphologies are shown below their corresponding experimental images in (b).

All these morphologies observed in stage III show that the liquid elasticity enters as a stabilizing agent or resistance against the aerobreakup process. It is a challenging task to theoretically model these complex phenomena, especially the fragment size at high  $We$. There are theoretical studies related to the breakup of viscoelastic sheets and ligaments, but the results are ambiguous in the sense that some literature reported elasticity as a destabilizing agent (Liu, Brenn & Durst Reference Liu, Brenn and Durst1998; Wang et al. Reference Wang, Yang, Xie and Chen2015; Dasgupta et al. Reference Dasgupta, Sharma, Nath and Bhanja2021), whereas others reported it as a stabilizing agent (Goren & Gottlieb Reference Goren and Gottlieb1982; Bousfield et al. Reference Bousfield, Keunings, Marrucci and Denn1986; Ruo et al. Reference Ruo, Chen, Chung and Chang2011; Yang, Tong & Fu Reference Yang, Tong and Fu2013; Xie et al. Reference Xie, Yang, Fu and Qin2016). The resolution for this discrepancy comes in terms of unrelaxed tension (Xie et al. Reference Xie, Yang, Fu and Qin2016) in the liquid phase. The role of elasticity changes from a destabilizing to a stabilizing agent if the unrelaxed tension is accounted for in the relevant stability analysis. Unrelaxed tension develops in strong extensional flows of polymeric solution, where flow time scale is small compared with
 $\lambda$, such that it does not allow enough time for relaxation of polymer molecules (Bousfield et al. Reference Bousfield, Keunings, Marrucci and Denn1986). The condition for the presence of unrelaxed tension can be given in terms of the Weissenberg number,
 $Wi=\lambda \dot {\varepsilon }>1$, where
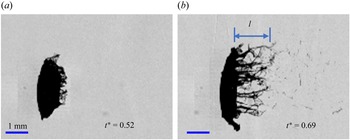
 $\dot {\varepsilon }$ is the strain rate of extensional flow. Various literature mentioned above provides stability analyses for viscoelastic sheets and ligaments in the context of flow coming out from a spray nozzle. The same physics can be extended to the stability of morphologies obtained in the SIE regime of the present study. In this regime, the liquid mass entrained in the airflow suffers strong extensional flow as it becomes drawn into sheets and ligaments (figure 9). An order-of-magnitude estimation of
 $\dot {\varepsilon }=({1}/{l})({{\rm d} l}/{{\rm d} t})$ can be obtained from the images as shown in figure 9, where
 $l$ is the instantaneous length of liquid mass entrained in the airflow. Average values of
 $\dot {\varepsilon }$ pertaining to the SIE regime are in the range of
 ${\sim }10^4\,{\rm s}^{-1}$. The value of
 $\lambda$ for the polymeric solutions used in the present study is in the range of
 ${\sim }10^{-3}\unicode{x2013}10^{-1}\,{\rm s}$. Here,
 $Wi \gg 1$ suggests the presence of unrelaxed tension in the liquid phase and, hence, the stabilizing role of elasticity. This explains the increased stability of liquid morphologies with increasing
 $El$ as observed in stage III of the present study. It is interesting to note that the stabilizing role of elasticity is not observed either in theory or from experiments during RT and KH instability analysis, as discussed in the two previous subsections. This can be attributed to insignificant unrelaxed tension, which was not accounted for in those analyses. For the existence of unrelaxed tension, a significant amount of strain accumulation is also required, in addition to a high strain rate (Bousfield et al. Reference Bousfield, Keunings, Marrucci and Denn1986). While this condition is fulfilled for stage III, where large deformations are present, it is not true for RT and KH wave formation in stage II. The RT and KH wavelengths are measured at their early stage of inception, where the deformation suffered by a liquid element near the instability wave is small and insufficient for unrelaxed tension in the liquid phase. Therefore, the stabilizing effect of elasticity is not observed in stage II, and a simple linear stability analysis with zero stress in the base state of the liquid phase can capture the physics.
Strong extensional flow near the equator region of a polymeric droplet with  $c/c^*=1.67$,
 $El=4\times 10^{-3}$ undergoing SIE mode of breakup at
 $We=987$.

3.7. Regime map of droplet breakup
Traditionally, aerobreakup modes of Newtonian droplets are presented in a  $We$–
 $Oh$ number space (Guildenbecher et al. Reference Guildenbecher, López-Rivera and Sojka2009). A similar plot, by replacing
 $Oh$ with an effective Ohnesorge number,
 $Oh_{eff}$, has been used for non-Newtonian droplets (Theofanous et al. Reference Theofanous, Mitkin and Ng2013; Mitkin & Theofanous Reference Mitkin and Theofanous2017). The drawback of
 $Oh_{eff}$ is that it only accounts for the shear thinning/thickening effect through liquid viscosity but not the elastic effects. Parameter
 $We$ represents the ratio of aerodynamic force to the surface tension forces, and it is equally important for the aerobreakup of viscous and viscoelastic droplets. Whereas
 $Oh$ brings in the effect of liquid viscosity, which is relevant only for viscous droplets. In the case of viscoelastic liquids, apart from viscosity and surface tension, elasticity also plays an important role. The elasticity of any liquid appears in terms of a non-zero finite relaxation time,
 $\lambda$. It is obvious that a non-dimensional number like
 $El$ that accounts for both viscous and elastic effects must be chosen in the case of viscoelastic droplet breakup, which has not been done before. The elasticity number represents the relative strength of the viscoelastic force to the inertial force in the liquid phase, and it can be estimated from (1.2). Parameter
 $El$ has been shown to be relevant for understanding the primary breakup of viscoelastic liquid sheets and ligaments (Thompson & Rothstein Reference Thompson and Rothstein2007; Wang et al. Reference Wang, Yang, Xie and Chen2015). Such structures are also observed in the present study (figure 8b) in a way that the morphological hierarchy is in coherence with
 $El$. This motivates the usage of
 $El$ as a crucial governing parameter in the present work.
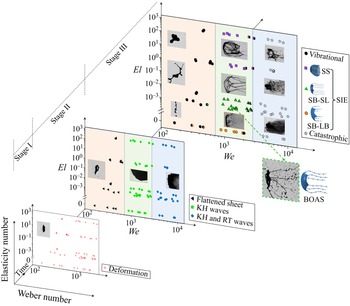
Results obtained from all the experimental runs are plotted in the form of a three-dimensional phase plot in  $El$–
 $We$–time coordinates as shown in figure 10. Representative experimental images are shown as insets in the plot. Droplet deformation (stage I) happens for the complete range of
 $We$ and
 $El$ considered in the present study. At high
 $We$ (>2800), stage I and stage II seem to proceed simultaneously; therefore, these data points are not shown in stage I. Stage II and stage III are divided into three distinct regimes. The orange region corresponds to the low-
 $We$ (<700) regime where an unstable flattened sheet formed in stage II leads to the vibrational mode of breakup in stage III. The green region indicates the moderate-
 $We$ (
 $700< We<2800$) regime, where KH instability in stage II leads to the SIE breakup mode in stage III. The blue region corresponds to the high-
 $We$ (>2800) regime where RT instability in stage II causes catastrophic breakup in stage III. The critical
 $We$ for the transition from one regime to the next regime is independent of
 $El$, and this is supported by the experimental evidence and mathematical analysis provided in the previous subsections. Inset images provided in stage III show the stabilizing effect of
 $El$ in the aerobreakup process. Well-defined liquid morphologies obtained in the SIE regime are shown with different symbols.
Three-dimensional regime map showing different stages and modes of viscoelastic droplet breakup on  $We$–
 $El$–time axes. Symbols with colour partition indicate transition between two consecutive modes.

4. Conclusions
The present exposition has outlined the role of elasticity in the underlying mechanism for different stages in the aerodynamic breakup of viscoelastic droplets. Multi-order variation in governing non-dimensional parameters,  $We$
 $({\sim }10^2\unicode{x2013}10^4)$ and
 $El$
 $({\sim }10^{-4}\unicode{x2013}10^2)$, is investigated in a precise experimental arrangement. This provides an excellent benchmark, much needed for future studies in the less explored area of viscoelastic droplet breakup. The values of non-dimensional numbers pertaining to the aerobreakup of liquid droplets reported in the present work are different from the data available in most of the existing literature. The reason for this deviation lies in the transient decay of gas flow properties behind the shock wave generated by the exploding wire technique used in the present experimental set-up. This set-up has several advantages over the conventional shock tube set-up and hence offers an alternative suitable platform for studying the aerobreakup of liquid droplets. In the present study, three distinct breakup modes are identified with increasing
 $We$ on a
 $We$–
 $El$ number plane, which are vibrational (
 $We<700$), KH wave-assisted SIE (
 $700< We<2800$) and RT wave-assisted catastrophic (
 $We>2800$) modes. Each mode can be described as a three-stage process based on the temporal evolution of the liquid mass. Stage I is droplet deformation, stage II corresponds to the development of different hydrodynamic instabilities and stage III involves the morphological evolution of liquid mass undergoing a particular mode of breakup. At high
 $We$, stage I and stage II proceed simultaneously due to the higher growth rate of hydrodynamic instabilities. It is interesting to note from the present experiment and the supporting mathematical analysis that the liquid elasticity plays an insignificant role in stages I and II of droplet aerobreakup. Since breakup modes are decided by the governing hydrodynamic instability in stage II, therefore the boundaries of
 $We$ for the onset of different breakup modes are independent of
 $El$. A significant effect of elasticity appears only during stage III of droplet breakup in terms of higher stability of liquid structures (or retardation to the breakup) with increasing
 $El$. Especially in the SIE regime, a hierarchy of well-defined liquid structures (sheet, ligament, BOAS, daughter droplets) are obtained with variation in
 $El$. Strong extensional flows in stage III ensure the presence of unrelaxed tension in the liquid phase, which in turn causes the elasticity to act as a stabilizing agent against the breakup of liquid structures. This provides direction for future theoretical works in that the unrelaxed tension must be accounted for in the breakup of viscoelastic droplets.
Supplementary movies
Supplementary movies are available at https://doi.org/10.1017/jfm.2023.377.
Funding
The authors acknowledge support from IGSTC (Indo–German Science and Technology Center) through project no. SP/IGSTC-18-0003. N.K.C. acknowledges support from the Prime Minister's Research Fellowship (PMRF).
Declaration of interests
The authors report no conflict of interest.
Appendix A. Transient characteristics of present shock tube set-up
To estimate the transient evolution of fluid properties at the droplet location, we use the analytical solution of blast waves provided by Bach & Lee (Reference Bach and Lee1970). This theory is derived with minimal assumptions, therefore providing accurate predictions of the blast waves especially for the low-shock-strength regime ( $M_s\leq 2$) as is the case of the present work. This analytical solution of blast waves is generalized for different geometries using a parameter
 $j$, such that
 $j=0$, 1 and 2 for planar, cylindrical and spherical blast waves, respectively. The shock wave generated in the present set-up closely approximates a planar wave due to rectangular confinement of the shock tube channel. In reality, the shock wave will transform from a planar to a spherical wave as it comes out of the shock tube. However, since the droplet location is very near to the open end of the shock tube, the planar shock front assumption can be extended up to this region. Therefore, we proceed with the analytical solution of Bach & Lee (Reference Bach and Lee1970), and solve it numerically for the present geometry assuming a planar shock front.
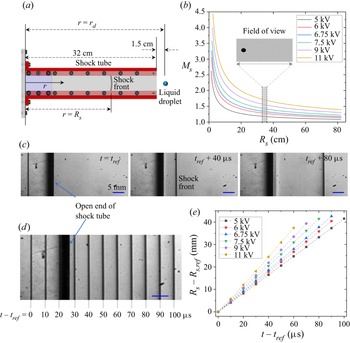
First, we discuss the decay of shock Mach number  $M_s$ as the shock front traverses near the initial location of the droplet. A shock wave is created at the blast location with very high initial Mach numbers depending upon the blast energy. Then
 $M_s$ decays as the shock front moves away from the blast location. To present this decay, a coordinate axis
 $r$ is defined as the distance from the blast location along the longitudinal axis of the shock tube as shown in figure 11(a). Here
 $r=R_s$ represents the position of the shock front which changes with time. Location
 $r=r_d=33.5$ cm is the initial droplet location for the present set-up. Figure 11(b) shows the theoretical prediction of
 $M_s$ decay as the shock front travels away from the blast location. Plots are shown for six different charging voltages (ranging from 5 to 11 kV) used for blasting the copper wire. Here, blast energy corresponding to a particular charging voltage has been used as a fitting parameter so as to match the predicted
 $M_s$ with the experimental value at
 $R_s=r_d$. It should be noted that
 $M_s$ corresponding to a particular charging voltage reported in the present study (figure 1b) is the value of
 $M_s$ when the shock front is at the droplet location, i.e.
 $R_s=r_d=33.5$ cm. Camera field of view for global observation of the droplet breakup covers approximately
 $33.1\,{\rm cm}\leq r \leq 36\,{\rm cm}$ which is sufficient to capture major events of droplet breakup. This region is indicated as the width of the grey shaded region in figure 11(b), the inset of which shows a shadowgraphic image of a droplet obtained from global observation imaging. It can be observed that there is no significant decay of
 $M_s$ as the shock wave traverses near the droplet location. This is also confirmed by additional experiments recorded at very high frame rate (
 $10^5$ fps) using the schlieren technique to capture the motion of the shock front in a region near the open end of the shock tube (which also covers the initial location of the droplet) as shown in figure 11(c). Here,
 $t_{ref}$ is the time instant at which the shock front gets captured for the first time in the schlieren images;
 $R_{s,ref}$ is the position of shock front at time
 $t=t_{ref}$. Positions of the shock front captured in 11 consecutive frames (recorded at
 $10^5$ fps), corresponding to the wire blasting at 5 kV, are stacked in a single image and shown in figure 11(d). This illustrates approximately equal displacement of the shock front in equal time intervals. The same data for different values of charging voltage are collectively shown in figure 11(e). Constant slope of plots in this figure confirms experimentally that the value of
 $M_s$ remains almost constant as the shock front traverses near the droplet location.
(a) Geometry of the shock tube channel. (b) Theoretical prediction of  $M_s$ variation with shock front position
 $R_s$ for different charging voltage. Width of grey band indicates the width of the field of view for global observation. Inset shows an experimental shadowgraphic image of a droplet in global observation imaging set-up. (c) Position of shock front at three different time instants captured using the schlieren imaging technique at
 $10^5$ fps. This particular case corresponds to a charging voltage of 5 kV. Note that the field of view for schlieren imaging is larger and it encompasses that of global observation imaging. (d) Positions of shock front obtained at an interval of 10
 $\mathrm {\mu }$s are stacked in a single image for the experiment corresponding to the previous images. (e) Time variation of shock front position extracted from the schlieren images, corresponding to different values of charging voltage.

Since our estimation for the transient decay of fluid properties relies on the theoretical solution of Bach & Lee (Reference Bach and Lee1970), it is important to check the veracity of this theory for the present set-up. Experimental measurement of gas velocity and pressure is not possible due to limitations of the experimental facility available to us. However, shock arrival time  $t_{arr}$ can be measured from the experiments. Time
 $t_{arr}$ is defined as the time required for the shock front to reach from the blast position (
 $r=0$) to the droplet location (
 $r=r_d=33.5$ cm). Experimental estimation of
 $t_{arr}$ is done using the images from global observation imaging set-up. The time instant of blasting is identified by a saturated image recorded in camera which is caused by the strong flash of light during the wire blast. Subsequently, the shock front is directly captured in the shadowgraphic images as it comes to the droplet location. Using these two frames,
 $t_{arr}$ can be estimated experimentally. Theory shows excellent match with the experiments in terms of
 $t_{arr}$ as shown in figure 12. The maximum error is
 $\sim$50
 $\mathrm {\mu }$s which is very small considering that there is an inherent uncertainty of
 $\pm$25
 $\mathrm {\mu }$s in experimental determination of
 $t_{arr}$ as the recordings are done at 40 000 fps. The error bars in figure 12 do not account for this uncertainty. These error bars are the standard deviation of
 $t_{arr}$ and
 $M_s$ obtained from ten different experimental runs. Excellent prediction of
 $t_{arr}$ supports the applicability of the theory of Bach and Lee to the present set-up, at least for the time duration up to which the shock front can be approximated as a planar shock front.
Shock arrival time  $t_{arr}$ obtained from experiments and theory for different values of
 $M_s$. Note that the reported
 $M_s$ corresponds to its value when the shock front is at the droplet location.

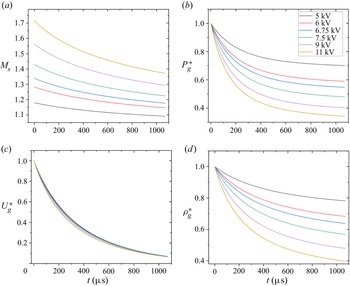
Next, we discuss the transient decay of the gas flow properties at the droplet location. It is already shown that  $M_s$ does not decay significantly as the shock traverses near the droplet location (figure 11). This does not guarantee a similar trend for gas density, velocity and pressure variation with time at any given point. These fluid properties depend upon two things: first, the Mach number with which the shock front is moving ahead of the desired location; second, the distance of the desired location from the shock front. Both these quantities decay with time, leading to an exponential decay of fluid properties at a fixed location behind a moving shock wave. Transient decay in Mach number of the shock front after its passage from the droplet location is depicted in figure 13(a). Let
 $P_g(r,t)$,
 $U_g(r,t)$ and
 $\rho _g(r,t)$ be the absolute pressure, velocity and density of the gas phase at any location
 $r$ and at a given time
 $t$. Figure 13(b–d) shows the theoretically estimated transient evolution of
 $P_g$,
 $U_g$ and
 $\rho _g$ after passage of shock front at the the droplet location. Here, these fluid properties are normalized by their maximum value and defined as follows:
 \begin{equation} P_g^*=\frac{P_g(r=r_d,t)}{P_{g,max}};\quad U_g^*=\frac{U_g(r=r_d,t)}{U_{g,max}};\quad \rho_g^*=\frac{\rho_g(r=r_d,t)}{\rho_{g,max}}. \end{equation}
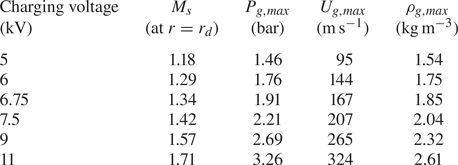
Here,  $t=0$ is the time instant of shock wave interaction with the droplet. The maximum values of gas pressure, velocity and density at the droplet location are attained at
 $t=0$, and these values corresponding to different charging voltages are provided in table 2.
(a) Transient evolution of shock Mach number after the passage of the shock front from the droplet location. Time  $t=0$ corresponds to moment of droplet–shock wave interaction. Transient evolution of (b) absolute pressure, (c) velocity and (d) density of the gas phase at the droplet location.

Calculated peak value of gas-phase fluid properties at the droplet location.

From figure 13 it can be observed that the properties of gas phase decay rapidly with time as opposed to the conventional shock tube set-up where constant fluid properties can be sustained for sufficiently long duration. One must consider these transient properties associated with the present set-up when comparing with the results of existing literature.
Appendix B. Expression for viscoelastic force  $F_{ve}$ during droplet deformation

For an upper convected Maxwell fluid subjected to a two-dimensional incompressible and purely elongational flow, the expression for  $F_{ve}$ can be written as
 \begin{equation} F_{ve}=\frac{2}{3}{\rm \pi} R_0^3 \times \frac{\mu_p}{y\lambda}\xi , \end{equation}
where
 \begin{align} \xi=\exp({-t/\lambda})\left[ \left( \frac{y}{y_0}\right)^2-\left( \frac{y_0}{y}\right)^2\right] + \frac{\exp({-t/\lambda})}{\lambda} \left[ y^2 \int_{0}^{t} \frac{{\rm e}^{\tau/\lambda}}{y^2} {\rm d}\tau - \frac{1}{y^2} \int_{0}^{t} y^2\,{\rm e}^{\tau/\lambda}\,{\rm d}\tau \right], \end{align}
 $\mu _p$ is the polymer contribution to the zero-shear viscosity of the polymeric solution and
 $y_0=\frac {3}{8}R_0$ is the initial value of
 $y$. It should be noted that
 $\xi$ is already a non-dimensional quantity, but for simplicity, it can be expressed in terms of other non-dimensional quantities as
 \begin{align} \xi &=\exp({-t'/De})\left[ \left( \frac{y'}{y'_0}\right)^2-\left( \frac{y'_0}{y'}\right)^2\right] + \frac{\exp({-t'/De})}{De} \left[ y'^2 \int_{0}^{t'} \frac{\exp({\tau/De})}{y'^2} {\rm d}\tau \right.\nonumber\\ &\quad \left.-\frac{1}{y'^2} \int_{0}^{t'} y'^2\exp({\tau/De})\,{\rm d}\tau\right]. \end{align}
Here, quantities with primes represent non-dimensional terms,  $R_0$ and
 ${R_0}/{U_g}$ have been used as the length scale and time scale for non-dimensionalization and
 $De={\lambda U_g}/{R_0}$ is the Deborah number.
Appendix C. Dispersion relation for KH instability
We model the viscoelastic polymeric liquid by using the Oldroyd-B constitutive equation given by
 \begin{equation} \boldsymbol{T}+\lambda\stackrel{\kern0.3em\boldsymbol{\nabla}}{\boldsymbol{T}} = 2\mu_0 \left(\boldsymbol{D} + \lambda_r \stackrel{\kern0.3em\boldsymbol{\nabla}}{\boldsymbol{D}} \right). \end{equation}
Here,  $\boldsymbol {T}$ and
 $\boldsymbol {D}$ are the stress and the strain rate tensors. A triangle on top denotes the upper convected derivative. Parameter
 $\lambda _r=({\mu _s}/{\mu _0})\lambda$ is the retardation time. A linear stability analysis for small perturbations in the liquid phase assuming no base flow is performed. Considering perturbation of the normal mode form with growth rate
 ${\rm i}\omega _{KH}$, the relation between perturbed stress tensor
 $\boldsymbol {T}_{\boldsymbol {p}}$ and strain rate tensor
 $\boldsymbol {D}_{\boldsymbol {p}}$ can be written as (Awasthi Reference Awasthi2021)
 \begin{equation} \boldsymbol{T}_{\boldsymbol{p}} = 2\mu_0 \left(\frac{1+{\rm i}\lambda_r \omega_{KH}}{1+{\rm i}\lambda\omega_{KH}} \right) \boldsymbol{D}_{\boldsymbol{p}}. \end{equation}
Equation (C.2) is similar to he constitutive relation for a Newtonian fluid with an effective viscosity  $\mu _{eff}$, such that
 \begin{equation} \mu_{eff} = \mu_0 \left(\frac{1+{\rm i}\lambda_r\omega_{KH}}{1+{\rm i}\lambda\omega_{KH}}\right). \end{equation}
Replacing the Newtonian viscosity with  $\mu _{eff}$ for liquid phase in the model proposed for Newtonian droplets (Marmottant & Villermaux Reference Marmottant and Villermaux2004; Padrino & Joseph Reference Padrino and Joseph2006), the dispersion relation for KH instability in a viscoelastic fluid can be written as
 \begin{equation} {\rm e}^{{-}2 \eta}=[1+(\varOmega-\eta)] \left[\frac{\varPhi+(\varOmega+\eta) \left\{2 \hat{\rho}-(1+\hat{\rho})(\varOmega+\eta)-(1+\hat{\mu}) \beta \eta^{2}\right\}}{\varPhi+(\varOmega+\eta)\left\{2 \hat{\rho}-(1-\hat{\rho}) (\varOmega+\eta)-(1-\hat{\mu}) \beta \eta^{2}\right\}}\right], \end{equation}
where  $\varOmega =-2\omega _{KH}\delta /U_g$ is the dimensionless growth rate in which
 $\delta$ is the boundary layer thickness in the gas phase;
 $\eta =k_{KH}\delta$ is the dimensionless wavenumber in which
 $k_{KH}=2{\rm \pi} /\lambda _{KH}$ is the wavenumber; and
 $\hat {\mu }=\mu _g/\mu _{eff}$ and
 $\hat {\rho }=\rho _g/\rho _l$ are the viscosity and density ratios of gas and liquid phases. Parameters
 $\beta$ and
 $\varPhi$ are defined as
 \begin{equation} \beta = \frac{{\rm i}4\mu_{eff}}{\rho_l U_g \delta};\quad \varPhi = J\eta + \left(\frac{\hat{\rho}}{We_2}\right)\eta^3 + 2\eta^2\hat{\mu}\beta , \end{equation}
where
 \begin{equation} We_2 = \frac{\rho_g U_g^2 \delta}{4\gamma};\quad J = \frac{4(\rho_l-\rho_g)g \delta}{\rho_l U_g^2}. \end{equation}
Boundary layer thickness  $\delta$ in the gas phase is evaluated from the following expression:
 \begin{equation} \frac{\delta}{D_o} \sim \frac{1}{\sqrt{Re_{D_0}}};\quad \frac{\delta}{D_o}= \frac{C}{\sqrt{Re_{D_0}}}, \end{equation}
where  $Re_{D_0}$ is the Reynolds number in the gas phase with
 $D_0$ the characteristic length scale. Proportionality constant
 $C$ has been used as a fitting parameter.