Introduction
During the growth phase oocytes synthesize large amounts of RNA (Picton et al., Reference Picton, Briggs and Gosden1998). Oocyte synthesis of mRNAs and rRNAs is activated in the secondary follicle and is maintained up to the tertiary follicle, when the oocyte is large enough to undergo meiotic maturation (Fair et al., Reference Fair, Hyttel and Greve1995; Hyttel et al., Reference Hyttel, Fair, Callesen and Greve1997), harboring mRNA transcribed from nearly 10 000 genes (Zeng et al., Reference Zeng, Baldwin and Schultz2004). In bovine, this RNA stock is responsible for embryo development during the first and second cleavages. After that, there is a progressive shift from maternal to embryonic transcripts stocks, generally defined as the major genome activation (Memili & First, Reference Memili and First2000).
The developmental competence of an oocyte is defined by its capacity to develop to the blastocyst stage or to term (Lonergan et al., Reference Lonergan, Rizos, Ward and Boland2001). However, in practice, competent oocytes are classified based on follicular size (Pavlok et al., Reference Pavlok, Lucas-Hahn and Niemann1992; Boldin & Sirard, 1995) and on its morphological quality (Gordon, Reference Gordon1994). After fertilization, the kinetics of first cleavage is also associated with oocyte quality (Lonergan et al., Reference Lonergan, Rizos, Ward and Boland2001). A large scale study on the nature of the transcripts present in bovine oocytes was previously reported (Dalbies-Tran et al., 2003). Regarding oocyte differential gene expression, some transcripts have been isolated and associated with developmentally competent oocytes (Donison et al., 2004; Fair et al., Reference Fair, Murphy, Rizos, Moss, Martin, Boland and Lonergan2004; Mourot et al., Reference Mourot, Dufort, Gravel, Algriany, Dieleman and Sirard2006). These findings support the hypothesis that specific mRNAs or proteins produced during oogenesis are responsible for oocyte competence (Sirard et al., Reference Sirard, Richard, Blondin and Robert2006).
The oocytes growth during folliculogenesis is associated with the synthesis of maternal molecules (RNAs and proteins) in order to sustain cleavage until embryo genome activation. The oocytes that do not finish the process of mRNA synthesis at the moment of recovery from the follicle have a lower developmental competence, (Fair et al., Reference Fair, Hyttel and Greve1995). An individual oocyte was estimated to contain around 57 pg of polyadenylated (poly(A)) mRNA (Lequare et al., 2004), but no studies have focused on the quantitative differences in poly(A) mRNA in oocytes with a low or a high developmental competence. In this study, we tested the hypothesis that cumulus–oocyte complexes (COCs) of higher quality, and therefore more competent oocytes, have higher amounts of poly(A) mRNA compared with oocytes with lower developmental competence, which were obtained from lower quality COCs. In this report, the objective was to estimate global poly(A) mRNA differences in bovine oocytes that had originated from COCs of different morphological quality and compare the poly(A) mRNA abundance between oocytes before and after in vitro maturation (IVM) and that of early developing embryos. To achieve these goals we used global cDNA amplification of poly(A) mRNA using real-time PCR, which permitted the evaluation of fold changes in poly(A) mRNA in oocytes or embryos.
Material and methods
Experimental design
The first experiment was designed to evaluate the developmental competence of oocytes from two groups of morphologically classified COCs. Secondly, we estimated the differences in poly(A) mRNA expression in oocytes from these two different COC groups, applying a template switch reverse transcription and global amplification and a recognized housekeeping gene (GAPDH). Thirdly, we evaluated the differences in poly(A) mRNA and GAPDH expression during oocyte maturation and during part of the preattachment embryo development.
Oocyte collection and in vitro maturation
Chemicals used for media preparation (IVM, fertili-zation and embryo culture) were obtained from Sigma Company, unless otherwise specified.
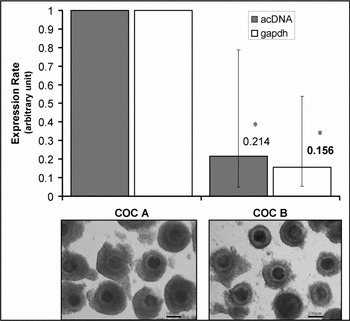
Oocytes were obtained from Nellore cattle (Bos indicus) ovaries collected at a slaughterhouse. Cumulus–oocyte complexes were aspirated manually from follicles 3–8 mm in diameter using an 18 gauge needle. Under a stereomicroscope, COCs were classified morphologically and separated in two groups: (A) homogeneous ooplasm surrounded by at least five layers of compact cumulus cells, and (B) ooplasm not homogeneous surrounded by less than five layers of cumulus cells (Fig. 2). The different quality COCs were matured in vitro in TCM-199–sodium bicarbonate medium (Gibco(tm)) supplemented with fetal bovine serum, 10%; gentamicin, 50μ luteinizing hormone, 50 μg/ml; pyruvate, 22 μg/ml; follicle-stimulating hormone, 0.5 μg/ml; estradiol, 1 μg/ml, in a controlled atmosphere of air supplemented with CO2 (5%), at 38 °C and 100% humidity.
Cumulus–oocyte complexes were collected for RNA analysis at the time of recovery from ovaries (GV) and after 18 h of maturation (MII). Cumulus cells were removed from oocytes by vortexing in sterile phosphate-buffered saline solution (PBS). The oocytes were washed twice in PBS and once in acid phosphate-buffered solution (PBS–HCl, pH 2.5) to remove the zona pellucida (ZP). After the ZP was removed, the oocytes were washed three times in PBS containing polyvinyl–pyrrolidone (PVP) 0.1% and RNase inhibitor (RNase Inh, 1 U/μl, Amersham Biosciences) (Han et al., Reference Han, Song, Uhum, Do, Kim, Chung and Lee2003). Ten immature and 10 mature COCs of each quality, collected in three different experiments, were individually stored in 1 μl PBS–PVA–RNase Inh solution, snap frozen in liquid nitrogen in a microtube (200 μl) and stored at −8 °C (n = 30 oocytes from each COC quality group).
The developmental competence of morphological COCs was evaluated by estimating the cleavage and blastocyst rates of parthogenetically activated oocytes. Briefly, denuded oocytes from both COCs groups were placed in modified CR2 supplemented with 2.5% FCS + 0.5% bovine serum albumin (BSA) for ageing until parthenogenetic activation. Oocytes were chemically activated at 26 h postmaturation by incubation in 5 μM ionomycin for 5 min in HSOF (HEPES-supplemented synthetic oviduct fluid) at room temperature, followed by 4 h in 2.0 mm 6-DMAP in CR2 2.5% FCS + 0.5% BSA. At the end of the activation treatment, the oocytes were co-cultured with a cumulus cell layer in 100 μl of CR2 medium under mineral oil. Cleavage, blastocyst and eclosion rates were estimated at 48 h after activation (hpa), 168 hpa and 210 hpa, respectively.
In vitro fertilization and embryo culture
Groups of 30 good-quality matured COCs (morphologically classified as grade A) were fertilized (IVF) in 100 μl in vitro fertilization medium [TALP, supplemented with heparin (10 μg/ml), pyruvate (22 μg/ml), gentamicin (50 μg/ml), BSA fraction FAF (6 mg/ml), penicillin (2 μM), hypotaurine (1 μM) and epinephrine (0.2 μM)] (Parrish et al., Reference Parrish, Susku-Parrish, Winer and First1988) containing 2 × 10⁶ spermatozoa per ml. After 18 h, the presumptive zygotes had the cumulus cells removed by manual pipetting and were co-cultured with a cumulus cell layer in 100 μl of CR2 medium under mineral oil. In vitro fertilization and embryo culture were maintained at 38 °C in a water-saturated atmosphere and at 5% CO2. Embryos were individually collected at 27 (2-cell), 36 (4-cell), 48 (early 8-cell), 90 (late 8-cell), 160 (blastocyst) and 210 (hatched blastocyst) hours postinsemination (hpi) and stored as described for oocytes, with exception of hatched blastocysts (210 hpi), that dispensed ZP removal. Ten embryos at each stage were collected individually from three independent in vitro fertilizations (n = 30 embryos per stage).
DNase treatment, reverse transcription and real-time polymerase chain reactions
Prior to cDNA synthesis, the DNA in oocytes or embryo cell lysate was degraded by DNase I treatment (DNase I – Amersham Biosciences, 1 U/μl; MgCl2, 6 mM; Tris, 4 mM) for 10 min at 37 °C followed by incubation at 70 °C for enzyme inactivation. Immediately, 1 μl of RNase-free water containing oligo dTTP(12–18) (1 μg) was added to each sample. The tubes were heated at 70 °C for 5 min and cooled at 4 °C for addition of enzyme (ImProm–II TM Reverse Transcriptase, Promega) and reagents mix [buller: Tris 250 mM; KCl 375 mM; DTT 50 mM; MgCl2 3 mM; dNTP 10 mm each; oligo dGTP(12) (template switching primer) 1 μg; RNase inhibitor 1 U/μl; reverse transcriptase, 50 U] in a final volume of 5 μl. The samples were incubated at 50 °C for 1 h, heated to 70 °C and frozen at −20 °C until use.
In order to purify the first strand cDNA, an ethanol precipitation solution was added to the reverse transcription reaction solution (ethanol 100%, 3.5 v/v; NaAc 3 mM, 0.2 v/v; glycogen 1 μg) and maintained at −20 °C for 15 h. The solution was centrifuged for 1 h at 21 900 g at 4 °C, the supernatant discarded, 200 μl ethanol (70% v/v) was added for salt removing and the sample was centrifuged for 20 min. The pellet was air-dried and 10 μl ultrapure water was added, then incubated at 50 °C for 30 min and frozen at −20 °C until use.
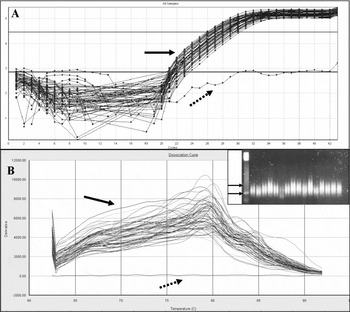
Template switch and global cDNA amplification (acDNA) applied herein was modified from a method previously described (Zhu et al., Reference Zhu, Machleder, Chenchik, Li and Siebert2001) and used to estimate the relative abundance of poly(A) mRNA. One half of a cDNA solution obtained individually from oocytes or embryos was used for global cDNA amplification. The cDNA amplification was performed using a real-time PCR thermocycler (Applied Biosystems 7500 Real Time PCR System) and SYBR Green I as a DNA dye. Reactions were carried out using the LightCycler FastStart DNA Master SYBR Green I (Roche Diagnostics Corporation) reaction mix (1×), supplemented with MgCl2 (5 mM), oligo dGTP(12) (0.2 μM), oligo dTTP(12) (0.2 μM) in a final volume of 10 μl. The cycle protocol was as follows: denaturation at 95 °C for 10 min, followed by 45 cycles at 95 °C for 10 s, 57 °C for 1 min and 72 °C for 2 min and finished with a dissociation curve (Figure 1B).
cDNA amplifications monitored in a real-time thermocycler. The complete arrow is indicating reactions with cDNA template and dot arrow is indicating non-template control reactions. (a) Output graphic of LinReg application of log fluorescence (y axis) plotted in function of PCR cycles at the moment of efficiency estimation. The horizontal lines indicate the upper and lower values for efficiency estimate and the between-lines dot for each template amplification indicate the fluorescence reading used for individual reaction efficiency estimation. (b) Melting curve after PCR cDNA amplification; derivative values for melting temperature of amplicons (y axis). A picture of a electrophoresis gel is shown in the inset, in which upper and lower arrows indicate 500 bp and 250 bp, respectively.

Relative quantification of glyceraldehyde 3-phos-phate dehydrogenase (GAPDH) gene mRNA was done using primers and TaqMan™ probes synthe-sized by Applied Biosystems. The primers used for GAPDH gene expression measurements were: 5′-AAG-GCCATCACCATCTTCCA-3′, 5′-CCACTACATACTC-AGCACCAGCAT-3′ and probe 5′-VIC-AGCGAGATC-CTGCCAACATCAAGTGG-TAMRA-3′. Amplifica-tions were carried out by an initial incubation at 95 °C for 10 min, followed by 50 cycles at 95 °C for 15 s and 60 °C for 1 min, containing TaqMan® Universal PCR Master Mix 1×, primers 0.1 μM (each) and probe 0.1 μM, in a final volume of 12.5 μl. The volume of 1:10 cDNA solution from one oocyte or embryo was used for PCR amplifications. Every PCR experiment contained a non-template control reaction to avoid contamination biased on data recording (Fig. 1).
To estimate the effect of variability due to the technique, we performed the acDNA amplification reaction with the equivalent of 1:10 of an oocyte (n = 3) in triplicate. The efficiency of reaction and cycling threshold (Ct) was estimated as described further in this article (see next section). Mean and variance was calculated separately for replicates and for templates (oocytes).
PCR data and statistical analysis
The PCR efficiency was estimated for template switch global cDNA amplification and GAPDH in each sample (from oocytes and embryos) using the PCR kinetics in individual reactions applying LinReg software default parameters (number of points between four and six and best correlation coefficient) (Ramakers et al., Reference Ramakers, Ruijter, Deprez and Moorman2003). For each pair of primers, the fluorescence threshold line was fixed at the average of the lower and higher fluorescence values used by the software to estimate PCR efficiency (Fig. 1a).
The fold differences in amount of GAPDH or poly(A) mRNA were calculated by the equation (Pfaffl et al. Reference Pfaffl2001):

To measure the significance of the differences we used pairwise fixed reallocation randomization test (bootstrap) in the Relative software tool and updates that are provided by Pfaffl et al. (Reference Pfaffl, Horgan and Dempfle2002). The hypothesis of no difference between groups was the null one (H0) and the differences were considered to be statistically significant when probability of the alternative hypothesis [P(H1)] was inferior to 0.05. Results are shown in rate of expression followed by the lower and higher standard error values calculated by the software.
Results
Despite the reduced initial amount of cDNA template found in oocytes and embryos, it was possible to monitor cDNA amplification by real time PCR. During validation process we designed a pre-experiment to test the technical repeatability. Three different oocytes were subjected to the cDNA amplification in triplicates showing Cts of 23.3; 27.22 and 38.18. Efficiency in PCR was estimated to be 1.74 ± 0.04. Calculating the variance within and between individuals we estimated that 0.39% of the total variance of the trial was due to the amplification effect.
We estimated the efficiency of amplification reactions by PCR kinetics procedure for oocytes and embryos individually (Ramakers et al., Reference Ramakers, Ruijter, Deprez and Moorman2003). Mean and standard error measures of efficiency calculated for acDNA and GAPDH in oocytes and embryos were 1.79 ± 0.008 and 2.03 ± 0.014 respectively, suggesting that the cDNA synthesis approach and ethanol precipitation produced good quality template. Mean values were considered for the reaction efficiency for fold change calculations applying REST© software. No putative-biased amplification of one transcript or template contamination during PCRs was observed in acDNA amplification based on the melting curves (Fig. 1b).
Comparison between immature oocytes originated from different COCs qualities revealed that grade B COCs have less poly(A) mRNA (0.214, 0.048–0.787, p = 0.003) and GAPDH transcripts (0.156, 0.049–0.539, p = 0.001) when compared with oocytes obtained from grade A COCs (Fig. 2).
Expression rate in immature oocytes, collected from grade A and B COCs estimated by cDNA amplification (acDNA) and the gene GAPDH. The columns represent the relative quantifications of the acDNA (grey bars) and the GAPDH (white bars) transcripts between the groups COC A (reference) and COC B (test). The lines represent the standard error of the estimation, provided by REST© software.* p < 0.01.

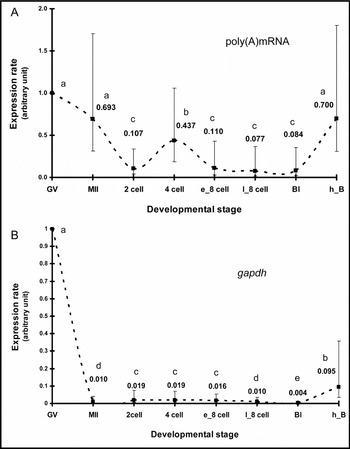
The estimation of the expression rates for poly(A) mRNA and GAPDH showed a decrease in both estimates after oocyte maturation. Following fertilization, an increase in mRNA content was observed in 4-cell embryos. RNA expression decreased at 8-cell and blastocyst stages and increased after blastocyst hatching. Figure 3 shows poly(A) mRNA and GAPDH expression estimated in oocytes and embryos.
Poly(A) mRNA and GAPDH mRNA expression during the oocyte in vitro maturation and embryo development. Oocytes before (GV) and after (MII) IVM and embryos at the 2-cell (27 hpi), 4-cell (32 hpi), early 8-cell (e_8-cell; 48 hpi), late 8-cell (l_8-cell; 90 hpi), blastocyst (Bl; 160 hpi) and hatched blastocyst (h_B; 210 hpi). Black squares represent the expression rate and the discontinuous line represents mRNA dynamics. The comparisons are represented in reference to the immature oocyte. Numbers with different overwritten letters have p < 0.05.

Discussion
The main purpose of amplifying cDNA is to enhance the cDNA concentration for later PCR reactions, cDNA subtractions or cloning procedures. The method to generate full-length cDNAs named reverse transcriptase template switching (Zhu et al., Reference Zhu, Machleder, Chenchik, Li and Siebert2001) has been generally used to evaluate gene expression in low template samples. In this study, we used the basis of template switching in reverse transcription (Kulpa et al., Reference Kulpa, Topping and Telesnitsky1997) to generate full-length single-stranded cDNA with a poly(C) tail at the 5′ end, with slight modifications followed by ethanol precipitation procedure to reduce the variability due to the presence of reverse transcription reagents (Deprez et al., Reference Deprez, Fijnvandraat, Ruijter and Moorman2002; Liss, Reference Liss2002); finally global cDNA amplification was carried out using real-time monitored polymerase chain reactions using SYBR Green I as a double-stranded DNA dye (Nagy et al. Reference Nagy, Kelemen, Fehér, Zvara, Juház and Puskás2005).
The relative frequency of genes transcripts can be maintained in the reaction if the cDNA amplification is stopped at the PCR exponential phase (Iscove et al., Reference Iscove, Barbara, Gu, Gibson, Modi and Winegarden2002; Seth et al., Reference Seth, Gorrell, McGuiness, Leo, Lieber, McCaughan and Haber2003; Subkhankulova et al., 2006). Monitoring the amplification PCR fluorescence signals at each cycle allowed us to establish a line threshold at the initial cycles of the PCR exponential phase. Therefore, it was possible to perform semi-quantitative analysis to estimate differences in poly(A) mRNA expression in oocytes and embryos. The reactions performed individually allowed us to estimate the RNA expression variability in the different developmental stages.
Amplification reactions of GAPDH-specific transcripts were used as a constitutive expressing gene control and to estimate individual variation of one specific poly(A) mRNA transcript (GAPDH).
While it is a possible to separate the COCs in more specific classes, the two morphological categories of COCs used in this study were chosen because many studies compare these groups of COCs in terms of oocyte developmental competence. The healthy COCs (grade A) have higher cleavage and blastocyst rates (Hawk & Wall, Reference Hawk and Wall1994; Bilodeau-Goeseels & Panish, Reference Bilodeau-Goeseels and Panich2002).
The differences in developmental competence of oocytes are influenced by the growing or regressing follicular phase at the moment they are recuperated (Salamone et al., Reference Salamone, Adams and Mapletoft1999). Results presented in this article on poly(A) mRNA relative quantification demonstrate that the poly(A) mRNA expression in the oocyte is associated with the COCs morphology. Grade A COCs had oocytes with higher levels of poly(A) mRNA. In consequence, poly(A) mRNA accumulated on the oocyte is positively co-related to oocyte development potential. However, in this study we did not investigate the cause of variation in mRNA content from different COCs morphology.
Translational regulation is a very important feature in oogenesis and embryo development. The most common mechanisms that regulate gene expression at the posttranscriptional level is mRNA adenylation and deadenylation, the CAP structure at the 5′ end of the mRNA and the effective action of mRNA binding factors (Eichenlaub-Ritter & Peschke Reference Eichenlaub-Ritter and Peschke2002; Piccioni et al., Reference Piccioni, Zappavigna and Verrotti2005). The extension of the poly(A) tail at the 3′ end during in vitro maturation was found to be associated with oocyte competence and those oocytes classified as of putative low competence had shorter tails (Brevini-Gandolfi et al., Reference Brevini-Gandolfi, Favetta, Maurri, Luciano, Cillo and Gandolfi1999). The length of the oligo dT used as primer during reverse transcription (12–18 nucleotides) in this study allowed estimating the amount of mRNA independent of the poly(A) extension. Further studies shall be conducted to verify if the difference in mRNA content is influenced by efficient mRNA synthesis machinery, follicular status or the efficiency of the mRNA-binding proteins to direct mRNA protection or degradation.
The quantity of polyadenylated mRNA in immature oocyte was measured for mouse (Pikó & Clegg, Reference Pikó and Clegg1982) and cow (Lequarre et al., Reference Lequarre, Traverso, Marchandise and Donnay2004) and estimated for human oocytes (Neilson et al., Reference Neilson, Andalibi, Kang, Coutifaris, Strauss, Stanton and Green2000). After in vitro maturation (MII) we calculated a 31% decrease in mRNA, consistent with the findings for mouse approximately 20% of total RNA and approximately 30 % for poly(A) mRNA (Bachvarova & De Leon, Reference Bachvarova and De Leon1980; Pikó & Cleeg, 1982), but inferior to the previously estimated in cattle 44 to 55% (Lequarre et al. Reference Lequarre, Traverso, Marchandise and Donnay2004). The difference observed in these results may be caused by species (Bos indicus), culture system and/or methodological differences. Although no comparison between mRNA content of Bos taurus × B. indicus animals has been conducted, it has previously been reported that the culture conditions introduce variations in RNA transcriptions in blastocyst produced in vitro (Wrenzycki et al., 1999). Hence, our estimates were performed using individual oocytes. This approach allowed the observation of a large variability within the groups. The reduction in poly(A) mRNA is consistent with the reported quantifications made for specific gene transcripts (Roller et al., Reference Roller, Kinloch, Hiraoka, Li and Wassarman1989; Seveg et al., Reference Seveg, Memili and First2001; Robert et al., Reference Robert, McGraw, Massicotte, Pravetoni, Gandolfi and Sirard2002; Bettegowda et al., Reference Bettegowda, Patel, Ireland and Smith2006) and results for GAPDH transcripts in this article. It has been previously suggested that the active translational status in the mature oocyte leads to this mRNA decrease (Sirard et al., Reference Sirard, Florman, Leibfried-Rutledge, Barnes, Sims and First1989; Kastrop et al., Reference Kastrop, Bevers, Destree and Kruip1991). The mRNA degradation is mostly regulated by adenylation or deadenylation of mRNAs (Piccioni et al., Reference Piccioni, Zappavigna and Verrotti2005) depending on the gene considered (Payton et al., Reference Payton, Rempel and Bachvarova1988; Brevini et al., Reference Brevini, Lonergan, Cillo, Francisci, Favetta, Fair and Gandolfi2002). Despite the evidence of decrease in mRNA, there are genes that are upregulated during oocyte maturation (Dalbies-Tran & Mermillod, Reference Dalbies-Tran and Mermillod2003).
After in vitro fertilization, we observed a decrease in poly(A) mRNA measured at 27 hpi (2-cell embryos) compared with mature oocytes. Two independent microarrays analysis in mouse embryos at early development showed a group of genes that has transcripts in mature oocyte but with marked depletion after insemination (Hamatani et al., Reference Hamatani, Carter, Sharov and Ko2004; Zeng et al., Reference Zeng, Baldwin and Schultz2004). In bovine, this pattern of transcript reduction was also observed for oocyte-specific genes (Pennetier et al., Reference Pennetier, Uzbekova, Perreau, Papillier, Mermillod and Dalbies-Tran2004). The translational regulation based on polyadenylation of specific mRNAs continues after fertilization (Brevini et al., Reference Brevini, Lonergan, Cillo, Francisci, Favetta, Fair and Gandolfi2002; Alizadeh et al., Reference Alizadeh, Kageyama and Aoki2005; Sakurai et al., Reference Sakurai, Sato and Kimura2005), probably due to protein synthesis required for cleavage and further genome activation (Aoki et al., Reference Aoki, Hara and Schultz2003). After this poly(A) mRNA depletion, a four-fold increase was observed. Embryos are transcriptionally active at the first cell cycle (2-cell; Memili & First, Reference Memili and First1999) and continue throughout the second cycle (Barnes et al., Reference Barnes and Eyestone1990; Plante et al., Reference Plante, Plante, Shepherd and King1994). This increase in mRNA content may be related to genome activation (Memili & First, Reference Memili and First2000), which precedes a decrease in mRNA probably due to translation. The increase in rRNAs transcription during the third cell cycle (Jakobsen et al., Reference Jakobsen, Avery, Dieleman, Knijn, Vos and Thomsen2006) reinforces this hypothesis.
A second event of mRNA depletion was observed at the 8-cell stage. This finding is consistent with the pattern observed for gene expression of some specific transcripts including a few housekeeping genes (Robert et al., Reference Robert, McGraw, Massicotte, Pravetoni, Gandolfi and Sirard2002; Lonergan et al., Reference Lonergan, Rizos, Gutiérrez-Adán, Moreira, Pintado, de la Fuente and Boland2003; Vigneault et al., Reference Vigneault, McGraw, Massicotte and Sirard2004). Although the 8-cell embryo was shown to be transcriptionally active (Tesfaye et al., Reference Tesfaye, Ponsuksili, Wimmers, Gilles and Schellander2003; Meirelles et al., Reference Meirelles, Caetano, Watanabe, Ripamonte, Carambula, Merighe and Garcia2004), a global mRNA increase during the 8-cell stage was not detected during this study consistently with the housekeeping expression patterns published earlier (Robert et al., Reference Robert, McGraw, Massicotte, Pravetoni, Gandolfi and Sirard2002; Betegowda et al., 2006) and indicating that new transcripts are not obligatory polyadenylated. In bovine the maternal/embryonic transcript transition (MET) is expected during the fourth cell cycle (Telford et al., Reference Telford, Watson and Schultz1990) and there are many regulatory mechanisms that trigger this process (Memili & First Reference Memili and First2000). The increase in expression of some transcription factors (11 out of 15 analyzed) during the blastocyst stage (Vigneault et al., Reference Vigneault, McGraw, Massicotte and Sirard2004), is indicative that this MGA starts at the 8-cell embryo, but the considerable number of transcripts from different genes is expected to rise in the blastocyst (Sirard et al., Reference Sirard, Dufort, Vallee, Massicotte, Gravel, Reghenas, Watson, King and Robert2005). Nevertheless, we observed an increase at hatched blastocyst stage (approximately 9.1-fold increase; p < 0.001). When relative abundance differences for a specific gene transcript (GAPDH) were evaluated, a 100-fold reduction in the GAPDH expression was observed after oocyte in vitro maturation (IMV). The variation in this transcript during oocyte IVM was first reported by Robert et al. (Reference Robert, McGraw, Massicotte, Pravetoni, Gandolfi and Sirard2002), suggesting a decrease in mRNA. Other authors previously described a reduction in GAPDH mRNA after maturation (Bettegowda et al., Reference Bettegowda, Patel, Ireland and Smith2006), but the magnitude of the difference was only five-fold. The methodological approach (pooled × individual embryos) as well as the template originating from 10% of an oocyte may account for differences in the results. In one hand pooling the embryos leads to improve reaction consistence due to grater template availability. However in other hand it leads to underestimation of the intrinsic variability due to the genetic background and growth stage of the oocyte. Working with individual embryos allows estimation of variation in gene expression within groups.
Two independent reports (Robert et al., Reference Robert, McGraw, Massicotte, Pravetoni, Gandolfi and Sirard2002; Bettegowda et al., Reference Bettegowda, Patel, Ireland and Smith2006) showed no difference in GAPDH expression from the 2-cell until the 16-cell/morula stage. However, during the blastocyst stage, an increase in the levels of transcripts was observed. The first report used absolute quantification of transcripts based on a previously quantified cloned segment of the gene; the second used external reference approach (green fluorescence protein RNA) to measure variations in target genes (housekeeping). In accordance to both reports, our results showed no differences at 2-, 4- and early 8-cell embryos, but lower amounts in late 8-cell and blastocyst. In this study the increase in expression was only observed in the hatched blastocyst.
In summary, a new approach to measure relative abundance in poly(A) mRNA is presented. Monitoring cDNA amplification in a real-time PCR for mRNA absolute comparison purposes is an efficient and sensitive approach. Based on it we could perform comparisons in poly(A) mRNA abundances between oocytes of different COCs and suggest poly(A) mRNA abundance association to the immature oocyte potential to develop to the blastocyst stage. Finally we showed the variation of global poly(A) mRNA expression in oocytes and during early embryogenesis.
Acknowledgments
The author thanks Cláudia Lima Verde Leal and Bruce Murphy for helpful suggestions and critical reading of the manuscript and CAPES, FAPESP–Brazil for financial support.