



%20--%3e%3c!DOCTYPE%20svg%20PUBLIC%20'-//W3C//DTD%20SVG%201.0//EN'%20'http://www.w3.org/TR/2001/REC-SVG-20010904/DTD/svg10.dtd'%3e%3csvg%20version='1.0'%20id='Layer_1'%20xmlns='http://www.w3.org/2000/svg'%20xmlns:xlink='http://www.w3.org/1999/xlink'%20x='0px'%20y='0px'%20width='64px'%20height='64px'%20viewBox='5.5%20-3.5%2064%2064'%20enable-background='new%205.5%20-3.5%2064%2064'%20xml:space='preserve'%3e%3cg%3e%3ccircle%20fill='%23FFFFFF'%20fill-opacity='0'%20cx='37.785'%20cy='28.501'%20r='28.836'/%3e%3cpath%20fill='%23595959'%20d='M37.441-3.5c8.951,0,16.572,3.125,22.857,9.372c3.008,3.009,5.295,6.448,6.857,10.314%20c1.561,3.867,2.344,7.971,2.344,12.314c0,4.381-0.773,8.486-2.314,12.313c-1.543,3.828-3.82,7.21-6.828,10.143%20c-3.123,3.085-6.666,5.448-10.629,7.086c-3.961,1.638-8.057,2.457-12.285,2.457s-8.276-0.808-12.143-2.429%20c-3.866-1.618-7.333-3.961-10.4-7.027c-3.067-3.066-5.4-6.524-7-10.372S5.5,32.767,5.5,28.5c0-4.229,0.809-8.295,2.428-12.2%20c1.619-3.905,3.972-7.4,7.057-10.486C21.08-0.394,28.565-3.5,37.441-3.5z%20M37.557,2.272c-7.314,0-13.467,2.553-18.458,7.657%20c-2.515,2.553-4.448,5.419-5.8,8.6c-1.354,3.181-2.029,6.505-2.029,9.972c0,3.429,0.675,6.734,2.029,9.913%20c1.353,3.183,3.285,6.021,5.8,8.516c2.514,2.496,5.351,4.399,8.515,5.715c3.161,1.314,6.476,1.971,9.943,1.971%20c3.428,0,6.75-0.665,9.973-1.999c3.219-1.335,6.121-3.257,8.713-5.771c4.99-4.876,7.484-10.99,7.484-18.344%20c0-3.543-0.648-6.895-1.943-10.057c-1.293-3.162-3.18-5.98-5.654-8.458C50.984,4.844,44.795,2.272,37.557,2.272z%20M37.156,23.187%20l-4.287,2.229c-0.458-0.951-1.019-1.619-1.685-2c-0.667-0.38-1.286-0.571-1.858-0.571c-2.856,0-4.286,1.885-4.286,5.657%20c0,1.714,0.362,3.084,1.085,4.113c0.724,1.029,1.791,1.544,3.201,1.544c1.867,0,3.181-0.915,3.944-2.743l3.942,2%20c-0.838,1.563-2,2.791-3.486,3.686c-1.484,0.896-3.123,1.343-4.914,1.343c-2.857,0-5.163-0.875-6.915-2.629%20c-1.752-1.752-2.628-4.19-2.628-7.313c0-3.048,0.886-5.466,2.657-7.257c1.771-1.79,4.009-2.686,6.715-2.686%20C32.604,18.558,35.441,20.101,37.156,23.187z%20M55.613,23.187l-4.229,2.229c-0.457-0.951-1.02-1.619-1.686-2%20c-0.668-0.38-1.307-0.571-1.914-0.571c-2.857,0-4.287,1.885-4.287,5.657c0,1.714,0.363,3.084,1.086,4.113%20c0.723,1.029,1.789,1.544,3.201,1.544c1.865,0,3.18-0.915,3.941-2.743l4,2c-0.875,1.563-2.057,2.791-3.541,3.686%20c-1.486,0.896-3.105,1.343-4.857,1.343c-2.896,0-5.209-0.875-6.941-2.629c-1.736-1.752-2.602-4.19-2.602-7.313%20c0-3.048,0.885-5.466,2.658-7.257c1.77-1.79,4.008-2.686,6.713-2.686C51.117,18.558,53.938,20.101,55.613,23.187z'/%3e%3c/g%3e%3c/svg%3e)
%20--%3e%3c!DOCTYPE%20svg%20PUBLIC%20'-//W3C//DTD%20SVG%201.0//EN'%20'http://www.w3.org/TR/2001/REC-SVG-20010904/DTD/svg10.dtd'%3e%3csvg%20version='1.0'%20id='Layer_1'%20xmlns='http://www.w3.org/2000/svg'%20xmlns:xlink='http://www.w3.org/1999/xlink'%20x='0px'%20y='0px'%20width='64px'%20height='64px'%20viewBox='5.5%20-3.5%2064%2064'%20enable-background='new%205.5%20-3.5%2064%2064'%20xml:space='preserve'%3e%3cg%3e%3ccircle%20fill='%23FFFFFF'%20fill-opacity='0'%20cx='37.637'%20cy='28.806'%20r='28.276'/%3e%3cg%3e%3cpath%20fill='%23595959'%20d='M37.443-3.5c8.988,0,16.57,3.085,22.742,9.257C66.393,11.967,69.5,19.548,69.5,28.5c0,8.991-3.049,16.476-9.145,22.456%20C53.879,57.319,46.242,60.5,37.443,60.5c-8.649,0-16.153-3.144-22.514-9.43C8.644,44.784,5.5,37.262,5.5,28.5%20c0-8.761,3.144-16.342,9.429-22.742C21.101-0.415,28.604-3.5,37.443-3.5z%20M37.557,2.272c-7.276,0-13.428,2.553-18.457,7.657%20c-5.22,5.334-7.829,11.525-7.829,18.572c0,7.086,2.59,13.22,7.77,18.398c5.181,5.182,11.352,7.771,18.514,7.771%20c7.123,0,13.334-2.607,18.629-7.828c5.029-4.838,7.543-10.952,7.543-18.343c0-7.276-2.553-13.465-7.656-18.571%20C50.967,4.824,44.795,2.272,37.557,2.272z%20M46.129,20.557v13.085h-3.656v15.542h-9.944V33.643h-3.656V20.557%20c0-0.572,0.2-1.057,0.599-1.457c0.401-0.399,0.887-0.6,1.457-0.6h13.144c0.533,0,1.01,0.2,1.428,0.6%20C45.918,19.5,46.129,19.986,46.129,20.557z%20M33.042,12.329c0-3.008,1.485-4.514,4.458-4.514s4.457,1.504,4.457,4.514%20c0,2.971-1.486,4.457-4.457,4.457S33.042,15.3,33.042,12.329z'/%3e%3c/g%3e%3c/g%3e%3c/svg%3e)
1. Introduction
Coherent vortical structures are ubiquitous in nature. In the planetary context, the flows are predominantly two dimensional due to the strong influence of rotation. These turbulent flows naturally evolve into long-lived isolated eddies/vortices (McWilliams Reference McWilliams1984), like in oceans and planetary atmospheres – for example, the Great Red Spot on Jupiter, tropical cyclones and Gulf Stream rings. The inverse cascade of energy and planetary rotation plays a prominent role in forming these coherent vortices (Vallis Reference Vallis2017). The two-dimensional (2-D) turbulent flows in a rotating background will eventually self-organize into concentrated vortical lumps as observed in various simulations and observations (Fornberg Reference Fornberg1977; Basdevant et al. Reference Basdevant, Legras, Sadourny and Béland1981; Babiano et al. Reference Babiano, Basdevant, Legras and Sadourny1987; Benzi, Patarnello & Santangelo Reference Benzi, Patarnello and Santangelo1988). In three-dimensional turbulent flows as well, the formation of vortical filaments has been similarly identified (Siggia Reference Siggia1981; Vincent & Meneguzzi Reference Vincent and Meneguzzi1991; Bartello, Métais & Lesieur Reference Bartello, Métais and Lesieur1994). Thus, the later evolution of turbulent flows is strongly influenced by the underlying vorticity dynamics of these coherent eddies.
Turbulent flows in geophysical and astrophysical contexts are often dispersed with particulate matter – water droplets and ice crystals in clouds (Shaw Reference Shaw2003), pyroclastic flows (Dufek Reference Dufek2016), wind–sand interactions in aeolian processes (Kok et al. Reference Kok, Parteli, Michaels and Karam2012) and dust in protoplanetary disks (Armitage Reference Armitage2020). The coherent vortices embedded in these flows greatly influence particle transport. Tracer particles can get trapped by the vortices for a long time, much larger than the eddy turnover time, and get transported across the distances over which the eddy travels (Elhmaïdi, Provenzale & Babiano Reference Elhmaïdi, Provenzale and Babiano1993). The trapped particles can be released only after the disruption of the vortex itself. However, the particulate matter does not necessarily have negligible inertia; the finite inertia aspect of particles can make the dynamics of the suspended phase more complex with aspects of clustering (Bec Reference Bec2003, Reference Bec2005; Sapsis & Haller Reference Sapsis and Haller2010) and caustics (Crisanti et al. Reference Crisanti, Falcioni, Provenzale, Tanga and Vulpiani1992; Falkovich, Fouxon & Stepanov Reference Falkovich, Fouxon and Stepanov2002; Wilkinson & Mehlig Reference Wilkinson and Mehlig2005). Heavy inertial particles are centrifuged away by the vortex cores and get accumulated in the straining regions of the flow (Maxey Reference Maxey1987). However, in a rotating background, the heavy inertial particles get pushed by the Coriolis force into the cores of anticyclonic vortices, which is hypothesized to trigger the formation of planetesimals in the astrophysical context (Barge & Sommeria Reference Barge and Sommeria1995; Tanga et al. Reference Tanga, Babiano, Dubrulle and Provenzale1996; Chavanis Reference Chavanis2000).
The transport of particles by various vortical structures has been extensively modelled and studied in the past few decades. Batchelor & Nitsche (Reference Batchelor and Nitsche1994) investigated the expulsion of heavy inertial particles from a rising bubble, considering the combined effects of gravitational sedimentation and the toroidal circulation of gas inside. Marcu, Meiburg & Newton (Reference Marcu, Meiburg and Newton1995) explored the transport of inertial particles near a Burger's vortex with and without the influence of gravity. In the absence of gravity, particles with sufficiently small inertia were captured by the vortex centre, while those with large inertia exhibited stable limit cycle dynamics. The inclusion of gravity altered the dynamics, generating additional fixed points that could capture the particles. Raju & Meiburg (Reference Raju and Meiburg1997) have studied the transport of inertial particles with varying density ratios in three model flows: a solid-body vortex, a point vortex and a stagnation point flow. Eames & Gilbertson (Reference Eames and Gilbertson2004) considered the sedimentation and dispersion of inertial particles past an isolated spherical vortex and a random distribution of spherical vortices, revealing that the interplay between particle inertia and stagnation points significantly increased the vertical dispersivity of dense particles compared with tracers. Hunt et al. (Reference Hunt, Delfos, Eames and Perkins2007) investigated inertial particle transport near a vortex tube and steadily propagating vortex rings, providing analytical treatment and experimental comparisons. The clustering of heavy inertial particles in a pair of co-rotating vortices was explored by Angilella (Reference Angilella2010); Ravichandran, Perlekar & Govindarajan (Reference Ravichandran, Perlekar and Govindarajan2014). Ravichandran & Govindarajan (Reference Ravichandran and Govindarajan2015) have studied the clustering of inertial particles and the subsequent emergence of caustics in a point vortex and a system of point vortices. In the context of airborne pathogen transport through the atmosphere, recent studies by Dagan (Reference Dagan2021) and Avni & Dagan (Reference Avni and Dagan2022) have modelled evaporating droplets as advected by a Lamb–Chaplygin vortex dipole, revealing that the interaction with the vortex enhanced droplets’ settling time and transported them over large distances in the air. Motivated by the dispersion of droplets in warm cumulus clouds during the condensational phase, Nath et al. (Reference Nath, Roy, Govindarajan and Ravichandran2022) investigated the dispersion of condensing droplets in a background flow modelled as an array of Taylor–Green vortices; they demonstrated a significant enhancement in droplet dispersion as they acquire more inertia by condensation.
Neighbouring coherent vortices in a turbulent flow can interact with each other and induce shearing, which could disrupt them (Legras, Dritschel & Caillol Reference Legras, Dritschel and Caillol2001). According to Reinaud, Dritschel & Koudella (Reference Reinaud, Dritschel and Koudella2003), vortices that can withstand the highest levels of strain are those most likely to be found in an actual turbulent flow. An elliptic vortex patch of constant vorticity is an exact solution of the incompressible 2-D Euler equation (see Kirchhoff Reference Kirchhoff1876; Lamb Reference Lamb1945; Saffman Reference Saffman1995); below aspect ratio of 3 the vortices are both linearly (Love Reference Love1893) and nonlinearly (Wan Reference Wan1986; Tang Reference Tang1987) stable. Elliptic vortex patches and their interactions have been extensively studied to understand better the stability and evolution of vortices in ideal fluid (see Moore & Saffman Reference Moore and Saffman1971; Kida Reference Kida1981; Dritschel Reference Dritschel1990; Legras & Dritschel Reference Legras and Dritschel1991; Dritschel & JuáRez Reference Dritschel and JuáRez1996; Mitchell & Rossi Reference Mitchell and Rossi2008), with motivations from geophysical turbulent flows (Dritschel Reference Dritschel1995). Due to the non-axisymmetric vorticity distribution, an elliptic patch of uniform vorticity in an irrotational background will rotate with a constant angular velocity while preserving its size and shape. This configuration, widely known as the Kirchhoff vortex, is well suited for studying isolated non-axisymmetric coherent vortices in 2-D flows. The tracer transport in the Kirchhoff vortex is non-chaotic as it is an integrable Hamiltonian system.
To study vortex interactions, Kida (Reference Kida1981) proposed a model of a vortex tube in a uniform shear flow; the effects of the other vortices on a certain vortex tube may be replaced, in the first approximation, by a linear flow. Moore & Saffman (Reference Moore and Saffman1971) had earlier studied steady elliptic vortex patches in uniform shear; Kida (Reference Kida1981) generalized the solutions to include exact unsteady elliptic vortices. However, we would like to mention that the first study of an elliptic vortex in a specific linear flow, a simple shear flow, was carried out by Chaplygin (see Chaplygin Reference Chaplygin1899; Meleshko & Van Heijst Reference Meleshko and Van Heijst1994). When an external simple shear flow is superimposed on the Kirchhoff vortex, the configuration is known to have three kinds of impact on the elliptic vortex patch: (i) rotation: full rotation of the ellipse with periodically changing aspect ratio and angular velocity, (ii) nutation: back and forth oscillatory angular motion of the elliptic patch, and (iii) elongation: irreversible elongation of the vortex patch due to strong external straining (see Kida Reference Kida1981; Neu Reference Neu1984; Dritschel Reference Dritschel1990). Though the area of the ellipse is preserved, the unsteady rotation of the ellipse with changing aspect ratio creates an unsteady flow field around, even in the co-rotating frame (Kida Reference Kida1981), which is referred to as the ‘Kida vortex’ in this paper. The original motivation for studying sheared vortical patches was to understand vortex interactions better. However, when analysed from the perspective of tracer transport, sheared elliptic vortices exhibited chaotic Lagrangian trajectories (Polvani & Wisdom Reference Polvani and Wisdom1990; Dahleh Reference Dahleh1992). Even a minor imposed shear induces periodic unsteadiness in the deformation of the Kida vortex, disrupting the Hamiltonian integrability of the Kirchhoff vortex. The hyperbolic fixed points and heteroclinic connections of the Kirchhoff vortex (see § 2) experience perturbations, making them susceptible to transverse intersections and, thus, allow for the possibility of chaotic dynamics (Smale Reference Smale1967; Bertozzi Reference Bertozzi1987). A comprehensive investigation was conducted into the impact of unsteady perturbations on tracer transport in an otherwise integrable system of a pair of oppositely signed point vortices by Rom-Kedar, Leonard & Wiggins (Reference Rom-Kedar, Leonard and Wiggins1990). In the absence of perturbation, the vortex pair translates with a constant velocity, resulting in a steady flow field in the co-moving frame with the vortices. However, the introduction of an external periodic strain field, even in the co-moving frame, makes the flow field unsteady, causing the tangling heteroclinic orbits in the flow field and leading to the chaotic transport of certain passive tracers. This phenomenon also results in fluid entrainment by the vortex system, enhancing mixing. Notably, this study represents one of the early applications of tools such as the Melnikov analysis from dynamical systems to analyse and quantify chaos and mixing in a fluid flow problem. In the current context of inertial particle transport in the Kida vortex, we apply some of the techniques derived from their work.
The dispersed phase embedded in the coherent structures in the various geophysical and astrophysical flows is rarely inertialess – dust, bubbles, planktons. This raises the question of how particle inertia alters particle dispersion in the neighbourhood of vortices. Here, we are interested in the dynamics of small, heavy inertial particles, thus ignoring the additional physics of added mass effects, the Basset history term, convective inertia and Faxen corrections. Studies have shown that particle inertia can suppress the chaotic transport in vortical flows (Angilella Reference Angilella2010; Angilella, Vilela & Motter Reference Angilella, Vilela and Motter2014). However, we have demonstrated recently (Nath et al. Reference Nath, Roy, Ravichandran and Govindarajan2024b) that particle inertia can induce chaotic dynamics and lead to non-ergodic dynamics due to the ‘scattering’ interaction of inertial particles with an ordered array of stagnation points. Particle inertia modifies the fluid tracer fixed points and their homoclinic/heteroclinic connections, which subsequently play a prominent role in long-time particle transport. In this paper we study the transport of heavy inertial particles near a non-axisymmetric vortex patch – first in the Kirchhoff vortex and then in its strained variant, the Kida vortex. The configuration chosen is a simple scenario of an isolated vortex where we can study the modification of the heteroclinic tangles by particle inertia analytically and comment on the competing roles of background shear and particle inertia to promote or suppress chaotic transport.
An earlier investigation on particle transport in a strained elliptical vortex is documented in the work by Chavanis (Reference Chavanis2000). This study specifically focuses on the trapping of dust by anticyclonic vortices in Keplerian protoplanetary disks, proposing it as a mechanism for planet formation. In this context, the vortices experience Keplerian shear, leading to the survival of only anticyclonic vortices that achieve a steady elliptic configuration. The strength of the vorticity is determined by Keplerian shear, employing a solution provided by Moore & Saffman (Reference Moore and Saffman1971). The analysis of inertial dust particle transport is conducted in a frame co-rotating with the vortex. The findings indicate that particles with small inertia approximately follow an elliptic path, drifting inwards due to drag and the Coriolis force, ultimately being captured by the vortex centre. On the other hand, particles with larger inertia exhibit an epicyclic motion but eventually sink into the vortex. Particles with substantial inertia may even escape the vortex. Despite some apparent similarities with the second part of our work, which involves the transport of inertial particles by a strained elliptic vortex, there are notable differences. Our study considers an elliptic vortex model for a coherent vortex in turbulence, allowing for any general value of the strain rate it experiences. Consequently, the vortex is not in a steady state but unsteady motion, leading to the intriguing particle dynamics discussed in this paper.
The remainder of this paper is organized as follows. Section 2 provides an overview of the dynamics of heavy inertial particles in the Kirchhoff vortex, detailing their clustering in various fixed points and presenting a stability analysis of these fixed points. In § 3 we primarily focus on the modification of these dynamics in a strained Kirchhoff vortex due to an imposed weak pure-strain flow, i.e. in a rotating Kida vortex. We analyse the perturbative changes from stable fixed points to stable limit cycles. Additionally, a Melnikov analysis is employed on saddle points to demonstrate the existence of chaotic dynamics for inertial particles with sufficiently small inertia. Large-time Lyapunov exponents and fractal dimension calculations are used to confirm the presence of chaotic dynamics. A small discussion on the inertial particle dynamics in nutating and elongating Kida vortices is added at the end of § 3. The large-time dispersion characteristics of heavy inertial particles in Kirchhoff and Kida vortices are discussed in § 4. Additionally, the trapping of particles around a Kida vortex is studied by evaluating their residence time in the neighbourhood of the vortex.
2. Dynamics of heavy inertial particles in an elliptic vortex
2.1. An isolated elliptic patch of uniform vorticity – the Kirchhoff vortex
Consider an elliptical patch of constant vorticity ( $\omega _0$) in an irrotational background. As mentioned earlier, due to the non-axisymmetric vorticity distribution, the elliptic patch of uniform vorticity (
 $\omega _0$) will rotate with constant angular velocity
 $\varOmega = \omega _0 a b/(a+b)^2$, where
 $a$ and
 $b$ are semi-major and semi-minor axes of the elliptic patch (see figure 1); the size and shape of the elliptic patch is preserved during the rotation. The configuration, known as the Kirchhoff vortex, is given by the streamfunction (as observed by a stationary observer)
 \begin{equation}
\psi_v'= \left\{ \begin{array}{@{}l@{\quad}l@{}} -\dfrac{\omega_0}{2
(a+b)} (b x^2 +a y^2), & \dfrac{x^2}{a^2}+\dfrac{y^2}{b^2}
< 1,\\ -\dfrac{a b \omega_0}{4} \left(2 \xi + {\rm e}^{{-}2
\xi}\cos(2 \eta) \right), &
\dfrac{x^2}{a^2}+\dfrac{y^2}{b^2} > 1. \end{array} \right.
\end{equation}
(a) Schematic showing the elliptic vortex patch with stationary reference frame  $X'\unicode{x2013}Y'$ and the co-rotating reference frame
 $X\unicode{x2013}Y$. (b) The (steady) streamlines of the Kirchhoff vortex in the co-rotating reference frame.

In the co-rotating frame with the vortex, the streamfunction is  $\psi = \psi '+({\varOmega }/{2}) (x^2+y^2)$, where
 $(x,y)$ and
 $(\xi,\eta )$ are respectively the Cartesian and elliptic coordinates measured in a co-rotating frame with the ellipse, which are inter-related as
 $x = \sqrt {a^2-b^2}\cosh \xi \cos \eta$ and
 $y = \sqrt {a^2-b^2}\sinh \xi \sin \eta$, with
 $\xi \geq 0$ and
 $\eta \in [0,2{\rm \pi} )$. We use primed (
 $'$) variables to denote quantities in the stationary frame, whereas unprimed variables represent quantities in the co-rotating frame. We follow the same convention throughout this paper unless specified otherwise. The stationary reference frame (
 $X'\unicode{x2013}Y'$) and the co-rotating reference frame (
 $X\unicode{x2013}Y$) are shown schematically in figure 1(a), making an instantaneous angle
 $\theta$, relates them as
 $x' = x\cos \theta - y \sin \theta$ and
 $y' = x \sin \theta + y \cos \theta$, where
 ${{\rm d} \theta }/{{\rm d} t} = \varOmega$. An advantage of choosing a co-rotating frame is that the velocity field is steady in the co-rotating frame. The corresponding streamlines are shown in figure 1(b). The tracer dynamics in the co-rotating frame is thus governed by a 2-D, time-independent dynamical system, which guarantees non-chaotic fluid pathlines. Inside the ellipse, the flow field is a solid-body rotation, and far away in the outer region, it resembles a decaying point vortex. The flow field is a tripole structure (see Viúdez Reference Viúdez2021; Xu & Krasny Reference Xu and Krasny2023) with five fixed points (where the flow velocity is zero) A, B, C, D and O, as marked in the figure. The origin O (
 $\bar {\xi }_0$,
 $\bar {\eta }_0$) is an elliptic fixed point; the pair A and B (
 $\bar {\xi }_1^{\pm }$,
 $\bar {\eta }_1^{\pm }$) located along the major axis line outside the ellipse are hyperbolic type fixed points; the pair C and D (
 $\bar {\xi }_2^{\pm }$,
 $\bar {\eta }_2^{\pm }$) located along the minor axis line outside the ellipse (inside the lobes) are elliptic type fixed points (see Kawakami & Funakoshi Reference Kawakami and Funakoshi1999). The hyperbolic fixed points are interconnected by two pairs of heteroclinic orbits, denoted as
 $H_1^{\pm }$ and
 $H_2^{\pm }$. As we proceed further into our analysis, we will learn the significance of these heteroclinic orbits and their possible perturbation, which is crucial for the onset of chaos, in § 3. The fixed points are ‘fixed points’ only for a co-rotating observer; however, for a stationary observer, they resemble ‘Lagrange points’ of celestial mechanics (Fitzpatrick Reference Fitzpatrick2012).
2.2. Dynamics of inertial particles
The dynamics of heavy inertial point particles in a background flow can be studied using the Maxey–Riley equation (see Maxey & Riley Reference Maxey and Riley1983). In a rotating reference frame with the ellipse (of angular velocity  $\varOmega$), the modified form of the Maxey–Riley equation by accounting for the pseudo forces reads, in non-dimensional form,
 \begin{equation} \dot{\boldsymbol{v}} = \frac{\boldsymbol{u}(\boldsymbol{x})-\boldsymbol{v}}{St}+\boldsymbol{x} \varOmega^2 - 2 \varOmega \hat{\boldsymbol{e}}_z\times \boldsymbol{v}, \end{equation}
where  $\boldsymbol {v}$ is the particle velocity,
 $\boldsymbol {u}(\boldsymbol {x})$ is the velocity of the Kirchhoff vortex (steady, in the co-rotating frame) evaluated at the particle location
 $\boldsymbol {x}$,
 $\hat {\boldsymbol {e}}_z$ is the unit vector along the
 $z$ axis perpendicular to the plane. We use the length scale
 $\sqrt {a b}$ and the rotation time scale
 $\omega _0^{-1}$ to non-dimensionalize the system, where, as mentioned earlier,
 $a$ and
 $b$ are the semi-major and semi-minor axes of the ellipse, respectively, and
 $\omega _0$ is the uniform vorticity of the elliptical patch. Another relevant time scale in the problem is
 $\tau _p=(2/9) \rho_p a^2/(\rho_g \nu)$ – the relaxation time scale for a particle of characteristic size
 $a$ and density
 $\rho _p$ navigating in a carrier phase of density
 $\rho _g$ and kinematic viscosity
 $\nu$. The Stokes number (
 $St = \tau _p \omega _0$) quantifies the relative magnitude of the two time scales and, thus, provides a non-dimensional measure of particle inertia. We denote the non-dimensional time derivative using an overdot (
 $\,\dot {~}\,$). The non-dimensional quantities are represented with the same notation as dimensional quantities, as we deal only with non-dimensional quantities from here onwards (unless specified explicitly). The elliptic vortex is characterized by the non-dimensional aspect ratio
 $r = b/a$, where we consider
 $0 < r < 1$.
The first term on the right-hand side of (2.2) is the Stokes drag, the second is the centrifugal force and the third is the Coriolis force. The Euler force ( $-\dot {\varOmega } \hat {\boldsymbol {e}}_z \times \boldsymbol {x}$) – a fictitious tangential force that arises in a rotating reference frame – does not appear here because the rotation rate is uniform (i.e.
 $\dot {\varOmega } = 0$). However, we will see later, in the context of the Kida vortex, the Euler force needs to be accounted for due to its non-uniform rotation rate. It is assumed that the particles are point size and, thus, in a Stokes flow limit (
 $Re=\varOmega a^2/\nu \ll 1$). Also, we are dealing with heavy particles (i.e. much denser than the background fluid (
 $\rho _p \gg \rho _g$), as is the case for dust particles or water droplets in the air). Thus, as was mentioned earlier, the physics of added mass force and the Basset history effect is negligible. However, suppose one were to study the role of fluid inertia with the motivation of the current study and explore the long-time dispersion dynamics of particles in the vicinity of coherent structures. In that case, the inclusion of convective inertia (
 $Re \neq 0$) is expected to play a more prominent role than the Basset history effect (see Lovalenti & Brady Reference Lovalenti and Brady1993; Dorgan & Loth Reference Dorgan and Loth2007). However, for the sake of simplicity, we restrict ourselves to the
 $Re\ll 1$ regime and ignore the physics of both unsteady and convective inertia. In addition, for the same reason of
 $\rho _p \gg \rho _g$, the indirect effects of the Coriolis and centrifugal forces acting on the fluid, which induces corrections into the particle equation, have been neglected in (2.2).
In our study, we initialize a circular patch of inertial particles (randomly distributed) with zero initial velocity in the Kirchhoff vortex around the ellipse (see figure 2a). We let the particles evolve and track them using the dynamic (2.2) along with the kinematic equation  $\dot {\boldsymbol {x}} = \boldsymbol {v}$. We integrate the system using the ODE113 routine in Matlab with a relative error of
 $10^{-12}$, absolute error of
 $10^{-12}$ and a maximum time step of
 $1/10$ th of the Stokes number. The typical evolution of
 $St = 0.5$ particles in the Kirchhoff vortex of aspect ratio
 $r = 0.5$ observed from the co-rotating frame is shown as the snapshots in figure 2.
Snapshots showing the evolution of  $10^5$ particles of
 $St = 0.5$ in a Kirchhoff vortex of
 $r = 0.5$ at (a)
 $t = 0$, (b)
 $t = 50$, (c)
 $t = 100$ and (d)
 $t = 150$ non-dimensional time units, obtained from numerical simulation. The particles are initialized with zero velocity and randomly distributed inside a circle of non-dimensional radius
 $1.76$, enclosing the ellipse.

As expected, the snapshots show that the inertial particles are getting centrifuged away from the central ellipse. However, unlike in the case of an axisymmetric vortex (like the point vortex or Rankine vortex), here we see that some of the particles are getting attracted towards a pair of fixed points outside the ellipse, within each lobe denoted as C and D. Note that, the elliptic fixed points of fluid tracers in the Kirchhoff vortex have already been denoted as C and D in figure 1(b). The same choice of notation here for attracting fixed points will make sense in the analytical exploration of the system in the upcoming section.
2.3. Analytical evaluation of fixed points and their stability
The fixed points, as seen by an inertial particle in the Kirchhoff vortex, can be evaluated by setting its velocity and acceleration to be zero, i.e.  $\boldsymbol {v} = \dot {\boldsymbol {v}} = \boldsymbol {0}$. Substituting this in (2.2) gives that the locations of the fixed points are the solution of the equation
 $\boldsymbol {u}(\boldsymbol {x})+\boldsymbol {x} St \varOmega ^2 = \boldsymbol {0}$, i.e. the fixed points are formed by the balance between centrifugal force and Stokes drag. Note that the fixed point equation is modified from that of fluid tracers (
 $\boldsymbol {u}(\boldsymbol {x}) = 0$) due to the finite inertia effect as a
 $St$ dependent term. For analytical treatment to be made accessible, we may choose to rewrite (2.2) in elliptic coordinates, in component form, as
 $$\begin{gather} \ddot{\xi}=\frac{h k^{{-}1} u_\xi-\dot{\xi}}{St}+2 \varOmega \dot{\eta}+h^2 \left\{\frac{\dot{\eta}^2-\dot{\xi}^2+\varOmega^2}{2}\sinh 2\xi-\dot{\eta} \dot{\xi}\sin 2\eta \right\}, \end{gather}$$
 $$\begin{gather}\ddot{\eta}=\frac{h k^{{-}1} u_\eta-\dot{\eta}}{St}-2 \varOmega \dot{\xi}-h^2 \left\{\frac{\dot{\eta}^2-\dot{\xi}^2+\varOmega^2}{2}\sin 2\eta+\dot{\eta} \dot{\xi}\sinh 2\xi\right\}, \end{gather}$$
where  $x = k\cosh \xi \cos \eta$ and
 $y = k\sinh \xi \sin \eta$, and the fluid velocity components can be obtained from the corresponding streamfunction in the co-rotating frame (
 $\psi$) as
 $u_\xi = ({h}/{k}) ({\partial \psi }/{\partial \eta })$ and
 $u_\eta = -({h}/{k}) ({\partial \psi }/{\partial \xi })$. For the Kirchhoff vortex (of streamfunction
 $\psi _v = \psi _v'+({\varOmega }/{2}) (x^2+y^2)$), these components can be evaluated as
 \begin{gather} u_{\xi} = \left\{ \begin{array}{@{}l@{\quad}l@{}} \dfrac{h}{2 k} \left({\rm e}^{{-}2\xi}-k^2 \varOmega \right)\sin 2\eta, & \tanh \xi > r,\\ \dfrac{h}{4} k^3 \varOmega (\varLambda-\cosh 2\xi)\sin 2\eta, & \tanh \xi < r, \end{array} \right. \end{gather}
 \begin{gather}u_{\eta} = \left\{ \begin{array}{@{}l@{\quad}l@{}} \dfrac{h}{2 k} \left(1-{\rm e}^{{-}2\xi}\cos 2\eta-k^2 \varOmega \sinh 2\xi\right), & \tanh \xi > r,\\ \dfrac{h}{4} k^3 \varOmega (\varLambda-\cos 2\eta)\sinh 2\xi, & \tanh \xi < r, \end{array} \right. \end{gather}
where the scale factor  $h = (\cosh ^2\xi -\cos ^2\eta )^{-1/2}$, the parameters
 $k^2 = (1/r-r)$,
 $\varLambda = (1+r^2)/(1-r^2)$ and the angular velocity
 $\varOmega = \dot {\theta } = r/(r+1)^2$. Here,
 $\tanh \xi > r$ indicates the region outside the ellipse and
 $\tanh \xi < r$ indicates the region inside the ellipse since
 $\tanh \xi = r$ defines the boundary of the ellipse itself. The same equations in Cartesian coordinates are convenient in numerical simulations and can be found in Appendix A.
The system of equations (2.3), along with the appropriate velocity field, describes the trajectory of an inertial particle in an elliptic vortex. It is a nonlinear coupled dynamical system in a four-dimensional phase space on the variables  $\xi,\eta,\dot {\xi }$ and
 $\dot {\eta }$. The fixed points of the system can be obtained by solving the equations
 $\dot {\xi }=0$,
 $\dot {\eta }=0$,
 $\ddot {\xi } = 0$ and
 $\ddot {\eta }=0$ simultaneously. From (2.3), this gives the trivial criteria for all fixed points, i.e.
 $\dot {\bar {\xi }} = \dot {\bar {\eta }} = 0$; however, their locations
 $(\bar {\xi },\bar {\eta })$ should be obtained by solving the transcendental equations
 \begin{align} 2 u_\xi + St\, h k \varOmega^2\sinh 2\xi &= 0, \end{align}
 \begin{align}2 u_\eta-St\, h k \varOmega^2\sin 2\eta &= 0. \end{align}
These equations must be solved separately inside and outside the ellipse to identify the fixed points since the velocity field is known in a piecewise manner. The identification of fixed points and their stability analysis are discussed in the following §§ 2.3.1 and 2.3.2. Note that setting  $St = 0$ should recover the dynamics of the passive fluid tracers. By doing so, one could see that the equations (2.5) for the fixed points reduce to
 $u_\xi = 0$ and
 $u_\eta = 0$ – which will retrieve the five classical fixed points of the Kirchhoff vortex mentioned in § 2.1.
2.3.1. Fixed points outside the ellipse
Outside the ellipse ( $\tanh \xi > r$), (2.5) can be written by substituting the appropriate velocity expressions from (2.4) as
 \begin{gather} (St \varOmega^2\sinh 2\xi+(k^{{-}2}\, {\rm e}^{{-}2\xi}-\varOmega)\sin 2\eta) h^2 = 0, \end{gather}
 \begin{gather}(St \varOmega^2\sin 2\eta+\varOmega\sinh 2\xi+k^{{-}2}\, ({\rm e}^{{-}2\xi}\cos 2\eta-1)) h^2 = 0. \end{gather}
These are modified equations for fixed points outside the elliptic vortex accounting for the effect of finite  $St$. The solutions to (2.6) give the fixed points (
 $\bar {\xi },\bar {\eta }$) with
 $p = \tanh \bar {\xi }$ and
 $q = \tan \bar {\eta }$ given by
 \begin{gather} p^{{\pm}} = \frac{2-(\alpha \pm \beta) k^2 \varOmega^2}{2(1+k^2 \varOmega)}, \end{gather}
 \begin{gather}q^{{\pm}} = \frac{\alpha \mp \beta}{2\, St}, \end{gather}
where  $\alpha = k^2 (1+St^2 \varOmega ^2)$ and
 $\beta = \sqrt {\alpha ^2-4 St^2}$. These solutions form a set of four fixed points outside the ellipse, located at
 $(\bar {\xi }_1^{+}, \bar {\eta }_1^{+}) =(\tanh ^{-1}p^+,\tan ^{-1}q^+)$,
 $(\bar {\xi }_1^{-}, \bar {\eta }_1^{-}) =(\tanh ^{-1}p^+,-{\rm \pi} +\tan ^{-1}q^+)$,
 $(\bar {\xi }_2^{+}, \bar {\eta }_2^{+}) = (\tanh ^{-1}p^-,\tan ^{-1}q^-)$ and
 $(\bar {\xi }_2^{-}, \bar {\eta }_2^{-}) =(\tanh ^{-1}$
 $p^-,-{\rm \pi} +\tan ^{-1}q^-)$. In the limit of
 $St \rightarrow 0$, we may deduce that these fixed points coincide with the Kirchhoff vortex's four classical fixed points A, B, C and D. For simplicity, we choose to call these finite
 $St$ modified fixed points with the same name as that corresponding to the fluid tracers (A, B, C and D). The finite
 $St$ symmetrically displaces these fixed points, as shown in figure 3(a): A and B shift counterclockwise, while C and D shift clockwise as
 $St$ increases. As
 $St$ increases, the fixed points A(
 $\bar {\xi }_1^{+}$,
 $\bar {\eta }_1^{+}$) and C(
 $\bar {\xi }_2^{+}$,
 $\bar {\eta }_2^{+}$) approach each other. The same thing happens for the counterpart fixed points B(
 $\bar {\xi }_1^{-}$,
 $\bar {\eta }_1^{-}$) and D(
 $\bar {\xi }_2^{-}$,
 $\bar {\eta }_2^{-}$) as well.
(a) Variation of the fixed points perceived by inertial particles in a Kirchhoff vortex of  $r=0.5$ as
 $St$ changes (for log-spaced distribution of
 $St$). Elliptic and hyperbolic fixed points outside the ellipse merge at
 $St \approx 0.772$. (b) The trajectories of
 $St = 0.2$ particles in a Kirchhoff of
 $r = 0.5$ in the co-rotating reference frame, obtained using slow manifold expression. Red indicates unstable fixed points and blue indicates stable fixed points.

In the limit of a small Stokes number ( $St \ll 1$), the governing equation (2.2) can be reduced to the slow manifold form as
 \begin{equation} \boldsymbol{v} = \boldsymbol{u}-St \left\{\frac{\partial \boldsymbol{u}}{\partial t}+\boldsymbol{u} \boldsymbol{\cdot} \boldsymbol{\nabla}\boldsymbol{u} - \boldsymbol{x} \varOmega^2 + 2 \varOmega\hat{\boldsymbol{e}}_z \times \boldsymbol{u}\right\}+\textit{O}(St^2), \end{equation}
using which the particle trajectories are obtained and shown in the figure 3(b). By comparing these particle trajectories with the streamlines for fluid tracers shown in figure 1(b), it is evident that the inertial particles perceive different fixed points than fluid tracers. They match exactly with the solution of (2.6) we obtained analytically (as marked in blue and red). The trajectories also imply that the fixed points A and B remain hyperbolic fixed points (saddles); however, the fixed points C and D behave as stable spirals for inertial particles. The divergence of the system (2.2) in the four-dimensional phase space is given by  $\boldsymbol {\nabla } \boldsymbol {\cdot } \boldsymbol {v}+\boldsymbol {\nabla }_{\boldsymbol {v}} \boldsymbol {\cdot } \dot {\boldsymbol {v}} = -2/St$, a negative quantity, indicating the dissipative nature of the dynamical system for any finite inertia particles. Here,
 $\boldsymbol {\nabla } \boldsymbol {\cdot } (\ )$ represents the divergence in physical space, while
 $\boldsymbol {\nabla }_{\boldsymbol {v}} \boldsymbol {\cdot } ()$ represents the divergence in velocity/momentum space. Even in the
 $St \ll 1$ limit, the divergence of the reduced system (2.8) in the 2-D phase space yields
 $\boldsymbol {\nabla } \boldsymbol {\cdot } \boldsymbol {v} =\textit {O}(St) \neq 0$, indicating a compressible nature of inertial particle flow in phase space unlike the fluid tracers where
 $\boldsymbol {\nabla } \boldsymbol {\cdot } \boldsymbol {u} = 0$. The dissipative nature of the system for heavy, finite inertia particles is responsible for the elliptic fixed points becoming spiral attractors. However, the hyperbolic fixed points remain intact, though their position gets displaced.
To analytically show this, we use the linear stability analysis and systematically study the effect of finite  $St$ on the stability of the fixed points. The Jacobian matrix for the system of differential equations (2.3), evaluated at the fixed point (
 $\bar {\xi },\bar {\eta }$) is
 \begin{equation} \boldsymbol{\mathsf{J}} = \begin{pmatrix} 0 & 0 & 1 & 0\\ 0 & 0 & 0 & 1\\ \varGamma & -\varDelta & -\dfrac{1}{St} & 2\, \varOmega\\ \varDelta-\dfrac{2 k^{{-}2}(1-p) (p+q^2) }{St (p^2+q^2)} & \varGamma+\dfrac{2 k^{{-}2} q (1-p)^2}{St (p^2+q^2)} & -2 \varOmega & -\dfrac{1}{St} \end{pmatrix}, \end{equation}
where  $\varGamma =(p^2-1)\{\varOmega (1+q^2) (St \varOmega (p^2-q^2)-2pq)+2k^{-2}(p+q^2)q(1-p)\}/\{St (p^2+q^2)^2\}$ and
 $\varDelta = (1-p) (1+q^2) \{\varOmega (1+p)(p^2-q^2+2 p q\, St\, \varOmega )-k^{-2}(1-p) (p^2-q^2) \}/\{St (p^2+q^2)^2\}$. The same matrix evaluated in Cartesian coordinates can be found in Appendix A. By evaluating the eigenvalues for the matrix
 $\boldsymbol{\mathsf{J}}$, we can identify that the fixed point pairs A and B are saddles, and the pairs C and D are stable spirals for a finite inertia particle. For instance, the variation of all the eigenvalues with Stokes number for each fixed point type is shown in figure 4. From figure 4(a,d), it can be seen that any finite
 $St$ particle will perceive fixed points A and B with purely real-valued eigenvalues with signature
 $(+,-,-,-)$, as saddles in the four-dimensional phase space. However, for the fixed point C or D, as shown in figure 4(b,e), the eigenvalue is a pair of complex conjugates with a negative real part, indicating a stable spiral in the four-dimensional phase space. Thus, we conclude that the suspended heavy inertial particles will spiral and cluster towards the fixed points C and D outside the elliptic vortex as time progresses, which we have observed in numerical simulations (see figure 2). Note that, for the fixed point C or D, for
 $r=0.5$, when
 $St \gtrsim 0.771$ (shown in the insets of figure 4b,e), we may see that there occurs a bifurcation and the eigenvalues are no more conjugate pairs, rather purely real valued with signature
 $(-,-,-,-)$, indicating stable node/sink in the four-dimensional phase space. Consequently, the particles will radially move towards the fixed points instead of executing a spiral motion. For an elliptic vortex of arbitrary aspect ratio
 $r$, the critical Stokes number
 $\mathcal {S}_1$ at which the spiral to node transition happens can be identified from the discriminant of the solutions of the quartic eigenvalue polynomial for
 $\boldsymbol{\mathsf{J}}$ (which can be obtained from (2.9) or (A4), by setting
 $\lvert \boldsymbol{\mathsf{J}}-\lambda \, \boldsymbol{\mathsf{I}} \rvert = 0$). By examining the discriminant of the solution for
 $\lambda$, one may find its behaviour changes when
 $St^2$ satisfies the cubic equation
 $$\begin{align} &St^6+\frac{3(1+r)^4(1+4r+r^2)}{2 r^3} St^4+\frac{(1+r)^8(1+6r+r^2)(5+22r+5 r^2)}{16 r^6}St^2\nonumber\\ &\qquad-\frac{(1+r)^{12}(1-r)^2(3+r)(1+3r)}{16 r^8}=0. \end{align}$$
The real-valued, non-negative solution of (2.10) gives the critical Stokes number  $St = \mathcal {S}_1$ for any
 $r$. For the case of
 $r = 0.5$, one could verify that this solution is
 $\mathcal {S}_1 \approx 0.7713$, matching with the prediction from figure 4(b,e).
Variation of all eigenvalues with  $St$ corresponding to the typical fixed points of inertial particles in a Kirchhoff vortex of
 $r=0.5$. (a,d) Real and imaginary parts of the eigenvalues of fixed points A or B. (b,e) Real and imaginary parts of the eigenvalues of fixed point C or D. (c,f) Real and imaginary parts of the eigenvalues of fixed point O.

As  $St$ increases, saddle type and stable spiral type fixed points approach closer, as mentioned earlier. If we keep increasing
 $St$, we find that they merge (i.e.
 $p^+ = p^-$ and
 $q^+=q^-$) and vanish at a critical inertia value. From (2.7), one could deduce that this happens only if
 $\beta = 0$. Using the expression
 $\beta ^2 = k^4 (1+St^2 \varOmega ^2)^2-4 St^2$ and solving for Stokes number, one would find that the critical value at which merging happens is
 $St = \mathcal {S}_2 = (1+r)^2 (1-\sqrt {r})/(r (1+\sqrt {r}))$, i.e. the fixed points outside the elliptic vortex (A, B, C and D) exist only for particles with
 $0 \leq St < \mathcal {S}_2$. For an elliptic vortex with
 $r = 0.5$, the critical value can be evaluated as
 $\mathcal {S}_2 \approx 0.7721$, i.e. A merges with C and B merges with D at this critical value and disappears. Thus, we have only shown the eigenvalues in figure 4 for the Stokes number until
 $0.7721$.
2.3.2. Fixed points inside the ellipse
The origin O located inside the ellipse ( $\tanh \xi < r$) continues to exist as a fixed point for heavy inertial particles (see figure 3b); however, O behaves as an unstable spiral. To show this, we follow the same procedure mentioned in the previous § 2.3.1, using the flow field inside the ellipse. By substituting appropriate expressions for
 $u_{\xi }$ and
 $u_{\eta }$ from (2.4) in (2.5), we obtain
 $$\begin{gather} (2 St\, \varOmega\sinh 2\xi+k^{2}(\varLambda -\cosh 2\xi)\sin 2\eta) h^2 = 0, \end{gather}$$
 $$\begin{gather}(2 St\, \varOmega\sin 2\eta-k^2\, (\varLambda -\cos 2\eta)\sinh 2\xi) h^2 = 0. \end{gather}$$
In the  $St \rightarrow 0$ limit, these equations yield the elliptic fixed point for fluid tracers at the origin. Moreover, irrespective of the value of
 $St$, (2.11) has a single real-valued solution
 $(\bar {\xi }_0,\bar {\eta }_0) = (0,{\rm \pi} /2)$, indicating that the origin O remains to be the fixed point for any inertial particle as well. The Jacobian matrix for linear stability for the fixed point at origin O is
 \begin{equation} \boldsymbol{\mathsf{J}} = \frac{1}{St}\,\begin{pmatrix} 0 & 0 & St & 0\\ 0 & 0 & 0 & St\\ St\varOmega^2 & -r \varOmega & -1 & 2 St \varOmega\\ \varOmega/r & St \varOmega^2 & -2 St \varOmega & -1 \end{pmatrix}, \end{equation}
which has two pairs of complex conjugate eigenvalues. One of these pairs has a non-negative real part (see figure 4c,f), indicating unstable spiral behaviour for any non-zero  $St$. Thus, the particles will be centrifuged away from the origin spirally. Some of them, starting within certain basins (see § 2.5) accumulate in the stable fixed points C and D outside the ellipse, as they are stable fixed points, as shown in the previous § 2.3.1. Note that as we increase the particle inertia, even after the mutual annihilation of fixed points A, B, C and D, fixed point O exists and remains an unstable spiral. Thus, beyond the
 $\mathcal {S}_2$, one can observe that all particles merely centrifuge away without getting trapped in any Lagrange points.
The nature of fixed points and phase space topology is depicted schematically in figure 5 as the Stokes number varies. It is important to note that the phase space is four dimensional; however, the schematic only presents a three-dimensional projection. The fixed points C and D exhibit a ‘2-spiral sink’ behaviour when  $St < \mathcal {S}_1$ and transition to a ‘sink’ when
 $\mathcal {S}_1 < St < \mathcal {S}_2$. On the other hand, fixed points A and B demonstrate a ‘
 $3:1$ saddle’ behaviour for
 $St < \mathcal {S}_2$. Additionally, fixed point A (B) annihilates with C (D) and ceases to exist when
 $St = \mathcal {S}_2$. Meanwhile, fixed point O persists and behaves as a ‘2-spiral saddle’ for all Stokes numbers. For more on terminology, see Hofmann, Rieck & Sadlo (Reference Hofmann, Rieck and Sadlo2018).
A schematic showing the projection of a four-dimensional phase space topology into three dimensions, illustrating various fixed points and their transitions at critical Stokes numbers.

2.4. Effect of the aspect ratio on the distribution of fixed points
Until now, all the analyses have been performed explicitly for the elliptic vortex with aspect ratio  $r = 0.5$. However, if the vortex has a different aspect ratio, the distribution and stability nature of fixed points will change. Solving (2.6) and (2.11), we obtain the fixed points inside and outside the ellipse, respectively, for various
 $St$ and
 $r$ values. There is no qualitative change in the distribution of fixed points, such that the fixed point inside the ellipse will always be at the origin, and there will always be four fixed points outside the ellipse below Stokes number
 $\mathcal {S}_2$. In the
 $r \unicode{x2013} St$ plane (see figure 6), it is shown that the critical curve (blue colour) demarcates the region where all five fixed points (A, B, C, D and O) coexist and the region where only the point at the origin exists.
The curves in the  $r\unicode{x2013}St$ plane demarcate regions where the change in the number of fixed points (blue colour) and the change in the nature of stable fixed points (red colour) happens. The representative elliptic patch of vorticity is also shown in a greenish yellow colour for three different aspect ratios.

By analysing the stability of the fixed points, we have already seen that the fixed point at the origin remains an unstable spiral for any  $St >0$ in a Kirchhoff vortex of
 $r=0.5$. One can verify that this will also be valid for any
 $r \in (0,1)$. The pair A and B remain saddles for all aspect ratios provided they exist (indicating the robustness of hyperbolic fixed points). However, the stable spiral fixed points can change their behaviour if the aspect ratio is above some critical value. The same fact has already been discussed towards the end of § 2.3.1 specifically for the aspect ratio
 $r = 0.5$. For any particular aspect ratio, some critical Stokes number
 $\mathcal {S}_1$ exists above which the stable spirals become stable nodes/sinks. As mentioned in § 2.3.1, by solving for the non-negative real-valued solution of (2.10), one can find the critical pairs of
 $St$ and
 $r$ at which this behaviour change happens, and is shown in the
 $r\unicode{x2013} St$ plane (see figure 6, red colour). From asymptotic analysis of (2.10), one may show that
 $\mathcal {S}_1 = r^{-1}\sqrt {3/5}-298/(25 \sqrt {15})+\textit {O}(r)$ for
 $r \rightarrow 0$ and
 $\mathcal {S}_1 = (1-r) + \tfrac {1}{2} (1-r)^2+\textit {O}(1-r)^3$ for
 $r \rightarrow 1$, and the asymptotes are also shown in the figure. On the other hand, the exact expression for
 $\mathcal {S}_2 = (1+r)^2\, (1-\sqrt {r})/(r\, (1+\sqrt {r}))$, also mentioned at the end of § 2.3.1, has asymptotic forms,
 $\mathcal {S}_2 = r^{-1} -2/\sqrt {r}+4+\textit {O}(\sqrt {r})$ for
 $r \rightarrow 0$ and
 $\mathcal {S}_2 = (1-r) + \tfrac {1}{2}\, (1-r)^2+\textit {O}((1-r)^3)$ for
 $r \rightarrow 1$. We find that
 $\mathcal {S}_1<\mathcal {S}_2$ for any
 $r \in (0,1)$. Note that the red curve is very close to the blue curve; however, they never intersect, indicating that for any fixed
 $St > 0$, there always exists a narrow parameter regime bounded by both red and blue curves (
 $\mathcal {S}_1 < St < \mathcal {S}_2$) inside which the fixed points C and D will behave as nodes/sinks.
For any finite  $r$ value, one may note that both
 $\mathcal {S}_1$ and
 $\mathcal {S}_2$ values are finite. However, as
 $r \rightarrow 0$, both diverge as
 $\textit {O}(1/r)$, becoming a larger value. This divergence suggests that particles must possess high inertia for critical dynamical behavioural changes to occur. However, note that when
 $r \rightarrow 0$, the vortex rotates slowly (
 $\varOmega = r/(1+r)^2 \rightarrow 0$). Thus, the relevant time scale in the problem becomes the angular velocity
 $\varOmega$ rather than the vorticity of the patch. Consequently, the Stokes number based on the angular velocity of the vortex,
 $St_{\varOmega } = St \, r/(r+1)^2$, evaluated for critical behaviours
 $\mathcal {S}_{\varOmega,1} \sim \sqrt {3/5}$ and
 $\mathcal {S}_{\varOmega,2} \sim 1$, remains constant and bounded in the limit of
 $r \rightarrow 0$, indicating that the divergence was merely an artefact of the adopted scaling.
2.5. The basin of attraction of the fixed points
From numerical simulations, we have seen that all the particles repelled away from the unstable fixed points (A, B and O) are not attracted to the stable fixed points (C and D); instead, some spiral away to infinity. The initial particle locations that would result in them getting attracted to any of the two stable fixed points are shown in figure 7, representing the basin of attraction of those fixed points. The basins are coloured to distinguish each other. The region outside these coloured regions indicates the basin of attraction of infinity; i.e. particles initialized in these regions will eventually spiral away to infinity and never get attracted to any of the stable fixed points. We have used  $10^5$ particles randomly initialized in the flow field to generate the figure. We tracked their evolution numerically and identified those that would approach any fixed points over a long time. We marked their initial locations using specific colours to distinguish between the basins of each fixed point. As visible in figure 7, the basin of attraction of the stable fixed points shrinks as
 $St$ increases and vanishes. It can be verified that the basins will disappear beyond the critical value
 $\mathcal {S}_2$, indicating the absence of stable fixed points. The figure shows that the stable fixed points C and D are enclosed within the corresponding basin of attraction, which is obvious. However, the unstable fixed points A and B appear to fall at the edge of the basins. The regular nature of the basin boundaries shows non-chaotic dynamics of inertial particles in the elliptic vortex. Close to origin O, the basin of attraction of stable fixed points (coloured regions), and that of infinity (empty region) forms an inter-twisting pattern. As a result, a particle starting closer to the origin will have dynamics sensitive to the initial condition. A small change in the initial position could lead the particle to end up either in the fixed points C or D or spiral away to infinity.
The basin of attraction for inertial particles of (a)  $St = 0.2$, (b)
 $St = 0.5$ and (c)
 $St = 0.77$ in a Kirchhoff vortex of
 $r=0.5$. The corresponding fixed points A, B, C and D are marked in each figure using the ‘
 $\times$’ symbol. The streamlines of the Kirchhoff vortex are shown in grey in the background.

Here, we would like to highlight prior studies on the dynamics of inertial particles in the neighbourhood of a pair of like-signed point vortices by Angilella (Reference Angilella2010), Ravichandran et al. (Reference Ravichandran, Perlekar and Govindarajan2014) and Zhao et al. (Reference Zhao, Guo, Zuo and Qian2024). The system of like-signed point vortices bears similarities with that of the Kirchhoff vortex. The inertial particles exhibit qualitatively identical behaviour near the point vortex pair. The types of fixed points, stability characteristics and the basin of attractions show qualitative similarities to those observed in the case of the elliptic vortex. A recent study by Kapoor, Jaganathan & Govindarajan (Reference Kapoor, Jaganathan and Govindarajan2024) extends previous studies near the like-signed point vortex pair by focusing on the dynamics of inertial particles of any density ratio. The study reveals interesting dynamical behaviours, with the existence of periodic and chaotic dynamics of particles depending on their inertia and density ratio. Additionally, in the limit of a large density ratio, the particle dynamics show similarity to that in a Kirchhoff vortex. Though it seems like an elliptic vortex can be simply replaced by a pair of like-signed vortices, it is worthwhile to focus on the subtle differences. The flow field in both cases matches well in the far field only. The Kirchhoff vortex and the pair vortices have different features in the near field. Notably, the origin behaves as a saddle in the case of pair vortices, whereas in the elliptic vortex, it acts as a centre/spiral.
3. Dynamics of heavy inertial particles in a strained elliptic vortex
When an external uniform shear flow is superimposed on the Kirchhoff elliptical vortex ( $\psi '_v$), Moore & Saffman (Reference Moore and Saffman1971) was the first to obtain stationary elliptical vortices of uniform vorticity as exact solutions of the steady Euler equations. Later, Kida (Reference Kida1981) obtained the exact solutions of the unsteady Euler equations, resulting in unsteady elliptical vortices in a uniform shear flow, now known as the Kida vortex. In a special case of an external pure-strain flow of the form
 $\psi '_e = ({s}/{4}) (-x'^2 + y'^2)$, where
 $s$ is the strain rate, the dynamics of the elliptic vortex of uniform vorticity is governed by
 $$\begin{gather} \dot{r} ={-}s r\sin 2\theta, \end{gather}$$
 $$\begin{gather}\dot{\theta} = \varOmega+\frac{s}{2}\,\varLambda\cos 2\theta, \end{gather}$$
where,  $r$ is the instantaneous aspect ratio and
 $\theta$ is the instantaneous orientation of the ellipse. The strain rate (
 $s$) in (3.1) is scaled with the uniform vorticity of the ellipse. The expressions for
 $\varOmega = r/(r+1)^2$,
 $\varLambda = (1+r^2)/(1-r^2)$ and
 $k^2 = (1-r^2)/r$ remain consistent with those defined for the Kirchhoff vortex. However, for the Kida vortex, these parameters are defined using the instantaneous aspect ratio
 $r = r(t)$, which evolves over time. It is evident from (3.1) that the dynamics of the Kida vortex depend on the initial aspect ratio (
 $r(t=0) = r_0$), initial orientation (
 $\theta (t=0) = \theta _0$) and the strain rate (
 $s$) of the external flow. The dynamical system described in (3.1) possesses a conserved integral, as identified by Neu (Reference Neu1984), Baylay, Holm & Lifschitz (Reference Baylay, Holm and Lifschitz1996) and Meacham, Morrison & Flierl (Reference Meacham, Morrison and Flierl1997), which is
 \begin{equation} \mathcal{H}=\log\left(\frac{(1+r)^2}{4 r}\right)+s \frac{(1-r^2)}{2\, r}\cos 2 \theta. \end{equation}
The numerical value of  $\mathcal {H}$ is determined by
 $r_0$,
 $\theta _0$ and
 $s$, and remains constant throughout the time evolution of the vortex.
Analysis of the system in (3.1) reveals that the unsteady Kida vortex can exhibit three distinct dynamical behaviours: rotation, nutation and elongation (see Kida Reference Kida1981; Neu Reference Neu1984; Dritschel Reference Dritschel1990). Figure 8 schematically illustrates these dynamics of the Kida vortex. A general Kida vortex, as shown in Kida (Reference Kida1981), which encounters a broader class of background linear flow (that has both straining and rotational components, e.g. simple shear flow), will also exhibit all these dynamical behaviours. However, in this study we limit ourselves to the case of a Kida vortex under pure-strain (irrotational) background flow. An elliptical vortex patch in a straining flow conserves its area throughout its dynamical evolution, while its aspect ratio, angular velocity and angular orientation vary over time. The ellipse undergoes rotation similar to the Kirchhoff vortex for low strain rates, albeit with a periodically changing aspect ratio and angular velocity. However, the ellipse tends to align with the straining axis at high strain rates and elongate indefinitely. The ellipse can also show oscillations with a periodically varying aspect ratio under suitable conditions.
Schematic showing the three major types of dynamics exhibited by a strained elliptical vortex: (a) an initial elliptical vortex patch with anti-clockwise vorticity content superimposed with an external straining flow, (b–d) rotation: full rotation and periodic variation in the aspect ratio of the ellipse, (e–g) nutation: back-and-forth oscillation and periodic variation in the aspect ratio of the ellipse, and (h–j) elongation: the ellipse irreversibly stretches and aligns along the straining axes of the flow.

To elaborate, consider the phase portrait in figure 9, which depicts contours of constant  $\mathcal {H}$ for three different
 $s$ values. Depending on the initial values
 $r_0$ and
 $\theta _0$, which determine the value of
 $\mathcal {H}$, the subsequent dynamics of the vortex will flow along the contour line of the same
 $\mathcal {H}$ in the phase portrait. Figure 9(a) corresponds to
 $s = 0.2$, encompassing all three dynamical regimes. In region I, a typical
 $\mathcal {H}$ contour extends from
 $\theta = 0$ to
 $\theta = 2{\rm \pi}$, while
 $r$ varies periodically over a restricted range, indicating rotation dynamics of the ellipse. In region II, both
 $r$ and
 $\theta$ vary periodically over a restricted range, indicating nutation dynamics where the ellipse oscillates with a changing aspect ratio instead of completing a rotation. In region III, the contour lines show
 $r$ asymptotically approaching zero while
 $\theta$ approaches
 ${\rm \pi} /4$ or
 $5{\rm \pi} /4$ (i.e. the straining axes), indicating irreversible elongation of the ellipse. When
 $s = 0.27$, as shown in figure 9(b), only nutation and elongation dynamics exist, with rotation dynamics disappearing. The critical value of
 $s$ at which this transition occurs is approximately
 $s \approx 0.2454$. Further increasing
 $s$ to 0.32, as depicted in figure 9(c), results in only elongation dynamics, as nutation also disappears for
 $s \gtrsim 0.3$. Note that these critical values of
 $s$ for the disappearance of rotation and nutation dynamics have been previously discussed by Kida (Reference Kida1981) and Neu (Reference Neu1984), though their values differ by a factor of two due to different definition conventions (i.e. 0.1227 and 0.15, respectively). Therefore, for
 $s \gtrsim 0.3$, all elliptical vortices in a pure-strain flow will elongate indefinitely, as noted by Moore & Saffman (Reference Moore and Saffman1971). For larger strain rates, the phase portrait qualitatively resembles figure 9(c) with only elongation dynamics. Conversely, when
 $s$ is very small, the phase portrait resembles figure 9(a) but with a larger region I, indicating a higher likelihood of rotation dynamics.
The phase portraits show contour lines of constant  $\mathcal {H}$ in the
 $r$ vs
 $\theta$ plane for a Kida vortex for (a)
 $s = 0.2$, (b)
 $s = 0.27$ and (c)
 $s = 0.32$. The various dynamical regimes are marked using Roman numerals: I for rotation, II for nutation and III for elongation. The blue and red curves demarcate these dynamical regimes. The critical values of strain rates at which the transition in dynamical nature occurs are marked on the
 $s$ axis.

Figure 10 shows the typical time evolution of  $r$ and
 $\theta$ of a Kida vortex with
 $r_0 = 0.5$, for various
 $s$ and
 $\theta _0$ values, obtained by numerically solving (3.1). For the smallest strain rate (
 $s = 0.01$) and
 $\theta _0 = 0$, the aspect ratio of the ellipse barely changes, but it undergoes rotation as
 $\theta$ varies from 0 to
 $2{\rm \pi}$ periodically. For a slightly larger strain rate (
 $s = 0.1$) with the same
 $\theta _0$, the ellipse completes a rotation again but with a larger periodic variation in the aspect ratio. However, when
 $s$ is increased to
 $0.2$ with the same
 $\theta _0$, the ellipse asymptotically elongates (
 $r \rightarrow 0$) and aligns with the straining axes (
 $\theta \rightarrow {\rm \pi}/4$), losing its periodic dynamics. This occurs because the critical
 $s$ value for the specific initial conditions (
 $r_0 = 0.5$ and
 $\theta _0 = 0$) is numerically determined to be
 $0.174$, beyond which only elongation dynamics exist. Note that this critical value is less than
 $0.3$ mentioned earlier, which is the critical value for this transition irrespective of the initial conditions. Now, fixing
 $s = 0.2$ but adjusting the initial
 $\theta$: when
 $\theta _0 = {\rm \pi}/3$, the ellipse undergoes rotation; however, when
 $\theta _0 = {\rm \pi}/2$, the ellipse nutates. The figure summarizes the typical cases of the Kida vortex considered in this study to analyse the dispersion of particles. Our primary focus here is on the dynamics of inertial particles in a slightly strained (
 $s \ll 1$) Kida vortex with
 $r_0 = 0.5$ and
 $\theta _0 = 0$, as discussed in the upcoming subsection. Later (see § 3.2), we also consider the case of sufficiently strong external straining (
 $s = 0.2$) on the same ellipse but with
 $\theta _0 = 0$ and
 ${\rm \pi} /2$, to discuss particle dispersion in nutating and elongating Kida vortices.
The time variation of the (a) aspect ratio  $r$ and (b) angular orientation
 $\theta$ of a Kida vortex with
 $r_0 = 0.5$ is shown for various non-dimensional strain rates
 $s$ and initial orientations
 $\theta _0$. The angular variation is represented modulo
 $2{\rm \pi}$ to indicate the completion of a full ellipse rotation. Different colours indicate the various dynamics of the Kida vortex: blue, orange and violet for rotation, black for elongation and green for nutation. The period of rotation differs for each case, as inferred from the figure.

3.1. Dynamics of inertial particles in a weakly strained, rotating Kida vortex
This section focuses on the dynamics of inertial particles in a Kida vortex, which is weakly strained ( $s \ll 1$) by a pure-strain flow. We consider the case where the ellipse undergoes a rotary dynamics. The inertial particles in the co-rotating frame with the ellipse are tracked using the modified form of the Maxey–Riley equation:
 \begin{equation} \dot{\boldsymbol{v}} = \frac{\boldsymbol{u}-\boldsymbol{v}}{St}+\boldsymbol{x} \dot{\theta}^2 - 2 \dot{\theta} \hat{\boldsymbol{e}}_z\times \boldsymbol{v} - \ddot{\theta} \hat{\boldsymbol{e}}_z\times \boldsymbol{x} . \end{equation}
Note that the unsteady nature of the Kida vortex, even in the co-rotating frame, is accounted for in the Stokes drag term, centrifugal term and Coriolis term on the right-hand side as  $\boldsymbol {u} = \boldsymbol {u}(\boldsymbol {x},t)$ and
 $\dot {\theta }=\dot {\theta }(t)$. In addition, the non-uniform rate of rotation of the frame, which is responsible for the Euler force, is represented by the last term on the right-hand side. We simulate the dynamics of
 $St = 0.1$ point particles in a Kida vortex of initial aspect ratio
 $r_0 = 0.5$ and orientation
 $\theta _0 = 0$. The simulation is performed for two different strain rate values, and the particles’ evolution is shown in figure 11 as snapshots, as observed in a co-rotating frame. For a smaller value of strain rate
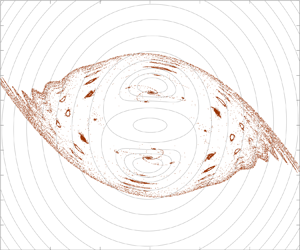
 $s = 0.01$, the overall dynamics resemble that in the case of the Kirchhoff vortex, as can be seen from figure 11(a–d); most of the particles are getting centrifuged away, and a fraction of them attracted towards a pair of stable attractors. Unlike the Kirchhoff vortex, here the attractors are not fixed points but limit cycles in extended phase space (including the time axis), which can be seen as the red curve in the inset of figure 11(d), obtained by tracking the particles for a long time.
Snapshots showing the evolution of  $2 \times 10^5$ inertial particles of
 $St = 0.1$ in a Kida vortex of
 $r_0 = 0.5$,
 $\theta _ 0 = 0$ for (a–d)
 $s = 0.01$ and (e–h)
 $s = 0.035$, observed in a co-rotating frame, obtained from numerical simulation. The time stamps are: (a,e)
 $t = 50$, (b,f)
 $t = 100$, (c,g)
 $t = 500$, (d,h)
 $t = 2000$.The particles are initialized with zero velocity inside a circular region of radius
 $2.5$, enclosing the ellipse. The instantaneous streamlines of the corresponding Kida vortex are shown in grey in the background. The insets of (d,h) are the enlarged views at
 $t = 2000$ showing the accumulation of particles in limit cycle trajectories, obtained numerically, shown in red. The blue colour indicates the limit cycles evaluated using a perturbative approach as in § 3.1.1.

For a relatively larger value of the strain rate  $s = 0.035$ (which is still less than the critical value of 0.174, allowing for the rotation of the ellipse), the particle dynamics become intricate, as evident in the corresponding figure 11(e–h). We note that some particles are drawn towards an additional, larger-sized limit cycle, depicted in red in the inset of figure 11(h). Contrary to a simple spiralling dispersion, the remaining particles become trapped in a pair of stationary attractors at far field (for a co-rotating observer, which appears to be counter-rotating as in the snapshots). Further details regarding this attractor and particle dispersion due to it can be found in §§ 3.1.2 and 4, respectively. Additionally, the particle dynamics exhibit chaotic behaviour, consistent with the effect of external strain on fluid tracers (Polvani & Wisdom Reference Polvani and Wisdom1990; Ngan, Meacham & Morrison Reference Ngan, Meacham and Morrison1996; Kawakami & Funakoshi Reference Kawakami and Funakoshi1999). In this context, a systematic analytical study is presented in the upcoming §§ 3.1.1 and 3.1.2 to illustrate that the interplay of inertia (
 $St$) and straining (
 $s$) leads to complex dynamics, as depicted in figure 11.
3.1.1. Modification to the fixed points of the Kirchhoff vortex due to external straining
For the analytical treatment to be accessible, the governing equation (3.3) is written in component form using elliptic coordinates as
 $$\begin{align} \ddot{\xi} &= \frac{h k^{{-}1}u_\xi-\dot{\xi}}{St}-\frac{2 \dot{k}}{k} \dot{\xi}+2 \dot{\theta} \dot{\eta} -\frac{h^2 \dot{k}}{2 k\,St}\sinh 2\xi \nonumber\\ &\quad+h^2 \left\{ -\left(\dot{\eta} \dot{\xi}+\frac{\dot{k} \dot{\theta}}{k}+\frac{\ddot{\theta}}{2}\right)\sin 2\eta+\left(\frac{\dot{\eta}^2-\dot{\xi}^2+\dot{\theta}^2}{2}-\frac{\ddot{k}}{2\, k}\right)\sinh 2\xi\right\}, \end{align}$$
 $$\begin{align} \ddot{\eta} &= \frac{h k^{{-}1} u_\eta-\dot{\eta}}{St}-\frac{2 \dot{k}}{k} \dot{\eta}-2 \dot{\theta} \dot{\xi} +\frac{h^2 \dot{k}}{2k\, St}\sin 2\eta\nonumber\\&\quad-h^2 \left\{ \left(\dot{\eta}\, \dot{\xi}+\frac{\dot{k} \dot{\theta}}{k}+\frac{\ddot{\theta}}{2}\right)\sinh 2\xi+\left(\frac{\dot{\eta}^2-\dot{\xi}^2+\dot{\theta}^2}{2}-\frac{\ddot{k}}{2 k}\right)\sin 2\eta\right\}. \end{align}$$
Note that when  $\dot {k} = \ddot {\theta } = 0$, these equations will reduce to the case of the Kirchhoff vortex as in (2.3); however, which is not the case for any finite strain
 $s \neq 0$. The flow velocity fields can be obtained from the total streamfunction (
 $\psi = \psi _v'+\psi _e'+({\dot {\theta }}/{2}) (x^2+y^2)$) as
 $u_\xi = ({h}/{k}) ({\partial \psi }/{\partial \eta })$ and
 $u_\eta = -({h}/{k}) ({\partial \psi }/{\partial \xi })$. One must remember that the ellipse's evolution (3.1) must also be integrated along to obtain the particle trajectory. Since we know that the attractors of the system are not fixed points but limit cycles from the simulations, we may search for them using the approach by IJzermans & Hagmeijer (Reference IJzermans and Hagmeijer2006) as a periodic modification to the fixed points of the unperturbed system. Let (
 $\bar {\xi },\bar {\eta }$) denote the fixed points for any inertial particle in the Kirchhoff vortex, a time-dependent perturbation of the form
 $\xi = \bar {\xi }+s \xi '(t) + \textit {O}(s^2)$ and
 $\eta = \bar {\eta }+s \eta '(t) + \textit {O}(s^2)$ may denote the limit cycles for any small straining
 $s \ll 1$.
The system behaves as a perturbed Kirchhoff vortex in an external straining flow of  $s \ll 1$. A time-periodic, strain-dependent term will perturb the Kirchhoff vortex's Hamiltonian (streamfunction). For low strain rates, a regular perturbation approach yields the solution of (3.1) as
 $r = r_0+s r_1+\textit {O}(s^2)$ and
 $\theta = \theta _0+\varOmega _0 t+s \theta _1+\textit {O}(s^2)$, where
 $$\begin{gather} r_1 ={-} \frac{r_0}{\varOmega_0}\sin(\varOmega_0 t)\sin(\varOmega_0 t+2 \theta_0) , \end{gather}$$
 $$\begin{gather}\theta_1 = \frac{(1+r_0^3)}{ r_0 (1-r_0)}\sin(\varOmega_0 t)\cos(\varOmega_0 t+2 \theta_0)-\frac{t}{2}\, \frac{(1-r_0)}{(1+r_0)}\cos 2\theta_0 , \end{gather}$$
with  $r_0 = r(t = 0)$,
 $\theta _0 = \theta (t = 0)$ and
 $\varOmega _0 = r_0/(r_0+1)^2$. Note that the leading-order solutions (i.e. solutions when
 $s = 0$) match the Kirchhoff vortex, indicating a constant aspect ratio and uniform rotation rate. Since the parameter
 $k$ is dependent on aspect ratio
 $r$,
 $k$ can also be expanded as a perturbation in
 $s$ as
 $k = k_0 - s k_0 \varLambda _0 r_1/(2 r_0)+\textit {O}(s^2)$, where
 $k_0^2 = (1/r_0-r_0)$ and
 $\varLambda _0 = (1+r_0^2)/(1-r_0^2)$. Similarly, the velocity field
 $(u_\xi,u_\eta )$ can also represent a strain perturbation to that of the Kirchhoff vortex.
By using these perturbation expansions along with the perturbation ansatz for the limit cycle coordinates ( $\xi = \bar {\xi }+s \xi '(t) + \textit {O}(s^2)$ and
 $\eta = \bar {\eta }+s \eta '(t) + \textit {O}(s^2)$), substituted in the governing equations (3.4) will reduce to the matrix equation
 \begin{equation} St\, \ddot{\chi}+\boldsymbol{\mathsf{L}}\,\dot{\chi}+\boldsymbol{\mathsf{K}}\,\chi ={-}\boldsymbol{\mathsf{M}}\, \lambda -N, \end{equation}
where  $\chi = [\xi '(t),\eta '(t)]^\textrm {T}$,
 $\lambda = [\cos (2 \varOmega _0 t+2 \theta _0), \sin (2 \varOmega _0 t+2 \theta _0)]^\textrm {T}$,
 $N = [N_1, N_2]^\textrm {T}$ are vectors, and
 $\boldsymbol{\mathsf{K}}$,
 $\boldsymbol{\mathsf{L}}$ and
 $\boldsymbol{\mathsf{M}}$ are
 $2 \times 2$ matrices. The entries
 $N$,
 $\boldsymbol{\mathsf{K}}$,
 $\boldsymbol{\mathsf{L}}$ and
 $\boldsymbol{\mathsf{M}}$ are determined by the Kirchhoff vortex and its fixed points (
 $\bar {\xi },\bar {\eta }$) and are listed in Appendix B. Equation (3.6) represents a pair of coupled, forced, second-order, linear ordinary differential equations. We are interested in the large-time/steady-state solutions as they would tell us about the limit cycles. For this, we assume a periodic solution of the form
 $\chi = F_0 +\boldsymbol{\mathsf{F}}_1\, \lambda$ and the substitution yields two independent matrix equations (which are related to the particular solution of (3.6)),
 $$\begin{gather} \boldsymbol{\mathsf{K}}\, F_0 ={-}N, \end{gather}$$
 $$\begin{gather}\left(4\, \varOmega_0^2\, St\, \boldsymbol{\mathsf{I}}-2\, \varOmega_0\, \boldsymbol{\mathsf{L}}\, \boldsymbol{\varSigma}-\boldsymbol{\mathsf{K}} \right) \boldsymbol{\mathsf{F}}_1 = \boldsymbol{\mathsf{M}}, \end{gather}$$
where  $\boldsymbol{\mathsf{I}} = \left (\begin{smallmatrix} 1 & 0\\ 0 & 1 \end{smallmatrix}\right )$ is a
 $2 \times 2$ identity matrix and
 $\boldsymbol {\varSigma } = \left (\begin{smallmatrix} 0 & -1\\ 1 & 0 \end{smallmatrix}\right )$. These equations are linear and a simple inversion yields the unknowns
 $F_0$ and
 $\boldsymbol{\mathsf{F}}_1$ and, thus, the limit cycles. However, the stability of the limit cycle is determined by the transient dynamics of the solutions of (3.6). It is determined by the eigenvalues of the matrix
 $\boldsymbol{\mathsf{P}}$ that satisfy the quadratic matrix equation
 $St\, \boldsymbol{\mathsf{P}}^2+\boldsymbol{\mathsf{L}}\boldsymbol {\cdot } \boldsymbol{\mathsf{P}}+\boldsymbol{\mathsf{K}} = \boldsymbol{\mathsf{0}}$ (related to the homogeneous solution of (3.6)). Any eigenvalue with a positive real part indicates an unstable limit cycle; if all the eigenvalues have a negative real part, it is stable. The limit cycles are derived as a perturbation to the fixed points of the Kirchhoff vortex as (
 $[\xi,\eta ] = [\bar {\xi },\bar {\eta }]^T + s\, \chi +\textit {O}(s^2)$). They are then evaluated for the case of
 $r_0 = 0.5$ and
 $\theta _0 = 0$ and is shown in figure 12 as
 $St$ varies. Note that the originally stable fixed points (C and D) transform into stable limit cycles, as confirmed through numerical verification by tracking particles over an extended period, as depicted in the insets of figure 11(d,h). While theoretically predicting that the hyperbolic fixed points (A and B) transition into unstable limit cycles under strain perturbation, it may be more accurate to state that the hyperbolic fixed points retain their hyperbolic nature. However, the stable and unstable manifolds connecting them are now susceptible to the oscillatory effects induced by this unstable limit cycle, potentially leading to their intersections and the formation of tangles. A detailed analysis of the perturbations to the hyperbolic fixed points is presented in the upcoming § 3.1.2.
The variation of limit cycles corresponds to the fixed points of inertial particles of various  $St$ in a Kida vortex of
 $r_0 = 0.5$,
 $\theta _0 = 0$ and
 $s = 0.035$, obtained using the perturbative approach (cf. figure 3a). The stable limit cycles are represented using continuous lines and the unstable limit cycles are represented using dashed lines. Only the first quadrant is shown here. A similar pair of limit cycles also exists in the third quadrant (not shown here). The perturbative approach does not capture the larger limit cycles and, thus, is not shown here. The grey curves in the background indicate the streamlines of the Kida vortex and the black curve indicates the ellipse at
 $t = 0$.

The perturbation to the fixed point at the origin O yields all the entries of  $\boldsymbol{\mathsf{M}}$ and
 $N$ to be zero, indicating that no limit cycle perturbation exists (either stable or unstable) to the origin. The origin remains an unstable spiral for heavy inertial particles in the Kida vortex, which centrifuges them away from the centre.
In the inset of figure 11(d,h), the perturbatively obtained limit cycle solutions are shown in blue and agree with the respective actual limit cycles (red colour, obtained numerically). However, for the case of  $s=0.035$, an additional pair of larger limit cycles exists, as can be seen in the inset of figure 11(h) that this method could not capture.
3.1.2. Non-integrable perturbation to saddles and criteria for chaos
The external straining ( $s \ll 1$) introduces a time-periodic perturbation (non-integrable) to the Kirchhoff vortex (integrable Hamiltonian system). This perturbation leads to Lagrangian chaos of fluid tracers (
 $St = 0$) in the Kida vortex (Polvani & Wisdom Reference Polvani and Wisdom1990). The perturbations affect the hyperbolic fixed points of the Kirchhoff vortex, leading to the heteroclinic orbits to split into stable and unstable manifolds, which transversely intersect and form tangles, as shown by the zero crossings of the corresponding Melnikov functions. The result is a topological similarity to a horseshoe map and a dense set near the intersections (see Smale Reference Smale1967; Ott Reference Ott2002), which guarantees the existence of a strange attractor and chaotic dynamics. Though the original theorem is formulated for homoclinic orbits, a later extension for heteroclinic orbits conveys a similar concept (see Bertozzi Reference Bertozzi1987). Here, we study the modification to the dynamics of suspended heavy inertial particles in the Kida vortex due to their finite inertia using the same approach. A competing effect may arise for inertial particles due to their finite inertia and suppress chaos as seen from similar studies (Angilella Reference Angilella2010; Angilella et al. Reference Angilella, Vilela and Motter2014). To analytically study this, we consider modifying the particle dynamics in the Kida vortex (of
 $s \ll 1$) due to weak inertial particles (
 $St \ll 1$).
Using the slow manifold expansion of (3.4) for  $St \ll 1$, we obtain the modified kinematic equations for
 $\dot {\xi }$ and
 $\dot {\eta }$ as perturbations in
 $St$. By combining the
 $s \ll 1$ expansion of instantaneous aspect ratio
 $r$ and angle of rotation
 $\theta$ with this slow manifold equation, we can express the modified kinematic equations describing the trajectory of an inertial particle in the Kida vortex as
 $$\begin{gather} \dot{\xi} = \hat{f}_1(\xi,\eta)+s \hat{g}_1(\xi,\eta;t)+St \hat{\phi}_1(\xi,\eta)+\textit{O}(s^2, St^2, s\, St), \end{gather}$$
 $$\begin{gather}\dot{\eta} = \hat{f}_2(\xi,\eta)+s\, \hat{g}_2(\xi,\eta;t)+St\, \hat{\phi}_2(\xi,\eta)+\textit{O}(s^2, St^2, s\, St), \end{gather}$$
where the relevant functions  $\hat {f}_1$ to
 $\hat {\phi }_2$ outside and inside the ellipse are listed in Appendix C. In (3.8) the functions
 $\hat {f}_1$ and
 $\hat {f}_2$ describe the dynamics resulting from the dominant Kirchhoff vortex (integrable);
 $\hat {g}_1$ and
 $\hat {g}_2$ are time-periodic perturbations due to external straining flow;
 $\hat {\phi }_1$ and
 $\hat {\phi }_2$ are the time-independent perturbations due to particle inertia that is novel in our work. Thus, the dynamics of weak inertial particles in a Kida vortex will be perturbations to that of fluid tracers in a Kirchhoff vortex, where the perturbations are together contributed from external straining and particle inertia.
The dynamics of fluid tracers in a Kirchhoff vortex (i.e. (3.8) with  $s=0$ and
 $St = 0$) is integrable and, thus, represents a Hamiltonian system. The introduction of an external straining will not affect the integrability of the system inside the elliptic vortex as the flow field inside is pure solid-body rotation and devoid of any hyperbolic fixed points. However, the flow field outside the ellipse has two hyperbolic fixed points, A and B, connected by the two pairs of heteroclinic orbits
 $\textrm {H}_1^{\pm }$ and
 $\textrm {H}_2^{\pm }$, as shown in figure 1(b). The strain perturbation can lead to the formation of heteroclinic tangles. To identify that, we use Melnikov's method. According to the method, one must evaluate the Melnikov function for all hyperbolic fixed points, which measures the distance between stable and unstable manifolds in the Poincaré section. Odd zeros of the Melnikov function indicate a transverse crossing of the corresponding stable and unstable manifolds (see Bertozzi Reference Bertozzi1987; Wiggins Reference Wiggins1990). For fluid tracers in the Kida vortex, Ngan et al. (Reference Ngan, Meacham and Morrison1996); Kawakami & Funakoshi (Reference Kawakami and Funakoshi1999) have evaluated the Melnikov function, which is shown to satisfy the requirements for tangle formation for any non-zero straining. They also showed the space-filling nature of the Poincaré section and, thus, concluded that the transport of fluid tracers in the Kida vortex can be chaotic.
Here, we use the same analytical tools to identify the dynamical behaviour of heavy inertial particles in the Kida vortex. For very small values of the Stokes number, the particles are expected to behave like fluid tracers and, thus, can be chaotic. On the contrary, when the strain rate is small, the inertial particles can simply be attracted to the fixed points of the dominant Kirchhoff vortex and, thus, will not be chaotic. It is when the Stokes number and strain rate are of the same order that the competition between these effects takes place, and complicated things can happen. Thus, for the case of  $St \ll 1$ and
 $s \ll 1$, we consider
 $St = q\, s$, where
 $q$ is an
 $\textit {O}(1)$ quantity. By substituting the same in (3.8), the system can be rewritten up to
 $\textit {O}(s^2)$ as
 $$\begin{gather} \dot{\xi} = \hat{f}_1(\xi,\eta)+s \left\{\hat{g}_1(\xi,\eta;t)+q \hat{\phi}_1(\xi,\eta)\right\}, \end{gather}$$
 $$\begin{gather}\dot{\eta} = \hat{f}_2(\xi,\eta)+s \left\{\hat{g}_2(\xi,\eta;t)+q \hat{\phi}_2(\xi,\eta) \right\}. \end{gather}$$
The system is perturbed from the integrable Kirchhoff vortex in  $s$ and, thus, may not be integrable in general. Following Bertozzi (Reference Bertozzi1988), the Melnikov functions associated with the hyperbolic fixed points of the system can be evaluated as
 $$\begin{align}
M_j^{{\pm}}(\phi) &=
\int_{-\infty}^{\infty}\left[\hat{f}_1(\xi_j^{{\pm}}(t),\eta_j^{{\pm}}(t))
\left\{ \hat{g}_2(\xi_j^{{\pm}}(t),\eta_j^{{\pm}}(t);
t+\phi)+q
\hat{\phi}_2(\xi_j^{{\pm}}(t),\eta_j^{{\pm}}(t))\right\}\right.\nonumber\\
&\quad\left.-\,\hat{f}_2(\xi_j^{{\pm}}(t),\eta_j^{{\pm}}(t))
\left\{ \hat{g}_1(\xi_j^{{\pm}}(t),\eta_j^{{\pm}}(t);
t+\phi) +q\,
\hat{\phi}_1(\xi_j^{{\pm}}(t),\eta_j^{{\pm}}(t))\right\}\right]\,\nonumber\\
&\quad\times{\rm e}^{-\int_0^t \textrm{tr}(Df)\,{\rm d}t'}\, {\rm d}t,
\end{align}$$
where the subscript  $j (= 1, 2)$ indicates the heteroclinic orbits
 $(\xi _j^{\pm }(t),\eta _j^{\pm }(t))$ of the unperturbed system (Kirchhoff vortex) connected to the hyperbolic fixed points for which the Melnikov function is evaluated. Here the term
 $\textrm {tr}(Df) = {\partial \hat {f}_1}/{\partial \xi }+{\partial \hat {f}_2}/{\partial \eta }$ is the trace of the Jacobian matrix of the unperturbed system evaluated along the same heteroclinic orbit, which is not zero in general. One may note that the non-zero trace results from writing the dynamical system in non-standard variables
 $(\xi, \eta )$. However, the divergence of the corresponding velocity vector field in the elliptical coordinate system, evaluated as
 $\boldsymbol {\nabla }_{\xi,\eta } \boldsymbol {\cdot } [u_{\xi },u_{\eta }] = h^2\, ( {\partial (\,\hat {f}_1/h^2)}/{\partial \xi }+{\partial (\,\hat {f}_2/h^2)}/{\partial \eta } )$, is different from the trace mentioned above;
 $\boldsymbol {\nabla }_{\xi,\eta } \boldsymbol {\cdot } [u_{\xi },u_{\eta }]=0$ in accordance with the Hamiltonian nature of tracer dynamics in the Kirchhoff vortex.
After splitting the integrals, it can be seen that the time-periodic perturbations (due to straining)  $\hat {g}_1$ and
 $\hat {g}_2$ will result in a periodic term in
 $M$ of period
 ${\rm \pi} /\varOmega _0$, however, the time-independent perturbations
 $\hat {\phi }_1$ and
 $\hat {\phi }_2$ will contribute as a constant term, i.e.
 $M(\phi ) = m_0(\phi )+q\, m_1$ where
 $m_0(\phi +{\rm \pi} /\varOmega _0) = m_0(\phi )$ is the periodic function and
 $m_1$ is a constant, which are dependent on the aspect ratio of the ellipse. When the particles are inertialess (i.e.
 $q=0$), the resulting Melnikov function is periodic
 $m_0(\phi )$, known to have zeros for any finite
 $s \ll 1$. However, for inertial particles (
 $q \neq 0$), the term
 $m_1$ effectively shifts the periodic function
 $m_0(\phi )$ up or down when plotted against
 $\phi$, depending on the sign of
 $m_1$. Thus, there can exist a critical value of
 $q = \lvert \max (m_0(\phi ))/m_1\rvert$ such that beyond which the Melnikov function
 $M(\phi )$ ceases to have transverse zeros. This indicates that there can be a critical value of
 $St$ for a given strain rate
 $s$ above which the heteroclinic tangles will disappear and possibly the chaos too. Since, in our system, there is more than one heteroclinic orbit, this critical value will be the greatest of all the critical values corresponding to each orbit so that the complete disappearance of heteroclinic tangles will be ensured.
Similar dynamical behaviour can also be observed in systems where two competing physics leads to a critical parameter value at which the appearance/disappearance of chaos occurs, for example, (i) the settling of inertial particles in a flow field created by a pair of like-signed vortices (see Angilella Reference Angilella2010), and (ii) the transport of passive fluid tracers in the same flow field near a wall (see Angilella et al. Reference Angilella, Vilela and Motter2014). In either case, the zeros of the sinusoidal Melnikov function are affected by the vertical shift to the Melnikov function due to the competing parameter in the problem.
For the Kida vortex, we explain the scenario using an example. Consider a Kirchhoff vortex with  $r_0 = 0.5$ and
 $\theta _0 = 0$, perturbed with a pure-strain flow to form the Kida vortex. The heteroclinic orbits
 $\textrm {H}_1^{\pm }$ and
 $\textrm {H}_2^{\pm }$ are numerically obtained for the case. By substituting them in (3.10), we evaluate the Melnikov function for each orbit. For
 $M_1^{\pm }(\phi )$, the amplitude of the periodic function
 $m_0(\phi )$ is evaluated to be approximately
 $0.0082$ and
 $m_1 \approx -0.4889$. Similarly, for
 $M_2^{\pm }(\phi )$, the amplitude of corresponding
 $m_0(\phi )$ is evaluated to be approximately
 $0.8267$ and
 $m_1 \approx 0.1950$. The variation of the Melnikov functions with
 $\phi$ over a period
 ${\rm \pi} /\varOmega _0$ is shown in figure 13. We can evaluate the critical value of
 $q$ at which the zeros of the Melnikov function disappear as
 $q_{{cr},1} \approx 0.0168$ and
 $q_{{cr},2} \approx 4.2395$, which is independent of whether it is a
 $`+'$ or
 $`-'$ type heteroclinic orbit (due to their symmetry). Thus, we may conclude that the heteroclinic tangles of
 $H_1^{\pm }$ disappear if
 $St > q_{{cr},1}\, s$ and that of
 $H_2^{\pm }$ disappear if
 $St > q_{{cr},2}\, s$. When
 $St > q_{{cr},2}\, s$, the complete disappearance of heteroclinic tangles occurs. In other words, there will not be any chaos when the straining is less than the critical value
 $s_{{cr},2} = St/q_{{cr},2}$.
The Melnikov functions (a)  $M_1^{+}(\phi )$ and (b)
 $M_2^{+}(\phi )$ for a Kida vortex of
 $r_0 = 0.5$ and
 $\theta _0 = 0$ are plotted against
 $\phi$ for various
 $q$ values. The abscissa is shown as a dashed-dotted line to identify the zeros of the Melnikov functions.

Figure 14 illustrates the schematic representation of tangles associated with the saddles A and B and the heteroclinic connection  $H_1^{\pm }$ in various contexts. In each scenario, the red curve denotes the unstable manifold of saddle A, while the blue curve represents the stable manifold of saddle B. For tracers in the Kirchhoff vortex, as depicted in figure 14(a), the stable and unstable manifolds coincide without any transverse intersection. With a small strain perturbation, as shown in figure 14(b), the stable and unstable manifolds form folds and transversely intersect, leading to heteroclinic tangles. This tangle is responsible for the onset of chaotic dynamics of tracer particles in a Kida vortex. We now concentrate on the effect of particle inertia on the dynamics in the absence of external straining – inertial particles in the Kirchhoff vortex. Figure 14(c) shows the effect of particle inertia, where inertial particles in the Kirchhoff vortex have wide open, stable and unstable manifolds due to centrifugal effects. Folds are absent as there is no strain perturbation, preventing the formation of tangles. Figure 14(d,e) examines the combined effect of strain perturbation and particle inertia. In figure 14(d), particles with weak inertia (
 $St < q_{{cr},1} s$) allow for weak centrifuging, enabling the transverse intersection of the folds to form tangles. Conversely, in figure 14(e), dominant particle inertia (
 $St > q_{{cr},1} s$) causes manifolds to spread apart and prevent the intersection of the folds.
Schematic showing the unstable and stable manifolds of saddles A and B, respectively in the colour red and blue for various scenarios: (a) for tracers in the Kirchhoff vortex ( $s =0, St=0$), (b) for tracers in the Kida vortex (
 $s \ll 1, St=0$), (c) for inertial particles in the Kirchhoff vortex (
 $s =0, St \ll 1$), (d–e) inertial particles in the Kida vortex, where (d)
 $s \ll 1, St < q_{{cr},1} s$ and (e)
 $s \ll 1, St > q_{{cr},1} s$.

For inertial particles with  $St = 0.1$, the critical strain rates
 $s_{{cr}} = St/q_{{cr}}$ can be obtained as
 $s_{{cr},1} \approx 5.9524$ and
 $s_{{cr},2} \approx 0.0236$, such that when
 $s \lessapprox 0.0236$, there will be no chaotic dynamics. In figure 15(a,b) we have shown the basin of attraction (evaluated using the full nonlinear system of (3.4)) of
 $St = 0.1$ particles in the Kida vortex with
 $r_0 = 0.5$,
 $\theta _0=0$ of
 $s = 0.02$ and
 $s = 0.03$, respectively. The basin of attraction has clear boundaries for the case of
 $s=0.02$, indicating regular dynamics; however, for
 $s = 0.03$, the boundaries are mixed/fractal, indicating an underlying chaotic set near the separatrices. The dimension of the basins is evaluated using a method similar to that used by Angilella et al. (Reference Angilella, Vilela and Motter2014). We identify a set of points on a line intersecting the basin boundary. We chose the line segment
 $x = 1.68$ and
 $-0.4 \leq y \leq 0.4$, close to the hyperbolic fixed point A. Pairs of random points on the line segment are checked to see if they belong to different basins. If they do not, they are discarded. If they do, the bisection method is used to refine these points closer until their inter-distance reaches a threshold of
 $10^{-8}$, ensuring they approach the basin boundary. Once a few thousand such points are identified, lying on both the line and the basin boundary, we use a box-counting algorithm to identify the scaling law
 $N(\epsilon ) \sim \epsilon ^{-D^{(1)}}$ to obtain the dimension
 $D^{(1)}$ in the limit of
 $\epsilon \rightarrow 0$. Here,
 $N(\epsilon )$ is the number of boxes of side length
 $\epsilon$ required to cover the sampled points in the basin boundary. The dimension obtained (
 $D^{(1)}$) is the dimension of the intersection set between the basin boundary and the initial line segment. To obtain the basin boundary dimension in 2-D space, one needs to evaluate
 $D^{(2)} = 1 + D^{(1)}$. Figure 16(a) shows the variation of
 $\epsilon$ vs
 $N(\epsilon )$ for the cases of
 $s=0.02$ and
 $s=0.03$, corresponding to the fractal basins in figure 15. A curve fitting reveals that the respective slopes are zero and
 $-0.7679$, as mentioned in the figure, which indicates that the respective fractal dimensions are
 $D^{(2)} = 1$ for the basin in figure 15(a) and
 $D^{(2)} \approx 1.7679$ for the basin in figure 15(b). Figure 16(b) shows the variation of
 $D^{(2)}$ with
 $s$ for the basin boundaries corresponding to a fixed
 $St = 0.1$. The critical value of
 $s$ for the onset of a fractal basin boundary is
 $s_{{crit}}\approx 0.0288$. The prediction of
 $s_{{crit}}$ from the Melnikov analysis of the overdamped system (3.9) is
 $s_{{cr,2}} \approx 0.0236$. We would expect the predictions of the two methods to agree better for smaller values of
 $St$. The overdamped system is strictly valid in the asymptotic limit of
 $St\rightarrow 0$;
 $St=0.1$ is significantly large from the perspective of its validity (see Nath et al. (Reference Nath, Roy, Govindarajan and Ravichandran2022) for discussion on flows with stagnation points). However, the overdamped system and the subsequent Melnikov analysis offer significant computational advantages over the full system, which tends to get very stiff for small
 $St$. It can be used to efficiently diagnose the chaotic dynamics when we are interested in first-order effects of particle inertia.
The basin of attraction of  $St = 0.1$ particles in a Kida vortex (of
 $r_0 = 0.5$ and
 $\theta _0 = 0$) with strain rates (a)
 $s = 0.02$ indicating smooth basin boundaries and (b)
 $s = 0.03$ indicating fractal basin boundaries. Figures are generated using the full system of (3.4) along with (3.1).

(a) Plot showing the variation of  $\log (N(\epsilon ))$ with
 $\log (\epsilon )$, where
 $N(\epsilon )$ is the number of boxes of side length
 $\epsilon$ required to cover the set of points in the basin boundary that intersects with a line segment at
 $x = 1.68$ and
 $-0.4 \leq y \leq 0.4$. The cases shown correspond to the two typical strain rates in figure 15. The black straight lines represent the fitted curves with the specific slopes mentioned. (b) The variation of the dimension
 $D^{(2)}$ with the strain rate
 $s$. All cases here correspond to
 $St = 0.1$ particles in a Kida vortex with
 $r_0 = 0.5$ and
 $\theta _0 = 0$.

Note that the existence of zeros of the Melnikov function is a necessary criterion for chaos but not a sufficient one. Apart from a dense set, the heteroclinic tangles may also result in (i) a countable infinity of periodic orbits with an arbitrarily high period and (ii) an uncountable infinity of periodic orbits (Smale Reference Smale1967). Thus, for our system, whenever it is suspected, the existence of chaos needs to be shown using other methods, like Lyapunov exponents, frequency spectra and Poincaré sections. However, from the investigations of chaotic dynamics of tracers in a Kida vortex (Polvani & Wisdom Reference Polvani and Wisdom1990; Dahleh Reference Dahleh1992; Ngan et al. Reference Ngan, Meacham and Morrison1996; Kawakami & Funakoshi Reference Kawakami and Funakoshi1999), one can assume the same continues to exist for inertial particles until they have the critical inertia value. For further validation, we have evaluated the largest Lyapunov exponent (LLE) of the reduced dynamical system (3.9) to show the existence of chaos for weakly inertial particles and its disappearance for heavy inertial particles. We used the classical algorithm by Benettin et al. (Reference Benettin, Galgani, Giorgilli and Strelcyn1980) for this purpose. For a fixed strain rate of  $s = 10^{-2}$, we evaluated the time variation of the LLE for various
 $St$ values for a point close to the hyperbolic fixed point A of the Kida vortex with
 $r_0 = 0.5$ and
 $\theta _0 = 0$. The results are shown in figure 17. Note that fixed point A periodically changes location as the system changes periodically with time. Thus, we chose the location of point A at
 $t = 0$ to evaluate the Lyapunov exponent. The figure shows that the system has a non-zero positive asymptotic value for the LLE for small values of
 $q$ (or equivalently
 $St$, as
 $St = q \, s$). As
 $q$ increases beyond the first critical value
 $q_{{cr},1} \approx 0.0168$, the variation of the LLE with time does not seem to saturate for large times, which indicates a weakening of chaotic behaviour. Similarly, as
 $q$ further increases to the next critical limit
 $q_{{cr},2} \approx 4.2395$, the LLE asymptotically approaches zero at large times, indicating a complete disappearance of chaos.
The variation of the largest Lyapunov exponent (LLE) with time for a Kida vortex with  $r_0 = 0.5$,
 $\theta _0 = 0$ and
 $s = 10^{-2}$, corresponding to inertial particle trajectories of different
 $q$ (or
 $St$). Note that the case
 $q = 0$ indicates the LLE associated with tracers in the Kida vortex. The initial location of the particle is chosen to be the location of hyperbolic fixed point A at
 $t = 0$.

The critical ratio between  $St$ and
 $s$ for the occurrence of heteroclinic tangles of both
 $H_1^{\pm }$ and
 $H_2^{\pm }$ have been evaluated numerically for various initial aspect ratios (
 $r_0$) of the elliptic vortex and plotted in figure 18. The initial orientation (
 $\theta _0$) of the elliptic vortex will only phase shift the Melnikov functions; thus, these critical values will not be affected. The regions in the parametric plot where the heteroclinic tangles occur are identified and marked. The region above the red curve is where no heteroclinic tangles form, indicating complete suppression of chaos by inertia. However, below the red curve, chaotic transport may occur. The degree of chaos may vary across the blue curve.
(a) The critical curves that demarcate the regions where the heteroclinic tangles can and cannot exist for  $H_1^{\pm }$ and
 $H_2^{\pm }$ are shown in the parameter plot of
 $St/s$ vs
 $r_0$, for a Kida vortex, obtained from the Melnikov analysis. The initial orientation of the Kida vortex
 $\theta _0$ will not affect these curves. (b) Curves in the
 $s - St$ plane demarcate the regions where heteroclinic tangles can and cannot exist for
 $H_p^{\pm }$, for various
 $r_0$ values.

It is important to remember that these critical curves are derived from a perturbative method, assuming both  $St \ll 1$ and
 $s \ll 1$. However, note that the red curve reaches a value of
 $St/s = \textit {O}(10^2)$ when
 $r_0 = 0.1$. For
 $s = \textit {O}(10^{-2})$, this results in the critical
 $St_{{cr},2} \sim 1$. The caveat here is that the Kirchhoff vortex's saddles disappear for
 $St>\mathcal {S}_2$; on the other hand, as mentioned earlier, the Kida vortex itself is elongated and destroyed beyond critical strain rate
 $0.3$. Thus, the validity of our analysis is restricted to sufficiently smaller
 $St$ and
 $s$, although their ratio can vary within the large range as shown in figure 18(a).
3.1.3. Chaotic dynamics far away from the ellipse
Unlike the Kirchhoff vortex, far away from the Kida vortex (distance of  $\textit {O}(s^{-1/2})$), the decaying vortex field and external straining flow can balance each other and form a pair of hyperbolic fixed points/saddles. The saddles remain stationary when observed from the lab reference frame and exhibit counter-rotation when observed from a co-rotating perspective. The snapshots in figure 19 show the evolution of streamlines in the far field of the Kida vortex over a period of revolution of the ellipse for
 $s=0.035$. The saddle points
 $\textrm {A}_p$ and
 $\textrm {B}_p$ are connected by a pair of heteroclinic orbits
 $H_p^{\pm }$ and are perturbed due to the unsteady oscillations of the central ellipse, which is shown to bring chaotic dynamics for fluid tracers, far away from the ellipse (Ngan et al. Reference Ngan, Meacham and Morrison1996; Kawakami & Funakoshi Reference Kawakami and Funakoshi1999). As done in the previous § 3.1.2, we modify the tracer analysis by incorporating the effect of particle inertia. The detailed analysis of evaluating the Melnikov function for
 $H_p^{\pm }$ can be found in Appendix D. However, our findings are similar to the case for
 $H_1^{\pm }$ and
 $H_2^{\pm }$; i.e. finite inertia competes with strain perturbation and suppresses the chaotic transport.
The typical streamlines of the Kida vortex, as observed in a stationary reference frame, show the hyperbolic fixed points far away for (a)  $t = 0$, (b)
 $t = 7$, (c)
 $t = 11$ and (d)
 $t = 27$, shown in grey. The strain rate here is
 $s = 0.035$, and the period of revolution of the ellipse is
 $\approx 29.034$. The rotating ellipse at corresponding instants is shown as the black dashed curve.

Using the Melnikov analysis, the parametric regime in the  $s - St$ plane, where
 $H_p^{\pm }$ can or cannot form a tangle, is identified and illustrated in figure 18(b). For
 $r_0=0.5$ and
 $St = 0.1$, the critical value of the strain rate is found to be
 $s_{{cr},p} \approx 0.0341$, below which particles cannot exhibit chaotic dynamics near
 $H_p^{\pm }$. However, it is important to note a caveat: the Melnikov analysis for
 $H_p^{\pm }$ assumes that
 $St \sim 1$ and
 $s \ll 1$ (see Appendix D); nonetheless, the critical curve in figure 18(b) covers even smaller values of
 $St$.
3.2. Dynamics of inertial particles in a nutating and elongating Kida vortex
So far, we have considered cases of a rotating Kida vortex under a weak pure-strain flow. Here, we discuss the role of a Kida vortex's nutating and elongating configurations on the dispersion of inertial particles. To be consistent with previous results, we consider an elliptical vortex with the same aspect ratio as before, i.e.  $r_0 = 0.5$. With this aspect ratio, it must experience a larger strain rate to exhibit both nutation and elongation. We chose a strain rate of
 $s = 0.2$, with which the vortex can experience nutation if
 $\theta _0 = {\rm \pi}/2$ and elongation if
 $\theta _0 = 0$ (see figure 10). The governing equations (3.4) are solved along with (3.1) numerically for
 $St = 0.1$ particles in both the nutating and elongating cases of the vortex. The particles are initialized randomly in a circular patch with a radius of 2.5 non-dimensional units. The time evolution of the particles is shown in figure 20. It is important to bear in mind that as the study is restricted to a specific strain rate and initial aspect ratio, the results in this section only qualitatively represent the dynamics of inertial particles in a general class of nutating and elongating Kida vortices.
The time evolution of the dispersion of  $2 \times 10^{5}$ inertial particles with
 $St = 0.1$ in a Kida vortex with
 $r_0 = 0.5$ and
 $s = 0.2$ is shown when it exhibits (a–e) nutation (
 $\theta _0 = {\rm \pi}/2$) and ( f–j) elongation (
 $\theta _0 = 0$). The plots are presented in the lab/stationary reference frame (i.e. using
 $x'\unicode{x2013}y'$ coordinates). The grey curves in the background depict the instantaneous streamlines in the lab reference frame, while the black curves represent the instantaneous state of the elliptical vortex. The axes limit for the nutation cases are fixed to
 $[-4, 4]$, while for the elongation case, they are set to
 $[-8, 8]$. For better visualisation, the time stamps in both cases are taken incoherently. Results are shown for (a)
 $t=0$, (b)
 $t=10$, (c)
 $t=50$, (d)
 $t=100$, (e)
 $t=500$, ( f)
 $t=0$, (g)
 $t=5$, (h)
 $t=10$, (i)
 $t=20$, (j)
 $t=40$.

Figure 20(a–e) shows the evolution of inertial particles when the vortex is nutating. It is observed that the straining axes of the background flow carry away the majority of particles far from the central vortex. Additionally, most particles initialized within the vortex are initially centrifuged out and then carried by the straining flow. However, over time, a smaller fraction of particles accumulate in a pair of attractors revolving around the vortex, similar to the case of a rotating Kida vortex (as shown in figure 11). These particles can be seen in figure 20(e) as two small blue dots. Note that these attractors revolve around the central ellipse, even though the ellipse only undergoes periodic oscillations.
Figure 20( f–j) shows the results for the case of an elongating Kida vortex. The ellipse quickly aligns with the extensional axis of the straining flow and so do the particles. All the particles are observed to move along the  $\pm {\rm \pi}/4$ axes. Note that a kink formation occurs in figure 20(i) near the edge of the ellipse. This is because the particles near the ellipse move along with its instantaneous orientation (which is not
 $\pm {\rm \pi}/4$), while the farther particles move along the straining axes (
 $\pm {\rm \pi}/4$) of the background flow. At large times, these kinks disappear (see figure 20j) as the ellipse aligns with the straining axes, and all the particles disperse in the same direction,
 $\theta = \pm {\rm \pi}/4$.
From the previous subsection, we inferred that for a fixed  $St$ case, as
 $s$ increases, the particle dynamics can become chaotic beyond some critical strain rate, as demonstrated by Melnikov analysis – a perturbative analysis. However, for larger strain rates, as in the case here (
 $s = 0.2$), the applicability of Melnikov analysis is questionable. Thus, analysing the system in a large straining regime is analytically challenging and requires a fully numerical approach.
4. Large-time dispersion characteristics of particles
One of the motivations for studying the dynamics of particles embedded in a sea of coherent structures is to learn about their long-time dispersion and the rate of capture. As we have seen in the case of the Kirchhoff vortex, heavy inertial particles can have two fates at large times: those starting within the basin of attraction of a fixed point will get attracted towards the corresponding fixed point, and those starting outside will spiral off to infinity. We can quantify the dispersion of particles using a mean squared distance (MSD),  $\sigma ^2(t) = \langle \lVert \boldsymbol {x}_i(t)-\boldsymbol {x}_i(0) \rVert ^2 \rangle$, which is the average squared distance the particles travelled from their initial location. Here,
 $\langle {\cdot } \rangle$ represents the average taken over all
 $i$, where
 $i$ indicates the index of (a few hundred of) trajectories of particles that started from the same basin. The variation of MSD with time can give information about the nature of dispersion the particle follows. The MSD increasing quadratically with time indicates ballistic dispersion of the particle, while a linear in-time behaviour of the MSD indicates diffusive dispersion of the particle; if the MSD saturates with time, it suggests the particle is attracted to some fixed point and will have limited dispersion. The variation of MSD with time for typical particles in a Kirchhoff vortex is numerically obtained and shown in figure 21(a). The MSD saturates at a large time for particles starting within a basin of attraction (blue curve), indicating the attraction towards the respective fixed point. However, the MSD increases with time, indicating dispersion to infinity for a particle starting outside the basins (black curve). The oscillations in the MSD curves indicate the spiralling nature of trajectories. Despite that, the average growth of the black curve can be shown to scale as
 $\sigma ^2(t) \sim \sqrt {t}$, indicating that the particle dispersion is slower than a diffusive process. The same scaling has already been obtained by Ravichandran et al. (Reference Ravichandran, Perlekar and Govindarajan2014) for the dispersion of inertial particles in a pair of like-signed vortices. In both cases, the particles perceive a point vortex field far away. Appendix E provides a detailed derivation for the scaling.
The variation of MSD (evaluated in a co-rotating frame) with time for typical inertial particles of  $St = 0.5$ starting within and outside the basin of attraction of stable fixed points/limit cycles in (a) Kirchhoff vortex of
 $r = 0.5$ and (b) Kida vortex of
 $r_0 = 0.5$ and
 $s = 0.01$. The scaling behaviour of MSD is shown using dashed lines.

In the case of a Kida vortex, as the fixed points become limit cycles, the corresponding MSD saturates but with sustained periodic oscillations, as shown in figure 21(b) in blue. On the other hand, a particle centrifuged away will be affected by the heteroclinic orbits  $H_p^{\pm }$. These orbits limit the centrifuging, trap the particles along its stable and unstable manifolds, and limit their dispersion. One may remember the far-field attractor mentioned at the beginning of § 3. Since the fixed points
 $\textrm {A}_p$ and
 $\textrm {B}_p$ and the associated heteroclinic connections
 $H_p^{\pm }$ are stationary in the lab reference frame, for a co-rotating observer, this attractor seems to be counter-rotating, as seen in figure 11(e–h). Below the associated critical Stokes number
 $St_{{cr},p}$, the particles may get transported chaotically and above it can be transported regularly near these orbits. However, at large time, the inertial particles can leak near through the saddles
 $\textrm {A}_p$ and
 $\textrm {B}_p$. This behaviour can be either due to the oscillations induced to the particle trajectory by the time-periodic perturbation by the central rotating ellipse or due to the under-damped oscillations of inertial particle trajectories near the stagnation points (Nath et al. Reference Nath, Roy, Govindarajan and Ravichandran2022). The leaked inertial particles are tempted to travel along the extensional axis of the straining flow exponentially with time and, thus, will have an enhanced dispersion later. The situation can be seen in the snapshot in figure 11(h), where the centrifuged inertial particles are aligned along the orbits
 $H_p^{\pm }$; the particle trajectory oscillations near saddles
 $\textrm {A}_p$ and
 $\textrm {B}_p$, and their leakage along the extensional axis can be observed in a co-rotating frame. The black curve in figure 21(b) shows the typical MSD for such particles. Due to the heteroclinic orbit barrier, the particle has a limited dispersion at intermediate times with large amplitude oscillations. At large times, the dispersion becomes exponentially fast (but anisotropic) as they get caught and confined along the unstable manifold of the heteroclinic orbit. This behaviour can be quantified by the scaling relation
 $\sigma ^2(t) \sim \exp (t \, s)$ for small
 $St$.
One may note that at initial times, the dispersion of all particles starting from rest gets centrifuged from the centre, scaling identically as  $\sigma ^2(t) \sim t^4$ (super-ballistic), as illustrated in the figure. This behaviour is identical for both the Kirchhoff and Kida vortex. It occurs due to the constant initial acceleration experienced by the particles initially, akin to the scenario elucidated in Nath et al. (Reference Nath, Roy, Ravichandran and Govindarajan2024b). Since the particles start with zero initial velocity (
 $\boldsymbol {v}(t=0) = \boldsymbol {0}$), (3.3) provides the initial acceleration
 $\boldsymbol {a}_0 = \ddot {\boldsymbol {x}}(t=0) = \boldsymbol {u}(\boldsymbol {x}_0,t=0)/St+\boldsymbol {x}_0\, \varOmega ^2 - \dot {\varOmega } \hat {\boldsymbol {e}}_z\times \boldsymbol {x}_0$, where
 $\boldsymbol {x}_0 = \boldsymbol {x}(t=0)$ denotes the initial particle location. Depending on the particle location, it may undergo an approximately constant initial acceleration contributed by the flow and the centrifugal force in a Kirchhoff vortex and, in addition, the Coriolis force in a Kida vortex. For
 $t \ll 1$, the approximate solution can be obtained as
 $\boldsymbol {x}(t)\approx \boldsymbol {x}_0 + \boldsymbol {a}_0\, t^2/2$. This solution yields
 $\sigma ^2(t) \approx \lvert \boldsymbol {a}_0\rvert ^2\,t^4/4$, i.e.
 $\sigma \sim t^4$ when
 $t \ll 1$.
4.1. Residence time
As shown earlier, in a Kirchhoff vortex, some of the heavy inertial particles can get trapped indefinitely at the fixed points C and D if the Stokes number is below some critical value (see § 2). The remaining particles would be spirally centrifuged away at a rate  $\sigma ^2(t) \sim \sqrt {t\, St}$. However, no other particles, aside from those trapped at fixed points C and D, would get trapped by a Kirchhoff vortex. In the case of a Kida vortex, however, there exists a barrier, or separatrices (
 $H_p^{\pm }$), at the far field (
 $\textit {O}(1/\sqrt {s})$), formed by the balance between the external straining flow and the central vortex (see figure 19). The separatrices act as a natural barrier and prevent any fluid tracer from crossing it. As a result, fluid parcels initialized inside the region bounded by the separatrices remain within it and become effectively trapped. However, in the case of finite inertia, particles can cross these separatrices, destroying the permanent trapping effect (see Nath et al. Reference Nath, Roy, Govindarajan and Ravichandran2022). Nonetheless, it can be expected that once particles reach closer to the separatrices, they can be temporarily trapped or slowed down by these barriers.
To confirm this, we use a quantitative analysis by calculating the residence time ( $T_{res}$) of particles. For any inertial particle in a Kida vortex, we track its dynamics by solving (3.9) and integrating up to
 $1000$ time periods of the vortex revolution. The time taken for the particle to leave a square box of size
 $20 \times 20$ is considered the residence time, as particles that escape this box are expected to travel exponentially fast in a strain-dominant regime. We use
 $11 \times 10^{4}$ regularly arranged particles to obtain the field of
 $T_{res}$, shown in figure 22(a–c) for particles with
 $St = 0.2$ at three different strain rates. The white regions indicate areas of infinite residence time, while the darkest regions indicate the shortest residence time or the quickest escape time. It can be observed that the white regions in the figure resemble the shape of the basins of attractors (fixed points or limit cycles) near C and D. This is expected as they indicate the initial locations of particles that will never leave the
 $20 \times 20$ box. For the smallest value of
 $s = 0.01$, the interior of the separatrices shows a bright yellow region, indicating finite time trapping; but the inertial particles eventually escape as time progresses. As the strain rate increases, the brightness of this interior region reduces, indicating a shorter residence time. It can be seen that there are no white regions other than the basins, indicating that indefinite trapping can only occur near the attractors at C and D. The stable manifolds of the separatrices, extending to infinity, also show a slightly bright yellow colour, indicating that particles near these manifolds can be temporarily trapped. However, no particles, especially those far away, are permanently trapped by any other attractors.
The field of residence time, in logarithmic scale  $\log _{10}(T_{{res}})$, of inertial particles with
 $St = 0.2$ in the neighbourhood of a Kida vortex with
 $r_0 = 0.5$ and
 $\theta _0 = 0$ is shown as a coloured contour plot in the lab reference frame for (a)
 $s = 0.01$, (b)
 $s = 0.02$ and (c)
 $s = 0.035$. The boundary of the initial elliptical vortex patch is depicted as a solid blue curve, while the far-field separatrix at the initial time, separating the interior vortex flow and outer straining flow, is shown as a dashed blue curve. The variation of
 $T_{{res}}$ over a vertical section (shown as a red line in a–c) across the saddle point
 $\textrm {B}_p$ is shown in plots (d), (e) and ( f), respectively, where
 $x' = 0$ for the sections.

In addition, for these same cases, we have also plotted the variation of residence time with a vertical section (i.e. a range of  $y'$ values at a fixed
 $x' = 0$). The sections are shown as red vertical lines passing through the saddle point
 $\textrm {B}_p$ in figure 22(a–c). The corresponding
 $T_{res}$ vs
 $y'$ is shown in figure 22(d–f). The section is subdivided into
 $11 \times 10^4$ uniformly distributed points, and the corresponding residence times of these points are evaluated. It can be observed that, for smaller strain rates, there is a regular increase in
 $T_{res}$ as
 $y'$ approaches the vortex centre (see figure 22d,e). For the larger strain rate
 $s = 0.035$, however, the
 $T_{res}$ shows irregular dependence on
 $y'$, especially within the region bounded by separatrices – another indication of the underlying fractal nature (see figure 22f).
5. Conclusion
We have studied the dispersion of heavy inertial particles in (i) an elliptic Kirchhoff vortex and (ii) a Kida vortex. This study has offered insights into particle transport in 2-D flows relevant to geophysical and astrophysical scenarios, which can be approximated as the resultant flow from isolated vortex patches and their interactions. The Kirchhoff vortex is an elliptic patch that self-rotates and creates an unsteady flow around it. The stability characteristics of the fixed points govern the dynamics of the inertial particles in this flow field. When observed from a co-rotating frame with the vortex, some particles are attracted to stable fixed points in the flow field, while the remaining ones are centrifuged to infinity. The location of the fixed points depends on the inertia of the particles. Thus, in a polydisperse system, each particle will cluster into its own fixed points, which can result in the segregation of particles according to their inertia. A critical Stokes number exists above which all the particles only get centrifuged to infinity.
The introduction of a weak extensional flow to the system (owing to the interaction from other vortices), known as the Kida vortex, disrupts the particle trajectories in the Kirchhoff vortex. Inertial particles in the Kida vortex can have limit cycle trajectories as well as chaotic trajectories in an extended phase space over time. However, a Melnikov analysis revealed that particles with sufficiently high inertia are less prone to chaotic transport.
The present study offers insights into the clustering and dispersion of particles in an ambient vortical flow field. As mentioned earlier, this has been of interest to understanding the trapping of dust, which has the potential for forming planetesimals. However, we have exclusively considered one-way coupling between the particle and fluid phases in the current study. The feedback force from the dispersed phase to the carrier phase can be significant, particularly during the clustering phase. Allowing for two-way coupling introduces additional instabilities, such as streaming instabilities in the context of protoplanetary disks (Youdin & Goodman Reference Youdin and Goodman2005; Youdin & Johansen Reference Youdin and Johansen2007). In the axisymmetric vortex system context, two-way coupling results in the expulsion of particle clumps in a spiralling arm manner, even in the limit of vanishing particle inertia and leads to a dramatic destabilization of an otherwise stable isolated vortex due to a particle-induced baroclinic torque (Shuai et al. Reference Shuai, Dhas, Roy and Kasbaoui2022). As mentioned earlier, a non-axisymmetric vortex system formed by like-signed point vortices exhibits topological and dynamical similarities to the system under consideration. While it is known that like-signed vortex pairs are prone to merging below a critical separation (Griffiths & Hopfinger Reference Griffiths and Hopfinger1987; Dritschel Reference Dritschel2002; Cerretelli & Williamson Reference Cerretelli and Williamson2003), the inclusion of two-way coupling introduces novel vorticity dynamics before their merging (Shuai, Roy & Kasbaoui Reference Shuai, Roy and Kasbaoui2024). At the leading order, momentum coupling from fluid to particle induces clustering dynamics, as demonstrated in this paper. However, once clustering is achieved, the particle concentration at those locations becomes sufficiently high that the feedback from the particle phase to the fluid phase cannot be neglected. A recent study by the authors (see Nath, Roy & Kasbaoui Reference Nath, Roy and Kasbaoui2024a) reiterates the same argument: a dusty simple shear flow is unstable when the dust particles are distributed non-uniformly. In 2-D dusty turbulence, this feedback has produced a non-universal energy spectrum that depends on particle inertia and mass loading (Pandey, Perlekar & Mitra Reference Pandey, Perlekar and Mitra2019). Therefore, it is crucial to approach the results presented in this paper with caution, acknowledging that their applicability may be limited as long as the particle feedback to the fluid is negligible, particularly in a dilute mixture, in the earlier stages of dynamics before particle clustering. After the onset of clustering, the feedback force would alter the morphology of the underlying coherent structures; subsequently, delineating a causal effect between clustering and two-way coupling may become difficult.
While the present study focuses on the transport of very heavy particles, there may be potential applications for studying particle transport in oceanic flows where the particle-to-fluid density ratio is finite. Understanding particles’ dispersion and duration of residence in a region is of immense interest when studied in the oceanic context. Studies on the transport of marine particulate matter often overlook the effects of finite inertia, treating the particles as tracers. Recently, however, the Maxey–Riley equation has been used to study transport in scenarios relevant to oceanic flows, be it in canonical flows like the unsteady double gyres (Sudharsan, Brunton & Riley Reference Sudharsan, Brunton and Riley2016) or the flow field relevant to the feeding of jellyfish (Peng & Dabiri Reference Peng and Dabiri2009). In most of these scenarios, coherent structures dominate the flow field and, thus, play an overarching role in the transport. Accounting for the inertial nature of particles is crucial for understanding the motion of drifting buoys, macroscopic algae or debris, as shown in Miron et al. (Reference Miron, Olascoaga, Beron-Vera, Putman, Triñanes, Lumpkin and Goni2020). Satellite observations show that the transport of floating matter on the ocean surface near coherent eddies is dissipative, contrary to the expected conservative fluid trajectories. Beron-Vera et al. (Reference Beron-Vera, Olascoaga, Haller, Farazmand, Triñanes and Wang2015) have shown that particle inertia effects, rather than the turbulent nature of the background flow, can better explain the divergence of nearby buoy trajectories observed in satellite data. Thus, future studies can explore the trajectories of particles in the vicinity of long-lived coherent structures in the ocean when particle inertia is accounted for in the dynamics, with appropriate modification to the Maxey–Riley equation (Beron-Vera, Olascoaga & Miron Reference Beron-Vera, Olascoaga and Miron2019).
Funding
A.V.S.N. thanks the Prime Minister's Research Fellows (PMRF) scheme, Ministry of Education, Government of India. A.R. acknowledges the funding from the Science & Engineering Research Board (SERB), Government of India (grant number SPR/2021/000536). A.R. and A.V.S.N. acknowledge the support of the Geophysical Flows Lab (GFL) and the Centre for Atmospheric and Climate Sciences (CACS) at IIT Madras.
Declaration of interests
The authors report no conflict of interest.
Appendix A. Governing equations in the co-rotating Cartesian reference frame
The dynamic equations (2.3) governing the transport of heavy inertial particles in the Kirchhoff vortex are obtained from the Maxey–Riley equation (2.2) by writing it in elliptic coordinates ( $\xi, \eta$), which is helpful in analytical exercises. However, for numerical simulations, it is convenient to use these equations in the co-rotating Cartesian reference frame (
 $x,y$), which are
 $$\begin{gather} \dot{v}_x = \frac{u_x-v_x}{St}+x \varOmega^{2}+2 \varOmega v_y, \quad \dot{x} = v_x, \end{gather}$$
 $$\begin{gather}\dot{v}_y = \frac{u_y-v_y}{St}+y \varOmega^{2}-2\, \varOmega\, v_x, \quad \dot{y} = v_y . \end{gather}$$
The flow velocity field in the stationary reference frame can be obtained from the streamfunction as  $u_x' = {\partial \psi '}/{\partial y'}$ and
 $u_y' = -({\partial \psi '}/{\partial x'})$, which is unsteady. The velocity field in the co-rotating frame can be obtained from the following transformation:
 $$\begin{gather} u_x = u_x' \cos \theta + u_y' \sin \theta + \varOmega y, \end{gather}$$
 $$\begin{gather}u_y ={-}u_x' \sin \theta + u_y' \cos \theta - \varOmega x. \end{gather}$$
For the Kirchhoff vortex, we get
 $$\begin{gather} u_x = \left\{ \begin{array}{@{}l@{\quad}l@{}} k^{{-}1}\sin \eta \{-\cosh \xi+(1+k^2 \varOmega)\sinh \xi\}, & \tanh \xi > r,\\ -k \varOmega r^{{-}1}\sinh \xi\sin \eta, & \tanh \xi < r, \end{array}\right. \end{gather}$$
 $$\begin{gather}u_y = \left\{ \begin{array}{@{}l@{\quad}l@{}} -k^{{-}1}\cos \eta \{\sinh \xi+({-}1+k^2 \varOmega)\cosh \xi\}, & \tanh \xi > r,\\ k \varOmega r\cosh \xi\cos \eta, & \tanh \xi < r, \end{array} \right. \end{gather}$$
where the variables in both the coordinate system are related as  $x = k\cosh \xi \cos \eta$ and
 $y = k\sinh \xi \sin \eta$. The dynamical system remains four dimensional; however, now in the phase space of variables
 $x, y, v_x$ and
 $v_y$. The fixed points of the system can be obtained by solving for
 $(\dot {x},\dot {y},\dot {v}_x,\dot {v}_y) = (0,0,0,0)$. Trivially it implies that
 $\bar {v}_x =\bar {v}_y = 0$ and the fixed point positions
 $\bar {\boldsymbol {x}} = (\bar {x},\bar {y})$ are solutions of the vector equation
 $\boldsymbol {u}(\boldsymbol {x})+St\, \varOmega ^2\, \boldsymbol {x} = 0$. Using numerical solvers like ‘fsolve’ in MATLAB or the Newton–Raphson method, one can obtain the fixed points and verify that they exactly match the analytical expressions (2.7). For the Cartesian equations (A1), the entries in the stability matrix will be much simpler than (2.9) and are
 \begin{align} \boldsymbol{\mathsf{J}} &= \begin{pmatrix} 0 & 0 & 1 & 0\\
0 & 0 & 0 & 1\\
\varOmega^2+\dfrac{1}{St} \dfrac{\partial u_x}{\partial x} & \dfrac{1}{St} \dfrac{\partial u_x}{\partial y} & -\dfrac{1}{St} & 2 \varOmega\\
\dfrac{1}{St} \dfrac{\partial u_y}{\partial x} &
\varOmega^2+\dfrac{1}{St} \dfrac{\partial u_y}{\partial y}
& -2 \varOmega & -\dfrac{1}{St} \end{pmatrix} \nonumber\\
&= \begin{pmatrix} 0 & 0 & 1 & 0\\ 0 & 0 & 0 & 1\\
\varOmega^2+\dfrac{h^2\sin 2\eta}{2 k^2 St} &
\dfrac{\varOmega}{St}+\dfrac{2-h^2\sinh 2\xi}{2 k^2 St} &
-\dfrac{1}{St} & 2 \varOmega\\
-\dfrac{\varOmega}{St}+\dfrac{2-h^2\sinh 2\xi}{2 k^2 St} &
\varOmega^2-\dfrac{h^2\sin 2\eta}{2 k^2 St} & -2 \varOmega
& -\dfrac{1}{St} \end{pmatrix}.
\end{align}
Note that the eigenvalues of the Jacobian matrix in (A4) and (2.9) will be the same since they are invariants of the same dynamical system. However, the components of the eigenvectors differ by the coordinate transformation.
Appendix B. Perturbation analysis for the limit cycles for a Kida vortex – entries of  $\boldsymbol{\mathsf{K}}$, $\boldsymbol{\mathsf{L}}$, $\boldsymbol{\mathsf{M}}$ and $N$


The strain perturbation to the system affects the fixed points ( $\bar {\xi },\bar {\eta }$) of a Kirchhoff vortex. Using the method of IJzermans & Hagmeijer (Reference IJzermans and Hagmeijer2006), we assume the fixed points are perturbed to a limit cycle and solve for its coordinates (
 $\bar {\xi }+s\, \xi '(t) + \mathcal {O}(s^2), \bar {\eta }+s\, \eta '(t) + \mathcal {O}(s^2)$) using (3.6). The entries in the coefficient matrices depend on the fixed points of the Kirchhof vortex and are listed below:
 \begin{equation}
\boldsymbol{\mathsf{L}} = \left[ \begin{array}{@{}c@{\quad}c@{}} 1 &
-2 St\, \varOmega_0 \\ 2 St\, \varOmega_0 & 1 \\
\end{array} \right], \quad \boldsymbol{\mathsf{K}} =
\left[ \begin{array}{@{}c@{\quad}c@{}} K_{11} & K_{12} \\ K_{21} & K_{22}
\\ \end{array} \right]\!, \quad \text{and} \quad
\boldsymbol{\mathsf{M}} = \left[ \begin{array}{@{}c@{\quad}c@{}}
M_{11} & M_{12} \\ M_{21} & M_{22} \\ \end{array} \right]\!.
\end{equation}
Outside the ellipse ( $\tanh \xi >r$), corresponding to the fixed points A or B or C or D, denoted as
 $(\bar {\xi },\bar {\eta })$, the elements of
 $\boldsymbol{\mathsf{K}}$,
 $\boldsymbol{\mathsf{M}}$ and
 $N$ are
 $$\begin{gather} K_{11}= \bar{h}^2 \varOmega_0 \left(\sin (2 \bar{\eta})-{\rm e}^{2 \bar{\xi}} St \varOmega_0\right), \end{gather}$$
 $$\begin{gather}K_{12}= \bar{h}^2 \cos (2 \bar{\eta}) \left( \varOmega_0-k_0^{{-}2}\,{\rm e}^{{-}2 \bar{\xi}}\right), \end{gather}$$
 $$\begin{gather}K_{21}= \bar{h}^2 \left( \varOmega_0 \cosh (2 \bar{\xi})-k_0^{{-}2}\,{\rm e}^{{-}2 \bar{\xi}} \cos (2 \bar{\eta})\right), \end{gather}$$
 $$\begin{gather}K_{22}= \bar{h}^2 \varOmega_0 \left( St \varOmega_0 \cos (2 \bar{\eta})-l_1^{{-}1}\,{\rm e}^{{-}2 \bar{\xi}} \sin (2 \,\bar{\eta})\right), \end{gather}$$
 $$\begin{gather}M_{11}= \frac{\bar{h}^2}{4} \left\{\sin (2 \bar{\eta}) ( l_1-\cosh (2 \bar{\xi}))-\, l_3 St \varOmega_0 \sinh (2 \bar{\xi})\right\}, \end{gather}$$
 $$\begin{gather}M_{12}= \frac{\bar{h}^2}{4} \left\{\sinh (2 \bar{\xi}) (\varLambda_0-\cos (2 \bar{\eta}))-2 l_1 St \varOmega_0 \sin(2 \bar{\eta})\right\}, \end{gather}$$
 $$\begin{gather}M_{21}= \frac{\bar{h}^2}{4} \left\{\sinh (2 \bar{\xi}) ( l_1-\cos (2 \bar{\eta}))+ l_3 St \varOmega_0 \sin (2 \bar{\eta})\right\}, \end{gather}$$
 $$\begin{gather}M_{22}={-}\frac{\bar{h}^2}{4} \left\{\sin (2 \bar{\eta}) (\varLambda_0-\cosh (2 \bar{\xi}))+2 l_1 St \varOmega_0 \sinh(2 \bar{\xi})\right\}, \end{gather}$$
 $$\begin{gather}N_1= \frac{\bar{h}^2}{4} \cos (2 \theta_0) \left(2 k_0^{{-}2}\sin (2 \bar{\eta})+ l_3 St \varOmega_0 \sinh (2 \bar{\xi})\right), \end{gather}$$
 $$\begin{gather}N_2= \frac{\bar{h}^2}{4} \cos (2 \theta_0) \left(2 k_0^{{-}2}\,\sinh (2 \bar{\xi})- l_3 St \varOmega_0 \sin (2 \bar{\eta})\right), \end{gather}$$
where  $\bar {h} = (\cosh ^2 \bar {\xi } - \cos ^2 \bar {\eta })^{-1/2}$,
 $l_1 = (1-r_0)/(1+r_0)$ and
 $l_3 = (1-4\, r_0+r_0^2)/(1-r_0^2) = 2\, l_1-\varLambda _0$. Inside the ellipse (
 $\tanh \xi < r$), corresponding to the fixed point at the origin O, the corresponding elements are
 $$\begin{gather} K_{11}= r_0 \varOmega_0, \end{gather}$$
 $$\begin{gather}K_{12} = K_{21}={-}St \varOmega_0^2, \end{gather}$$
 $$\begin{gather}K_{22}={-}\varOmega_0/r_0, \end{gather}$$
 $$\begin{gather}M_{11} = M_{12} = M_{21} = M_{22} = N_1 = N_2 = 0. \end{gather}$$
Appendix C. Terms required for the evaluation of the Melnikov function for weakly inertial particles in a Kida vortex
Outside the ellipse  $\tanh \xi > r_0+s\, r_1+\textit {O}(s^2)$,
 $$\begin{gather} \hat{f}_1 = \frac{h^2}{2} \left(-\varOmega_0+k_0^{{-}2} {\rm e}^{{-}2\xi}\right)\sin 2\eta, \end{gather}$$
 $$\begin{gather}\hat{f}_2 ={-}\frac{h^2}{2} \left(\varOmega_0\sinh 2\xi+k_0^{{-}2} \left[{-}1+{\rm e}^{{-}2\xi}\cos 2\eta \right] \right), \end{gather}$$
 $$\begin{gather}\hat{g}_1 = \frac{h^2}{4} \left\{\mathcal{F}(\xi,\eta;r_0,\varOmega_0 t+\theta_0)- 2 \frac{\varOmega_0}{r_0} r_1\,\left( l_1-l_2{\rm e}^{{-}2\xi}\right)\sin 2\eta \right\}, \end{gather}$$
 $$\begin{gather}\hat{g}_2 = \frac{h^2}{4} \left\{\mathcal{G}(\xi,\eta;r_0,\varOmega_0\, t+\theta_0)- 2 \frac{\varOmega_0}{r_0} r_1\,\left( l_1\sinh 2\xi+l_2[{-}1+{\rm e}^{{-}2\xi}\cos 2\eta]\right)\right\}, \end{gather}$$
 $$\begin{gather}\hat{\phi}_1 = h^2\,k_0^{{-}2}\,{\rm e}^{{-}2\xi} \left( k_0^{{-}2}-\varOmega_0\cos 2\eta\right), \end{gather}$$
 $$\begin{gather}\hat{\phi}_2 ={-}h^2\,k_0^{{-}2}\,{\rm e}^{{-}2\xi}\varOmega_0\,\sin 2\eta. \end{gather}$$
Inside the elliptic region  $\tanh \xi < r_0+s r_1+\textit {O}(s^2)$,
 $$\begin{gather} \hat{f}_1 = \frac{h^2}{2} \left(-\varOmega_0+\frac{1}{2}\left\{ 1-l_1\cosh 2\xi\right\}\right)\sin 2\eta, \end{gather}$$
 $$\begin{gather}\hat{f}_2 = \frac{h^2}{2} \left(-\varOmega_0+\frac{1}{2}\left\{ 1-l_1\cos 2\eta\right\}\right)\sinh 2\xi, \end{gather}$$
 $$\begin{gather}\hat{g}_1 = \frac{h^2}{4} \left\{\mathcal{F}(\xi,\eta;r_0,\varOmega_0 t+\theta_0)- 2\frac{\varOmega_0}{r_0} r_1\left( l_1-\cosh 2\xi\right)\sin 2\eta \right\}, \end{gather}$$
 $$\begin{gather}\hat{g}_2 = \frac{h^2}{4} \left\{\mathcal{G}(\xi,\eta;r_0,\varOmega_0\, t+\theta_0)- 2\frac{\varOmega_0}{r_0} r_1\left( l_1-\cos 2\eta\right)\sinh 2\xi \right\} , \end{gather}$$
 $$\begin{gather}\hat{\phi}_1 = \frac{h^2l_1}{2}\,\sinh 2\xi \left( k_0^{{-}2}-\varOmega_0\cos 2\eta\right), \end{gather}$$
 $$\begin{gather}\hat{\phi}_2 ={-}\frac{h^2 l_1}{2}\,\sin 2\eta\left( k_0^{{-}2}-\varOmega_0\cosh 2\xi\right), \end{gather}$$
where  $l_2 = (1+r_0^2)/(1-r_0)^2$. The functions
 $\mathcal {F}$ and
 $\mathcal {G}$ are defined as
 $$\begin{align} \mathcal{F}(\xi,\eta;r,\theta) &= \cosh 2\xi\sin 2\eta\cos 2\theta+\sinh 2\xi\cos 2\eta\sin 2\theta \nonumber\\ &\quad-\varLambda \left( \sin 2\eta\cos 2\theta+\sinh 2\xi\sin 2\theta\right), \end{align}$$
 $$\begin{align} \mathcal{G}(\xi,\eta;r,\theta) &= \sinh 2\xi\cos 2\eta\cos 2\theta-\cosh 2\xi\sin 2\eta\sin 2\theta\nonumber\\&\quad+\varLambda \left( \sin 2\eta\sin 2\theta-\sinh 2\xi\cos 2\theta\right). \end{align}$$
Expressions for  $\hat {f}_1$ to
 $\hat {g}_2$ for a Kida vortex of
 $\theta _0 = {\rm \pi}/4$ can also be found in Kawakami & Funakoshi (Reference Kawakami and Funakoshi1999), but with a sign mistake in
 $l_1$ and
 $l_2$.
Appendix D. Evaluation of the Melnikov function in the far field of a Kida vortex
The streamfunction for a Kida vortex in the stationary reference frame ( $\psi ' = \psi '_v+\psi '_e$) can be written in the far field (far from the central elliptic vortex) using polar coordinates as
 \begin{equation} \psi' ={-}\frac{1}{2} \log R-\frac{s R^2}{4}\cos 2\varTheta -\frac{k^2}{16 R^2}\cos (2 \varTheta-2 \theta)+\textit{O}(R^{{-}4}), \end{equation}
where the Cartesian coordinates in stationary frame  $(x',y')$ are related to the polar coordinates in stationary frame
 $(R,\varTheta )$ as
 $x' = R\cos \varTheta$ and
 $y' = R\sin \varTheta$. The dominant point vortex field balances with external straining to create an integrable system far field. However, the central rotating ellipse induces a time-periodic perturbation to this system. We rescale radial and time coordinates with strain rate such that the balance between the point vortex and extensional flow is apparent and the perturbation due to the elliptic vortex is clearly visible. Following Kawakami & Funakoshi (Reference Kawakami and Funakoshi1999), the appropriate scaling is
 $\tilde {R} = R \sqrt {s}$,
 $\tilde {t} = t s$, which will reduce (D1) to the streamfunction in scaled variables as
 \begin{equation} \psi' ={-}\frac{1}{2} \log \tilde{R}-\frac{ \tilde{R}^2}{4}\cos 2\varTheta -\frac{s\, k^2}{16 \tilde{R}^2}\cos (2 \varTheta-2 \theta)+\textit{O}(s^2). \end{equation}
The first two terms on the right-hand side indicate the integrable system formed by the point vortex and the extensional flow. The streamlines of this Hamiltonian system are shown in figure 23, along with the heteroclinic orbits  $H_p^{\pm }$ and far-field fixed points
 $\textrm {A}_p$ and
 $\textrm {B}_p$ as marked. Observe the similarity of the far-field streamlines to the snapshots in figure 19. The third term on the right-hand side is the perturbation due to the central rotating elliptic vortex patch. Using the slow manifold equations for inertial particles in the stationary reference frame,
 $$\begin{gather} \dot{x}' = u_x'-St \left[\frac{\partial u_x'}{\partial t}+u_x' \frac{\partial u_x'}{\partial x'}+u_y' \frac{\partial u_x'}{\partial y'} \right]+\textit{O}(St^2), \end{gather}$$
 $$\begin{gather}\dot{y}' = u_y'-St \left[\frac{\partial u_y'}{\partial t}+u_x' \frac{\partial u_y'}{\partial x'}+u_y' \frac{\partial u_y'}{\partial y'} \right]+\textit{O}(St^2), \end{gather}$$
we may write the modified kinematic equations for a particle in polar coordinates as
 $$\begin{align} \dot{R} &= \frac{1}{R} \frac{\partial \psi'}{\partial \varTheta}+\frac{St}{R} \left\{\! -\frac{\partial^2 \psi'}{ \partial \varTheta \partial t}+\left(\!\frac{\partial \psi'}{\partial R}\!\right)^2+\frac{1}{R} \left[\!\frac{\partial^2 \psi'}{\partial \varTheta^2} \frac{\partial \psi'}{\partial R}-\frac{\partial^2 \psi'}{\partial R\, \partial \varTheta} \frac{\partial \psi'}{\partial \varTheta}\!\right]+\frac{1}{R^2}\, \left(\!\frac{\partial \psi' }{\partial \varTheta}\!\right)^2\!\right\} \nonumber\\ &\quad+\textit{O}(St^2), \end{align}$$
 $$\begin{align}\dot{\varTheta} &={-}\frac{1}{R} \frac{\partial \psi'}{\partial R}+\frac{St}{R} \left\{ \frac{\partial^2 \psi'}{ \partial R\, \partial t}+\frac{1}{R}\, \left[\frac{\partial^2 \psi'}{\partial R^2}\frac{\partial \psi'}{\partial \varTheta}-\frac{\partial^2 \psi'}{\partial R \partial \varTheta} \frac{\partial \psi'}{\partial R}\right]+\frac{1}{R^2} \frac{\partial \psi' }{\partial \varTheta}\, \frac{\partial \psi' }{\partial R}\right\} \nonumber\\&\quad+\textit{O}(St^2). \end{align}$$
After substituting the small  $s$ expansion of
 $k$ and
 $\theta$ (see § 3.1.1) in (D4), evolution equations for the scaled coordinates can be obtained as
 $$\begin{gather} \frac{{\rm d} \tilde{R}}{{\rm d} \tilde{t}} = \tilde{f}_1 + s \left\{\tilde{g}_1+ St \tilde{\phi}_1 \right\}+\textit{O}(s^2, St^2 s, s^2\, St), \end{gather}$$
 $$\begin{gather}\frac{{\rm d} \varTheta}{{\rm d} \tilde{t}} = \tilde{f}_2 + s \left\{\tilde{g}_2+ St \tilde{\phi}_2 \right\}+\textit{O}(s^2, St^2\, s, s^2\, St), \end{gather}$$
where
 $$\begin{gather} \tilde{f}_1 = \frac{\tilde{R}}{2}\sin 2\varTheta, \end{gather}$$
 $$\begin{gather}\tilde{f}_2 = \frac{1}{2 \tilde{R}^2}+\frac{1}{2}\cos 2\varTheta, \end{gather}$$
 $$\begin{gather}\tilde{g}_1 = \frac{ k_0^2}{8 \tilde{R}^3}\sin(2 \varTheta-2 \theta_0-2\, \varOmega_0 \tilde{t}/s), \end{gather}$$
 $$\begin{gather}\tilde{g}_2 ={-} \frac{ k_0^2}{8 \tilde{R}^4}\cos(2 \varTheta-2 \theta_0-2 \varOmega_0 \tilde{t}/s), \end{gather}$$
 $$\begin{gather}\tilde{\phi}_1 = \frac{1}{4 \tilde{R}^3} \left\{1-\tilde{R}^4+k_0^2 \varOmega_0\cos(2 \varTheta-2 \theta_0-2 \varOmega_0 \tilde{t}/s)\right\}, \end{gather}$$
 $$\begin{gather}\tilde{\phi}_2 = \frac{1}{2 \tilde{R}^2} \left\{\sin 2\varTheta+\frac{k_0^2\, \varOmega_0}{2 \tilde{R}^2}\sin(2 \varTheta-2 \theta_0-2 \varOmega_0 \tilde{t}/s)\right\}. \end{gather}$$
Note that the above system of equations reduces to the form given in Kawakami & Funakoshi (Reference Kawakami and Funakoshi1999) for the case of  $St = 0$ and
 $\theta _0 = 0$ (with a sign mistake in
 $\tilde {g}_1$ and
 $\tilde {g}_2$). For
 $s \ll 1$ and
 $St \ll 1$, the Melnikov function associated with the far-field hyperbolic fixed points
 $\textrm {A}_p$ and
 $\textrm {B}_p$ can be evaluated as
 $$\begin{gather}
M_p^{{\pm}}(\phi,s) =
\int_{-\infty}^{\infty}\left[\tilde{f}_1(\tilde{R}_0^{{\pm}}(\tilde{t}),\varTheta_0^{{\pm}}(\tilde{t}))
\left\{\tilde{g}_2\left(\tilde{R}_0^{{\pm}}(\tilde{t}),\varTheta_0^{{\pm}}(\tilde{t});\frac{\tilde{t}}{s}+\phi\right)\right.\right.\left.+St
\tilde{\phi}_2\left(\tilde{R}_0^{{\pm}}(\tilde{t}),\varTheta_0^{{\pm}}(\tilde{t});\frac{\tilde{t}}{s}+\phi\right)\right\}\nonumber\\
-\tilde{f}_2(\tilde{R}_0^{{\pm}}(\tilde{t}),\varTheta_0^{{\pm}}(\tilde{t}))\left.\left\{\tilde{g}_1\left(\tilde{R}_0^{{\pm}}(\tilde{t}),\varTheta_0^{{\pm}}(\tilde{t});\frac{\tilde{t}}{s}+\phi\right)+St\,
\tilde{\phi}_1\left(\tilde{R}_0^{{\pm}}(\tilde{t}),\varTheta_0^{{\pm}}(\tilde{t});\frac{\tilde{t}}{s}+\phi\right)\right\}\right]{\rm e}^{-\int_0^{\tilde{t}} \textrm{tr}({\rm
D}\tilde{f})\,{\rm d}t'}\, {\rm d}\tilde{t},
\end{gather}$$
where the integration is performed along the heteroclinic orbits  $H_p^{\pm }$ of the unperturbed integrable system parametrised by
 $(\tilde {R}_0^{\pm }(\tilde {t}),\varTheta _0^{\pm }(\tilde {t}))$. Here
 \begin{equation} \textrm{tr}({\rm D}\tilde{f}) = \frac{\partial \tilde{f}_1}{\partial \tilde{R}}+\frac{\partial \tilde{f}_2}{\partial \varTheta} ={-}\frac{1}{2}\sin 2\varTheta \end{equation}
is the trace of the Jacobian matrix of the unperturbed system, which is not zero in general. From (D7), one can infer that  $M_p^{\pm }$ is periodic in
 $\phi$ with period
 ${\rm \pi} /\varOmega _0$. Unlike
 $M_1^{\pm }$ and
 $M_2^{\pm }$,
 $M_p^{\pm }$ has explicit dependency on the strain rate
 $s$. However, it does not affect the validity of the Melnikov analysis and related theorems as stated by Kawakami & Funakoshi (Reference Kawakami and Funakoshi1999). The variation of the Melnikov function
 $M_p^{\pm }$ with
 $\phi$ for various
 $s$ values for
 $St=0.1$ particles in a Kida vortex is shown in figure 24. Since
 $M_p^{\pm }$ depends on
 $s$ implicitly, it will result in a nonlinear relation between the critical values of
 $s$ and
 $St$, as can be seen in figure 18(b).
The streamlines of the flow-field result from the balance between the irrotational (point) vortex and external extensional flow. The flow pattern mimics the far-field flow around a Kida vortex (cf. figure 19). The hyperbolic fixed points and connecting heteroclinic orbits are marked.

The Melnikov function  $M_p^+$ corresponding to a Kida vortex of
 $r_0 = 0.5$ and
 $\theta _0 = 0$ for particles of
 $St = 0.1$ is plotted against
 $\phi$ for different values of strain rate
 $s$. The abscissa is shown as a dashed-dotted line to identify the zeros of the Melnikov function.

Appendix E. Scaling law for large-time dispersion with time
The inertial particles centrifuged away to infinity by the Kirchhoff vortex spiral outward and form a ring-like structure, as we see in the simulation result (figure 2). At large times, these particles reach far away from the central ellipse. Thus, the background flow they perceive can be approximated to that created by an irrotational vortex (point vortex). Using the polar coordinates  $(R,\varTheta )$ about the origin, the flow field for the point vortex can be represented in stationary frame as
 \begin{equation} U_R = 0, \quad U_{\varTheta} = \frac{1}{2 R}. \end{equation}
Then, the dynamics of a heavy inertial particle in the point vortex is given by the Maxey–Riley equations in polar coordinates as (see Ravichandran & Govindarajan Reference Ravichandran and Govindarajan2015)
 $$\begin{gather} \dot{v}_R +\frac{v_R}{St} =\frac{v_{\varTheta}^2}{R}, \quad \dot{R} = v_R, \end{gather}$$
 $$\begin{gather}\dot{(R v_{\varTheta})} + \frac{R v_{\varTheta}}{St}=\frac{R\, U_{\varTheta}}{St}, \quad \dot{\varTheta} = \frac{v_{\varTheta}}{R} . \end{gather}$$
Solving the first equation among (E2b) along with (E1) yields the azimuthal velocity of the particle as
 \begin{equation} v_{\varTheta} = \frac{1}{2 R}(1+C_1 {\rm e}^{{-}t/St}), \end{equation}
where  $C_1$ is an integration constant. The form of the solution says that the azimuthal velocity of the particle approaches that of fluid tracers at a large time, i.e.
 $v_{\varTheta } = U_{\varTheta }$ as
 $t \rightarrow \infty$. Substituting this result in (E2a) and solving for
 $R$ asymptotically (
 $\dot {v}_R \ll v_R$) yields, at large time
 $R(t) \sim (t\, St)^{1/4}$. i.e. in terms of the dispersion parameter MSD,
 $\sigma ^2(t) = \langle R(t)^2 \rangle \sim \sqrt {t\, St}$ at large time.
The same scaling law can also be obtained from an analysis using the method of characteristics for the evolution of the number density field of particles. The single fluid model is an Eulerian model for particle-laden flows, where the suspended particles are treated as a field, characterized by their number density. The model is valid if the particles are only weakly inertial and their concentration is just right. The model yields the evolution equation for the axisymmetric number density field  $n(t,R)$ as
 \begin{equation} \frac{\partial n}{\partial t}+\frac{St}{R}\, \frac{\partial}{\partial R}(U_{\varTheta}^2\, n) = 0. \end{equation}
The solution for this partial differential equation in a point vortex field (E1) can be obtained using the method of characteristics as
 \begin{equation} n(t,R) =
\frac{R^2}{\sqrt{R^4-t\, St}}\, n_0(\{R^4-t\, St\}^{1/4}),\end{equation}
where  $n(0,R)=n_0(R)$ is the initial number density distribution. Note that the scaling
 $R^4 \sim t\, St$ automatically appears in this solution.


 Open access

