INTRODUCTION
It is widely acknowledged that seed dispersal plays a pivotal role in the structuring of plant communities, as it constitutes the ‘demographic bridge linking the end of the reproductive cycle in adult plants with the establishment of their offspring’ (Wang & Smith Reference WANG and SMITH2002). Seed dispersal may enhance plant fitness by helping propagules to escape from attack by host-specific pests and pathogens (Connell Reference CONNELL, Boer and Gradwell1971, Janzen Reference JANZEN1970), by increasing their likelihood to reach high-quality microsites for establishment (Howe & Smallwood Reference HOWE and SMALLWOOD1982) or by enhancing germination rates (Stevenson et al. Reference STEVENSON, CASTELLANOS, PIZARRO and GARAVITO2002, Traveset Reference TRAVESET1998). Because more than 70% of tropical forest tree species are predominantly dispersed by animals (Muller-Landau & Hardesty Reference MULLER-LANDAU, HARDESTY, Burslem, Pinard and Hartley2005), understanding the role of frugivores in successful plant recruitment is critical to reaching a synthetic understanding of the regeneration process.
The effectiveness of frugivores as dispersal agents has been typically measured by the contribution of various frugivore-related variables to seedling recruitment (Schupp et al. Reference SCHUPP, JORDANO and GÓMEZ2010). Among these, tree fecundity is a major determinant of seed availability, and influences frugivore visitation and removal rates, which may have critical impacts on seed dispersal (Clark et al. Reference CLARK, POULSEN, CONNOR and PARKER2004). Likewise, the identity of the dispersal agent contributes to shaping species’ seed shadows and therefore sets the stage for potential seedling distribution (Clark et al. Reference CLARK, POULSEN, BOLKER, CONNOR and PARKER2005). Seed size is also a pivotal trait in the regeneration process as it can determine the dispersal vector (Clark et al. Reference CLARK, POULSEN, BOLKER, CONNOR and PARKER2005), and represents important trade-offs between fecundity, dispersal and seedling survival (Leishman et al. Reference LEISHMAN, WRIGHT, MOLES, WESTOBY, FENNER and Fenner2000). Although these factors are determinant during the seed-to-seedling transition (Schupp et al. Reference SCHUPP, JORDANO and GÓMEZ2010), few studies have shown their long-term effects on plant persistence. For instance, large seeds typically improve chances of survival for newly established individuals in adverse conditions, but this advantage is likely to be lost beyond the seedling stage (Moles & Westoby Reference MOLES and WESTOBY2006). Likewise, the beneficial effects of dispersal far from the parental trees may vanish from changes in species habitat association throughout plant ontogeny (Comita et al. Reference COMITA, CONDIT and HUBBELL2007a, Webb & Peart Reference WEBB and PEART2000). Because of such potential life-stage conflicts, it is critical to assess the importance of frugivore-related variables across different ontogenetic stages in order to understand the overall effectiveness of seed dispersal (Schupp et al. Reference SCHUPP, JORDANO and GÓMEZ2010).
If frugivores and their interaction with plants underpin the natural regeneration of a vast number of tree species in tropical forests, one might expect that frugivore-related variables ultimately influence species abundance. This relationship should be stronger at the earliest life-stages, as seedlings better reflect the footprint of dispersal events. Species abundance in small-sized individuals, however, is also likely to be tightly related to the abundance of reproductive adults (Comita et al. Reference COMITA, AGUILAR, PÉREZ, LAO and HUBBELL2007b). Understanding the relative importance of these factors depends upon the scale considered. At very fine scales, for instance, seedling clumping is likely to be the outcome of clustered seed deposition (Nathan & Muller-Landau Reference NATHAN and MULLER-LANDAU2000). Yet, locally high seedling abundance is not enlightening about the overall recruitment success of a species. The signature of frugivores on plant recruitment may be more conspicuous at large spatial scales, as animals typically move across wide ranges, thereby affecting species abundance at the population level (Stevenson et al. Reference STEVENSON, CASTELLANOS, PIZARRO and GARAVITO2002). In contrast, the effect of tree species abundance on recruitment is expected to be stronger at local scales, as sites underneath the parent canopy typically exhibit low recruitment probability due to negative density dependence (NDD; Comita et al. Reference COMITA, CONDIT and HUBBELL2007a). As NDD shapes the spatial distribution of species throughout ontogeny, skewness away from parental trees should become stronger at later stages (Comita et al. Reference COMITA, CONDIT and HUBBELL2007a).
Here, we test these scenarios on a subset of 18 tree species across two life stages, and at three different spatial scales. To do so, we combine single-time census data from trees, saplings and seedlings with a valuable dataset based upon several years of research on plant–animal interactions in a Colombian lowland rain forest (Stevenson Reference STEVENSON2004a, Reference STEVENSON2004b, Reference STEVENSON, Dennis, Schupp, Green and Westcott2007). We hypothesize that, if frugivores do influence tree species recruitment, frugivore-related variables should show a strong relationship with the abundance of small-sized individuals, particularly at the earliest life stages and at large scales. Alternatively, if frugivores are irrelevant during tree species regeneration, seedling and sapling abundance will mainly depend on tree species abundance, particularly at local scales.
MATERIALS AND METHODS
Study site
This study was conducted in a tropical lowland forest on the eastern border of Tinigua National Park, on the western margin of the Rio Duda (Eastern Colombia; 2o37′2′′N, 74o2′28′′W, 350–400 m asl). The region is dominated by mature forests growing on rolling hills, with river-formed floodplains in the flatlands. Mature forests are characterized by a continuous canopy and intermediate levels of tree species diversity. Floodplains have an open canopy, frequent tree-fall gaps and low diversity. Average annual rainfall is 2800 mm, with a dry season from December to February, and mean annual temperature is 25ºC (Stevenson et al. Reference STEVENSON, QUIÑONES and AHUMADA2000). The species richness and biomass of ripe fruits belonging to animal-dispersed species peaks in April–May, during the rainy season, and is minimal between October and December.
Tree, sapling and seedling censuses
Four 1-ha plots subdivided in 10 × 10-m quadrats were established between 2000 and 2002. The plots were randomly located in an area of terra firme forests. The mean distance between plots was 569 m (range: 367–1000 m). In each plot, all stems ≥ 10 cm diameter at breast height (dbh), including trees and palms, were tagged, measured for dbh and identified to species or morphospecies. Lianas were excluded from the censuses. Vouchers were collected for each species, and identified at several herbaria in Colombia and the United States (Colombian National Herbarium, Colombian Amazonian Herbarium, New York Botanical Garden, Missouri Botanical Garden). The four plots contained 5355 trees belonging to 390 species distributed over 230 genera and 73 families.
In the south-east corner of each 10 × 10-m quadrat of each 1-ha plot, we established a 5 × 5-m sapling quadrat where all individuals 1–5 cm dbh were censused. In the same corner of each 10 × 10-m quadrat, we nested a 2 × 2-m seedling quadrat, where we censused all individuals <1.7 m tall and <1 cm dbh. We avoided germination peaks by performing the seedling census during the dry season (between December and March). We did not include newly recruited seedlings, as their first-year survival probability is very low and they might not be representative of the seedling assemblage (Metz et al. Reference METZ, SOUSA and VALENCIA2010). Established seedlings were distinguished from newly recruited ones by their greater size, the presence of true leaves, and the overall shape of the seedling. The quadrats belonging to the external 10 × 100-m bands of each 1-ha plot were excluded, as we could not accurately evaluate the abundance of trees of the focal species in the neighbourhood of these locations. Quadrats were omitted in locations with prominent trails (one plot) and where local topographic accidents such as landslides or big rocks biased plant inventories (two plots). Thus, the number of quadrats was 52, 59, 64 and 59 in each of the four 1-ha plots, respectively. Overall, we marked 6155 seedlings and 3704 saplings belonging to 350 species distributed over 204 genera and 69 families.
Species selection and frugivore-related data
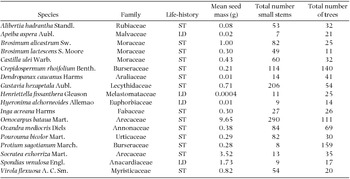
Several years of research in plant–animal interactions in the study area resulted in a valuable dataset combining data on seed size, fruit production and frugivore feeding for over 80 tree species. Our study focuses on the 18 species that had at least 10 individuals ≥ 10 cm dbh across all four plots, and for which we had data on seed size, fruit production and on the frugivore assemblage that visited each tree species. Together, these are the most abundant animal-dispersed tree species in the study area, and accounted for approximately 17% of all the stems ≥ 10 cm dbh censused across the four 1-ha plots. The study species are reported in Table 1.
Study species characteristics at the Tinigua National Park, Colombia. Reported are species name and family, species life-histories (ST: shade-tolerant, and LD: light demanding), mean seed mass, and the total number of trees, and small-sized stems (seedlings and saplings combined) across the four 1-ha plots.

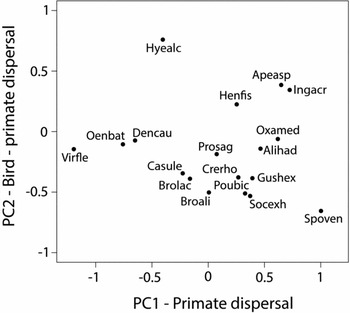
Frugivory data were collected by continuous observations on fruiting trees between 1999 and 2001 (Stevenson Reference STEVENSON, Dennis, Schupp, Green and Westcott2007). We observed a selection of 3–5 trees per species that had good crown visibility during periods of ripe fruit production between 6h00 and 10h00. For each visit, we recorded the identity of the dispersal agent, the duration of the visitation and feeding rates. For primates, feeding rates were taken as the total number of fruits manipulated during periods of 30 s when the focal animal was clearly visible. For birds, focal sampling was set to periods of 10 s. Visitation rates were calculated as the percentage of time that frugivores spent on the trees consuming fruits during the observation time. If different individuals overlapped in their feeding time, the time spent consuming fruits was counted for each one of them, so that visitation rates were > 100% in several cases. To associate specific dispersal vectors to each tree species, we performed a principal component analysis (PCA) based on feeding and visitation rate data, where all variables were previously standardized. Since frugivore activity was monitored during the day, bats were not included in this analysis. Although bats play a key role as seed dispersers, the bat community in the study area is dominated by small frugivorous specialized in consuming fruits of the genera Cecropia, Piper and Ficus (Rojas et al. Reference ROJAS, CADENA and STEVENSON2004). Thus, their omission from our dataset is unlikely to bias our estimates of the importance of the different frugivores for each of the study species. For each tree species, we had data on the frugivore assemblage (columns) that visited each tree species (rows). Mean feeding and visitation rates were then calculated for each trees species and each frugivore species. The output of this analysis summarized the importance of each frugivore for each tree species (Figure 1).
PCA illustrating the importance of the different frugivores occurring at the Tinigua National Park (Colombia) for the dispersal of each of the 18 tree species studied, based on feeding and visitation rates data. The first PCA axis discriminated the importance of the different primates, with low values reflecting high dispersal rates by Ateles belzebuth, and high values reflecting high dispersal rates by Lagothrix lagothricha. The second PCA axis distinguished dispersal by primates (low values) from dispersal by birds (high values). These two axes explained 69% of the variance in frugivore data. Axis 1 is referred to ‘Primate dispersal’ and axis 2 as ‘Bird–primate dispersal’. Species abbreviations correspond to the first three letters of the genus and species given in Table 1. Although several species cluster near the origin of the ordination space, there is a gradient of species along both axes, indicating that fruit consumers show certain preferences towards different fruits.

The first PCA axis discriminated the importance of the different frugivorous primates occurring in the area for the dispersal of each tree species, with low values reflecting high dispersal rates by the spider monkey (Ateles belzebuth), and high values reflecting high dispersal rates by the woolly monkey (Lagothrix lagothricha). These are the two main large primates in the study area, and are responsible for dispersing an important fraction of seeds (Stevenson Reference STEVENSON, Dennis, Schupp, Green and Westcott2007). The second PCA axis distinguished dispersal by primates (low values) from dispersal by birds (high values). In all subsequent analyses, we used the scores of these two axes, which together explained 69% of the variance in frugivore data. Henceforth, we refer to them as ‘Primate dispersal’ (axis 1) and ‘Bird-primate dispersal’ (axis 2). As Figure 1 shows, several species cluster near the origin of the ordination space, indicating that a few tree species are not specifically associated with a particular dispersal vector. However, there is a gradient of species along both axes, indicating that fruit consumers show certain preferences towards different fruits, and supporting previous knowledge about fruit consumers’ preferences in the study area (Stevenson et al. Reference STEVENSON, QUIÑONES and AHUMADA2000).
We estimated fruit production by monitoring phenological transects totalling 5.6 km twice a month, and looking for fruits or fruit fragments on the floor (Stevenson Reference STEVENSON2004b). For all trees with dbh > 5 cm within these transects, we estimated crop size visually by estimating the number of fruits on one branch and then multiplying this number by the number of branches in the tree. Because visual counts from the ground tend to underestimate the actual number of fruits, we corrected these estimates using supplementary information based on seed traps placed under the crowns of several tree species (Stevenson Reference STEVENSON2004b). To estimate fruit production, we calculated the average dry weight of fruits and seeds for all species in the transects by weighing 5–10 fruits from each individual. We then multiplied fruit weight by the corrected crop size to obtain the total biomass of fruit produced by each individual (summed over all the trees of the same species).
Finally, data on seed mass were obtained from an average of 10 seeds for each species, collected from different individuals (Stevenson Reference STEVENSON2004a). Although the seeds did not come from individuals in different populations, fruit traits are known to show low intraspecific variation compared with interspecific variation (Westoby et al. Reference WESTOBY, LEISHMAN and LORD1996).
Statistical analyses
To predict the species abundance of seedlings and saplings from tree species abundance and frugivore-related variables, we used generalized linear models assuming a negative binomial error distribution because our data were overdispersed (variance > mean). We predicted seedling and sapling densities at three different spatial scales: across all four plots (henceforth across-plots scale), at the whole-plot level (henceforth plot-level scale) and within plots (henceforth within-plot scale). The frugivore-related explanatory variables were: seed size, fruit production, the identity of the dispersal vectors (‘Primate dispersal’ PC axis 1, and ‘Bird-primate dispersal’ PC axis 2), and the interaction between seed size and the identity of the dispersal vectors. Since we included interaction terms, we centred the values of these independent variables (mean = 0) to increase interpretability in the parameter estimates (Sokal & Rohlf Reference SOKAL and ROHLF1995).
At the across-plots scale, we used generalized linear models to predict total species abundance of seedlings and saplings across plots from total tree species abundance across plots and from the frugivore-related predictors (N = 18, the number of species). We also included total species abundance of seedlings as a predictor in the sapling model because seedling assemblages are likely to be a good representation of future sapling assemblages, and we therefore expected seedling and sapling abundances to be correlated. Because the sampling effort for seedlings and saplings within plots was uneven among plots, we performed a procedure similar to the rarefaction method, where 52 quadrats (the minimum number of quadrats per plot) were randomly resampled 1000 times at each plot. For each iteration, we calculated the total number of seedlings/saplings in the 52 randomly selected quadrats, and the median of these values was then selected as the total number of seedlings/saplings for each plot. We added these values to obtain the total number of seedlings/saplings across plots for each study species.
At the plot-level and within-plot scales, we scaled-up the relationship between the dependent variables and tree species abundance in order to have a better understanding of the effect of tree species abundance on plant recruitment across scales. Because frugivory data were species-based and were not spatially explicit, the frugivore-related predictors were the same across scales. Thus, we had one value per species for the frugivore-related variables and multiple values per species for seedling, sapling and tree abundances. To deal with this issue, we used multilevel/hierarchical models adapted for nested data (Gelman & Hill Reference GELMAN and HILL2006). Analysing data structured in hierarchical groups using single-level analysis techniques violates the assumption of independence, and ignores potential meaningful variability in the data, thereby underestimating the standard errors and inflating of type I error rates. Multilevel analysis differs from the classic, single-level approach in that it allows the simultaneous examination of the effects of group-level and individual-level predictors, and accounts for the non-independence of observations within groups. In other words, this technique examines both inter-individual and inter-group variation, as well as the contributions of individual-level and group-level variables to this variation (Appendix 1). Also, sample size at the higher levels has a greater influence than sample size at lower levels. Multilevel modelling therefore estimates multiple error terms simultaneously without inflating type I errors (Diez-Roux Reference DIEZ-ROUX2000, Gelman & Hill Reference GELMAN and HILL2006).
At the plot-level scale, we related the number of seedlings/saplings per species in each 1-ha plot to the following fixed effects: the number of trees per species in each plot, the number of seedlings per species if the dependent variable was the number of saplings, and the fugivore-related predictors (N = 72, the number of plots × the number of species). We included species identity as a grouping factor because we had one value per species for the frugivore-related predictors and four values per species for tree and seedling abundances (one corresponding to each of the four 1-ha plots; Appendix 1). To account for differences in sampling effort among the small-sized stems (seedlings/saplings), we repeated the same rarefaction procedure used in the previous analysis.
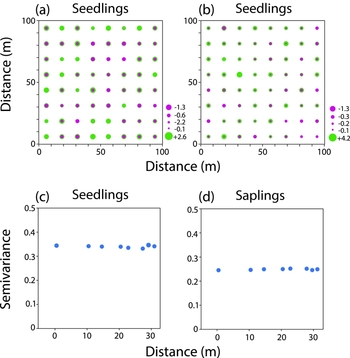
At the within-plot scale, we related the number of seedlings/saplings per species in each 10 × 10-m quadrat within each plot to the following fixed effects: the number of trees in the eight quadrats surrounding the focal quadrat, the number of seedlings in the eight quadrats surrounding the focal quadrat if the dependent variable was the number of saplings, and the frugivore-related predictors (N = 4212, the number of species × the number of plots × the number of quadrats). We standardized the number of neighbouring seedlings and trees by the number of quadrats since not all the focal quadrats had eight surrounding quadrats. Because we had two levels of variation − multiple values of seedling/sapling density within each plot and for each species − we included a grouping factor for plot nested within species identity (Appendix 1). As plant distribution is often spatially autocorrelated, we cannot assume independence among our sample units. To account for this potential bias, we quantified spatial autocorrelation by calculating empirical semivariograms. This analysis revealed that both seedling and sapling densities were not spatially autocorrelated within plots (Appendix 2); we therefore did not violate the assumption of independence of errors.
In all multiple regressions we selected the best-fit model through backward elimination, using the Akaike Information Criterion corrected for sample size (AICc). We examined collinearity among explanatory variables, and pairwise correlations among them showed that seed mass was positively correlated with mean fruit production (r = 0.53, P < 0.001). Although this pattern is counterintuitive and probably cannot be generalized across species, this positive relationship is explained by the fact that the two species with largest seeds showed high fruit production. Because this correlation can affect parameter estimates, we included either seed mass or mean fruit production in each of the models and selected the best-fit model based on the AICc.
In the across-plots analysis, we measured the goodness-of-fit of the best-fit model using R2, and performed an ANOVA on this model to calculate the proportion of variance explained by each factor. In the plot-level and within-plot analyses this method is not adequate as the variance is structured in multiple levels (Nakagawa & Schielzeth Reference NAKAGAWA and SCHIELZETH2013). We thus calculated the proportion of the deviance explained by the fixed and grouping factors separately, according to Nakagawa & Schielzeth (Reference NAKAGAWA and SCHIELZETH2013). To estimate the contribution of each fixed factor in predicting the species abundance of seedlings and saplings, we performed an ANOVA on the best-fit model, and we calculated the portion of deviance explained by each fixed factor based on the total deviance explained by fixed factors only. All the analyses were performed using the R version 3.0.2 statistical platform and the package lme4. We calculated the proportion of deviance explained by grouping and fixed effects using the function rsquared.lme developed by J. Lefcheck (jslefcheck.wordpress.com).
RESULTS
Across-plots scale
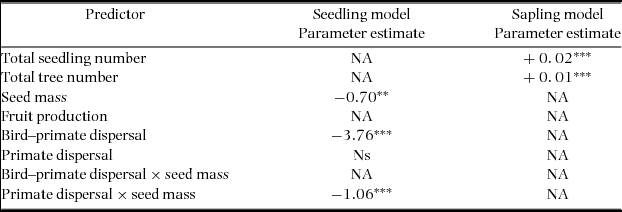
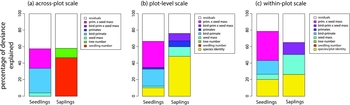
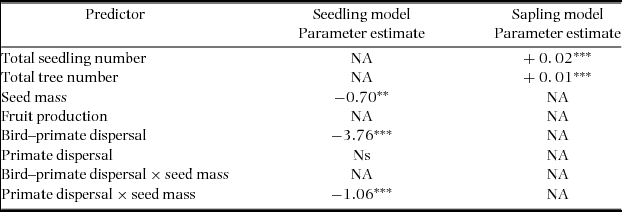
The best-fit model predicting the number of seedlings and saplings for the 18 study species across the four 1-ha plots explained, respectively, 57.6% and 58.1% of the deviance (Figure 2). Different independent variables were significant in the seedling and sapling models. The total number of seedlings per species across plots was primarily predicted by frugivore-related variables, whereas the total number of saplings per species across plots was only (positively) related to the total number of seedlings and trees per species. Small-seeded species had more seedlings forest-wide. Species dispersed by primates had higher seedling abundance than species dispersed by birds (bird–primate dispersal axis negatively related to total seedling abundance). Also, large-seeded species dispersed by the spider monkey had higher seedling abundance (interaction coefficient between primate dispersal and seed mass positively related to total seedling abundance). The greater fraction of the variance in the total number of seedlings per species was explained by the bird–primate dispersal axis and by the interaction between the primate dispersal axis and seed mass (Figure 2). In the sapling model, the total number of trees explained almost half of the variance in the total number of saplings per species (Figure 2).
Results from the generalized linear model predicting the total number of seedlings and saplings per species across the four 1-ha plots (across-plot scale) from the total number of trees, and frugivore-related variables at the Tinigua National Park, Colombia. ** P ≤ 0.01, *** P ≤ 0.001. NA denotes terms that were not included in the initial model, and ‘ns’ indicates that a term was included but was not significant.
Relative importance of the different predictors in explaining variation in seedling and sapling abundance at across-plot (a), plot-level (b) and within-plot (c) spatial scales at the Tinigua National Park (Colombia). At the plot-level and within-plot scales, multilevel models were performed, and the grouping factors were species identity and plot nested within species identity, respectively. The barplots represent the percentages of residual deviance explained by each of the frugivore-related predictors and by the grouping factors in each of the six generalized linear models performed.

Plot-level scale
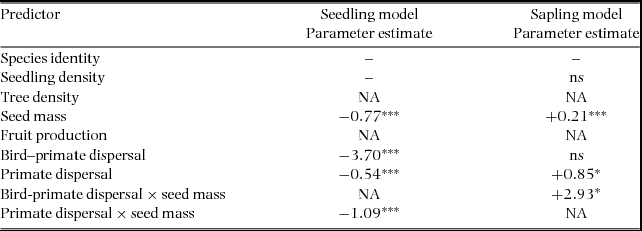
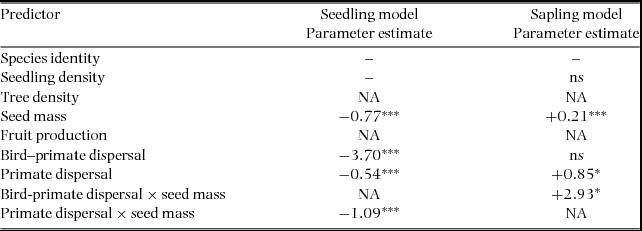
The explanatory variables predicting the number of seedlings and saplings per species at the plot level explained, respectively, 56.3% and 27.8% of the total deviance (Figure 2). Tree species density did not significantly affect the species density of either seedlings or saplings within each plot, and the density of seedlings was not significantly correlated with the density of saplings either. Seed mass was negatively related to seedling density, but positively so to sapling density, although this factor only explained a small fraction of the variance in the seedling model (Table 3). Species mainly dispersed by the spider monkey had slightly higher plot-level abundance at the seedling stage, but lower plot-level abundance at the sapling stage (primate dispersal axis significantly negative and positive, for the seedling and sapling models, respectively). Consistently with the across-plot analysis, the bird–primate dispersal axis was negatively related to the species density of seedlings, and the interaction coefficient between primate dispersal and seed mass was also negative. This last term explained the largest fraction of the variance in the number of seedlings per species within plots. In the sapling model, large-seeded species dispersed by birds had higher abundance of saplings at the plot level (interaction coefficient between seed mass and the bird–primate dispersal axis positive). Species identity (the grouping factor) explained 10.3% and 48.4% of the deviance in the seedling and sapling models, respectively (Figure 2).
Results from the multilevel linear model predicting the total number of seedlings and saplings per species within each of the four 1-ha plots from the total number of trees per species within each of the four 1-ha plots, and frugivore-related variables (plot-level scale) at the Tinigua National Park, Colombia. Species identity was treated as the grouping factor. * P ≤ 0.05, *** P ≤ 0.001. NA denotes terms that were not included in the initial model, and ‘ns’ indicates that a term was included but was not significant.
Within-plot scale
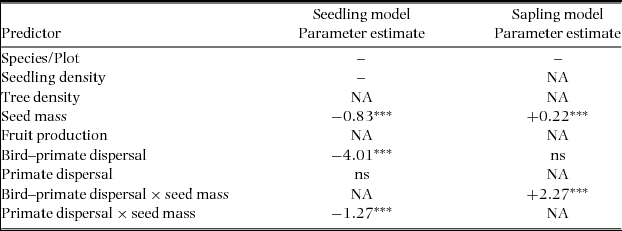
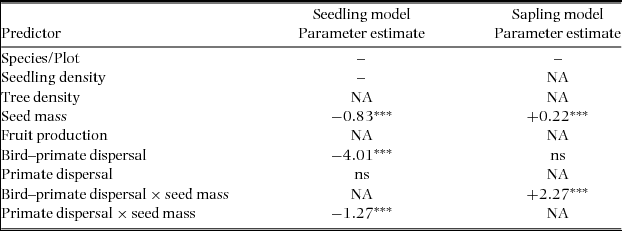
The explanatory variables predicting the species density of seedlings and saplings at the quadrat level explained, respectively, 58.3% and 38.8% of the total deviance (Figure 2). Local tree species density was not related to local seedling and sapling species density, and local seedling density was not related to local sapling density either. Consistently with the plot-level analyses, seed mass had a negative effect on the density of seedlings, but a positive effect on the density of saplings. Likewise, the density of seedlings was negatively related to the bird–primate dispersal axis and the interaction term between the primate-dispersal axis and seed mass was negative, but, unlike the previous analysis, the primate-dispersal axis was not significant. The interaction term between the bird–primate dispersal axis and seed mass was again positive in the sapling regression (Table 4). The grouping factor, plot nested within species identity, explained 20.4% and 26.4 of the variation in the species density of seedlings and saplings, respectively, indicating high variation in these dependent variables among plots and species (Figure 2).
Results from the multilevel linear model predicting species density of seedlings and saplings within each quadrat from tree species density neighbouring each quadrat, and frugivore-related variables (within-plot scale) at the Tinigua National Park, Colombia. Plot nested within species identity was treated as the grouping factor. *** P ≤ 0.001. NA denotes terms that were not included in the initial model, and ‘ns’ indicates that a term was not significant.
DISCUSSION
Several studies have emphasized the critical contribution of frugivores to plant recruitment, as both birds and primates have the potential to disperse a large volume of a wide variety of tree species (Jordano et al. Reference JORDANO, FORGET, LAMBERT, BÖHNING-GAESE, TRAVESET and WRIGHT2011, Terborgh et al. Reference TERBORGH, NUÑEZ-ITURRI, PITMAN, VALVERDE, ALVAREZ, SWAMY, PRINGLE and PAINE2008). Our results indicated that the species abundance of both seedlings and saplings was strongly associated with frugivore-related factors at different spatial scales. We acknowledge that these findings are no warranty that there is a causal relationship between frugivore activity and species abundance during early stages. Species abundance is the result of manifold ecological processes, and our purpose is not to assert that the frugivore-related predictors tested here are the sole determinants of species abundance. Indeed, Dalbergia sp. 1 and Rinorea lindeniana (Tul.) Kuntze, respectively wind- and ballistically dispersed, are quite abundant in the study area. Yet the fact that the identity of the dispersal vector and its interaction with seed size showed a much stronger predictive power than tree species abundance, particularly at local spatial scales, is suggestive that frugivores do play a pivotal role in long-term plant recruitment. Indeed, the wide array of fruit morphological adaptations enabling fruit removal indicates that animal-mediated seed dispersal enhances plant fitness from an evolutionary perspective (Jordano et al. Reference JORDANO, FORGET, LAMBERT, BÖHNING-GAESE, TRAVESET and WRIGHT2011). Manipulative experiments comparing seedling performance among species dispersed by different means (animals, wind, gravity) may give better insights about the direct effect of frugivores on recruitment success.
Remarkably, the factors related to the abundance of small-sized individuals shifted between life stages. For instance, the most abundant seedling species were consistently those primarily dispersed by primates, whereas species abundance of saplings was rather related to fruit removal by birds (although this was observed only at the plot-level and within-plot scales). These findings suggest that the identity of the dispersal agent may determine the outcome of seed deposition. Higher density-dependent mortality in primate- than in bird-dispersed species could explain such patterns. For instance, primates may generate highly spatially contagious recruit distributions by dispersing seeds beneath specific sites such as sleeping trees, latrines or feeding roosts, whereas birds might produce more scattered dispersal patterns. Several studies from a semi-deciduous tropical forest in Cameroon, however, found contrasting results indicating that birds tend to disperse seeds in a more contagious pattern than primates (Clark et al. Reference CLARK, POULSEN, BOLKER, CONNOR and PARKER2005). Yet another study from a tropical forest in Panama, that included a wide range of tree species, failed to find significant differences in dispersal kernels of bird- and primate-dispersed species (Muller-Landau et al. Reference MULLER-LANDAU, WRIGHT, CALDERÓN, CONDIT and HUBBELL2008). Further studies are needed to understand the effect of dispersal agent identity for long-term tree species recruitment.
Seed size also exhibited contrasting effects on seedling and sapling species abundance. Small-seeded species tended to have higher seedling density, but large-seeded species succeeded better at recruiting to the sapling stage. Previous studies have shown that small-seeded species have an advantage over large-seeded species at early stages, as they have higher seed production (Leishman et al. Reference LEISHMAN, WRIGHT, MOLES, WESTOBY, FENNER and Fenner2000). This advantage may disappear over time, however, as seedlings arising from large seeds are more able to withstand stressful conditions (Leishman et al. Reference LEISHMAN, WRIGHT, MOLES, WESTOBY, FENNER and Fenner2000). Indeed, a previous study carried out in Barro Colorado Island (Panama) showed a positive relationship between seed mass and sapling survival (Moles & Westoby Reference MOLES and WESTOBY2004). Our findings are in agreement with this study, and suggest that the benefit of seed reserves may persist beyond the seedling stage. It is important to note that seed size overcame the effect of fruit production in all the models. This was not surprising as seed size is more directly implicated in recruitment success by affecting germination (Norden et al. Reference NORDEN, DAWS, ANTOINE, GONZÁLEZ, GARWOOD and CHAVE2009a) and predation rates (Janzen Reference JANZEN1971), as well as seedling resprouting (Harms & Dalling Reference HARMS and DALLING1997).
Our results further showed that the effect of seed size on long-term plant recruitment goes beyond the benefits of tolerating establishment hazards. At all scales, the most abundant seedling species were those dispersed by primates, in particular, large-seeded species dispersed by the spider monkey. In contrast, saplings belonging to large-seeded species dispersed by birds showed higher abundance. Together, these results suggest that both primates and birds prefer large seeds over small ones. The strong preference of the spider monkey towards large-seeded species might be explained by the fact that it is a major consumer of Oenocarpus bataua and Socratea exhorriza, two large-seeded species that are not among the first choices of the woolly monkey (Figure 1, Stevenson et al. Reference STEVENSON, QUIÑONES and AHUMADA2000). These findings are in agreement with previous studies carried out in different groups of dispersers, which showed that seed size is an important criterion of selection for frugivorous species (Jansen et al. Reference JANSEN, BONGERS and HEMERIK2004, Ratiarison & Forget Reference RATIARISON and FORGET2013).
Young stems commonly face developmental changes in their biotic and abiotic environment, suggesting that what is beneficial to seedlings is not necessarily beneficial to saplings (Comita et al. Reference COMITA, CONDIT and HUBBELL2007a, Schupp Reference SCHUPP1995, Webb & Peart Reference WEBB and PEART2000). Seed dispersal is a single step in the multistage process leading to tree recruitment, and a wide variety of factors can affect the ultimate fate of seeds after seed deposition by dispersal agents. In particular, environmental filtering may contribute to the decoupling of seedling and sapling spatial distribution patterns. Since habitat associations do not necessarily form at early life stages, but build up throughout ontogeny (Comita et al. Reference COMITA, CONDIT and HUBBELL2007a), populations may contract their abundance and/or spatial range through differential survival in different habitats. Also, environmental conditions may vary over time as a consequence of unpredictable events such as tree falls (van der Meer & Bongers Reference VAN DER MEER and BONGERS1996), generating favourable or detrimental changes in the abiotic context in which individuals grow. Another explanation for this discrepancy could be related to the fact that seedling data represent a one-time picture of species seedling abundance patterns. As tropical plants show high year-to-year variation in seed output (Norden et al. Reference NORDEN, CHAVE, CAUBERE, CHATELET, FERRONI, FORGET and THEBAUD2007) and in seedling habitat associations (Metz Reference METZ2012), static data may therefore not reflect the true dynamics of the seedling layer. Long-term community-wide monitoring, including both biotic and abiotic factors, could improve our certainty about this issue (Nathan & Muller-Landau Reference NATHAN and MULLER-LANDAU2000, Norden et al. Reference NORDEN, CHAVE, BELBENOIT, CAUBERE, CHATELET, FORGET, RIERA, VIERS and THEBAUD2009b). Unfortunately, it was impossible to extend our data to multiple censuses as our study site is located in an inaccessible area resulting from the Colombian armed conflict.
The fraction of variance in the species abundance of seedlings and saplings explained by the models varied little across scales. This was a surprising finding as variation in the species abundance of seedlings and saplings was not related to tree species abundance at small spatial scales, and our data describing frugivore activity was not spatially explicit. Since the modelling techniques we used examine simultaneously the contributions of individual- and group-level variables, the significant effects of frugivore-related variables found were not spurious. The idea that species-level information is associated with the local abundance of small-sized individuals may suggest that the relationship between frugivore activity and species abundance is invariant across space. Spatially explicit data on frugivore activity would be required to test this hypothesis. Species and plot identity (the grouping factors) significantly contributed to the differences observed in the abundance of seedlings and saplings within and among the 1-ha plots. It has been shown that seedlings exhibit differential responses to natural enemies depending upon species identity (Dalling et al. Reference DALLING, DAVIS, SCHUTTE and ARNOLD2011). Environmental filtering may vary across species as well, and can be driven by topography and soil heterogeneity (Metz Reference METZ2012), water (Engelbrecht et al. Reference ENGELBRECHT, COMITA, CONDIT, KURSAR, TYREE, TURNER and HUBBELL2007) or light availability (Nicotra et al. Reference NICOTRA, CHAZDON and IRIARTE1999).
We acknowledge that the frugivore-related predictors used here summarize information about the frugivore assemblage visiting each tree species, and do not give a direct measure of dispersal rates. Using visitation and feeding data as a proxy of seed dissemination assumes that the relationship between animal-dispersed tree species and their frugivores is invariably mutualistic. Although certain species are known to predate or drop the seeds in situ without dispersing them (Howe Reference HOWE1977), it has long been recognized that most vertebrates are efficient seed dispersers (Schupp et al. Reference SCHUPP, JORDANO and GÓMEZ2010, Stevenson Reference STEVENSON, Dennis, Schupp, Green and Westcott2007). Indeed, previous studies in our study area have shown that woolly and spider monkeys manipulate about 54% of the seeds produced by endozoochorous canopy species, and provide efficient seed-dispersal services for at least 147 plant species (Stevenson Reference STEVENSON, Dennis, Schupp, Green and Westcott2007). Thus, as our goal was not to estimate actual rates of dispersal, we believe that our data illustrate appropriately the identity of the dispersal agents dispersing the seeds of our study species.
In brief, our findings show important ontogenetic shifts in the relative importance of the different variables addressed. Frugivore-related variables explained an important fraction of the variance in the species abundance of seedlings and saplings at all the spatial scales addressed. Overall, our results suggest that recruitment success is context-dependent (Schupp et al. Reference SCHUPP, JORDANO and GÓMEZ2010). Scale dependency and developmental changes are not new challenges in regeneration ecology: many studies have addressed how the relative importance of different ecological processes may shift depending upon the scale and the timing of the analysis (Comita et al. Reference COMITA, CONDIT and HUBBELL2007a, Metz Reference METZ2012, Schupp et al. Reference SCHUPP, JORDANO and GÓMEZ2010). Here, we bring further support that this scaling approach should be seen as a standard method for gaining deeper insights in the importance of dispersal in population and community dynamics. Our results shed some light in the potential consequences of plant–frugivore interactions on plant regeneration, and suggest that frugivores do influence long-term plant establishment in tropical forests.
ACKNOWLEDGEMENTS
We thank Jon S. Lefcheck, for sharing the function rsquared.lme on his blog (jslefche.wordpress.com). Vanessa Boukili and three anonymous reviewers provided helpful comments on earlier versions of the manuscript. This research was supported by several institutions that provided financial and logistic support to gather the data and to undertake these analyses, including Universidad de Los Andes, Ecopetrol (project ‘Conservación de servicios ecosistémicos en los humedales colombianos, una aproximación con miras a la restauración asistida’), Colciencias, Banco de la República, Primate Conservation Inc., Margot Marsh Foundation, Conservation International and Lincoln Park Zoo.
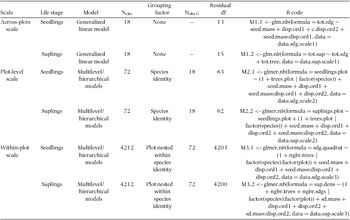
Description of the generalized linear models predicting the species abundance of seedlings and saplings from tree species abundance and frugivore-related predictors at the across-plots, plot-level and within-plot scales at the Tinigua National Park (Colombia). Reported are the type of model, the number of observations for each model (Nobs), the grouping factor, the number of observations within each grouping factor (Nobs G), the residual degrees-of-freedom (df) extracted from each fitted model, and the R code used for each of the models. In the multilevel models we considered a varying-intercept, varying-slope in which both slopes and intercepts can vary by group, thereby allowing more than one, and included group-level predictors. Analogous models to the multilevel models performed can be found in Gelman & Hill (Reference GELMAN and HILL2006: 281). All the models assumed a negative binomial error distribution.

Spatial patterns in the local species abundance of saplings and seedlings at the Tinigua National Park (Colombia). The upper plots show the model residuals by their spatial coordinates for seedlings (a) and saplings (b). Each point represents the residuals of the model predicting the species abundance of seedlings and saplings against tree species abundance and frugivore-related variables at each quadrat location (within-plot scale). There is no spatial pattern in the residuals as both positive and negative values are homogeneously distributed. The lower plots illustrate the semivariance in the species abundance of seedlings (c) and saplings (d) within each quadrat, depending upon pairwise distance between quadrats. For both seedlings and saplings, semivariance is independent of the distance between sampling units.