Introduction
Residual stress is the stress present in an object when there is no external force. Because residual stresses can cause unexpected behavior or failure of the object, quantitative residual-stress-evaluating techniques such as hole drilling, sectioning, and XRD have been used to evaluate the residual stress to study integrity of structures. In addition to these conventional methods, however, residual stress measurement using indentation offers the advantages of quantitative results, nondestructive and simple testing. Tsui et al. [Reference Tsui, Oliver and Pharr1] have shown the effects of stress on indentation measurements of hardness and elastic modulus experimentally, and Bolshakov et al. [Reference Bolshakov, Oliver and Pharr2] have shown stress effects using FEA simulation. Both these studies demonstrate that elastic modulus and hardness calculated using the real contact area as measured by optical microscopy do not depend on the stress state of specimen. Suresh and Giannakopoulos [Reference Suresh and Giannakopoulos3] developed a model for evaluating equibiaxial residual stress and residual plastic strains using instrumented sharp indentation, and this model is demonstrated by Carlsson and Larsson [Reference Carlsson and Larsson4, Reference Carlsson and Larsson5]. Lee and Kwon [Reference Lee and Kwon6] suggest a way to evaluate biaxial residual stresses by analyzing the relation among the residual stress, load difference between stressed state and stress-free state (ΔL = L 0 − L s) at the same indentation depth and contact area. They decompose the surface residual stress into hydrostatic stress and deviatoric stress and assume that the deviatoric stress component parallel to the indenting axis affects plastic deformation by indentation. When the principal directions of surface residual stress are the x- and y-directions, the surface residual stress can be decomposed in Eq. (1), and the average of the principal residual stresses can be calculated using Eq. (2):
 $$\eqalign{\left( {\matrix{ {\sigma _{{\rm{res}}}^x} & 0 & 0 \cr 0 & {\sigma _{{\rm{res}}}^y} & 0 \cr 0 & 0 & 0 \cr} } \right) = \left( {\matrix{ {{{\sigma _{{\rm{res}}}^x + \sigma _{{\rm{res}}}^y} \over 3}} & 0 & 0 \cr 0 & {{{\sigma _{{\rm{res}}}^x + \sigma _{{\rm{res}}}^y} \over 3}} & 0 \cr 0 & 0 & {{{\sigma _{{\rm{res}}}^x + \sigma _{{\rm{res}}}^y} \over 3}} \cr} } \right) \cr+ \left( {\matrix{ {{{2\sigma _{{\rm{res}}}^x - \sigma _{{\rm{res}}}^y} \over 3}} & 0 & 0 \cr 0 & {{{ - \sigma _{{\rm{res}}}^x + 2\sigma _{{\rm{res}}}^y} \over 3}} & 0 \cr 0 & 0 & { - {{\sigma _{{\rm{res}}}^x + \sigma _{{\rm{res}}}^y} \over 3}} \cr} } \right)\quad ,$$
 $$\sigma _{{\rm{res}}}^{{\rm{avg}}} = {{\sigma _{{\rm{res}}}^x + \sigma _{{\rm{res}}}^y} \over 2} = {3 \over 2}{{\left( {{L_0} - {L_{\rm{s}}}} \right)} \over {{A_{\rm{s}}}}}\quad .$$
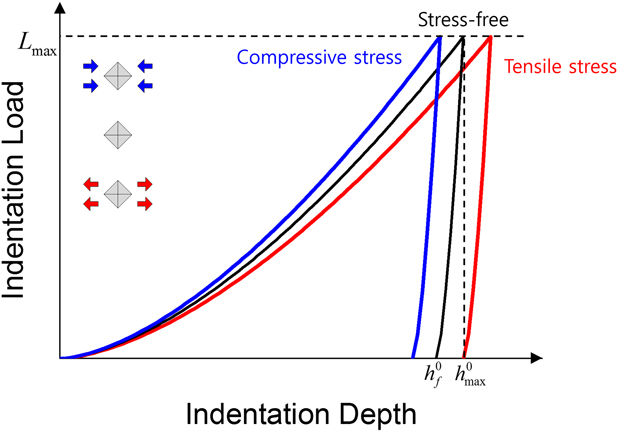
In the previous studies, the concept of evaluating the residual stress is mainly based on the comparison of the indentation curves obtained in stress-free and stressed states. Lee and Kwon’s model [Reference Lee and Kwon6] is also based on the fact that indentation loading curves are shifted depending on the stress state of specimen (Fig. 1). To evaluate residual stress with their model, both stress-free and stressed specimens are required. And the stress-free state specimen should have a same composition and microstructure as the stressed-state specimen to exclude the possibility of curve change due to mechanical properties. If the mechanical properties of stressed and stress-free specimens are different, because this factor will also affect the shifting of the indentation curve along with the residual stress, an error will occur in the residual stress evaluation.
Schematic indentation loading curves for various stress states.

However, in situations such as welding and thin films, evaluating the residual stress is problematic since stress-free state specimen of the same composition and microstructure as the stressed specimen is difficult to obtain. In the case of welding, the residual stress necessarily occurs during the welding process due to the factors such as difference in the thermal expansion coefficient between the base metal and the weld metal and the nonuniform distribution of the heat input during the welding. In the case of the thin film, the residual stress also necessarily exists due to the existence of defects during the thin film formation, the phase transformation, and the lattice mismatch and difference in thermal expansion coefficient between the substrate and the thin film. To obtain a stress-free state, it is necessary to make a simulated specimen produced with the same thermal effect or cut the stressed specimen to relax the stress, but this does away with indentation’s advantage of nondestructiveness and simplicity. To overcome this limitation, we propose a new method to derive indentation curve of stress-free state from indentation result in stressed specimen.
In this study, indentation parameters which do not depend on stress are identified by the experiments with the known stressed-state specimen. And, to derive the indentation curve for the stress-free state from the indentation parameters obtained in a stressed state, the indentation contact depth function for Vickers indentation taking into account the real indentation contact morphology for the stress-free state (Kang et al. [Reference Kang, Kim, Park, Kim and Kwon7, Reference Kang, Kim, Lee, Kim and Kwon8]) is introduced. We can obtain the information about the indentation loading curve of stress-free state by substituting the stress-independent indentation parameters obtained from the stressed state into the contact depth function established in the stress-free state. This method is verified by matching the estimated stress-free loading curve to the experimental loading curve. Finally, the applied stress is evaluated using this method and the evaluated values are compared with the reference values obtained from strain gauges.
Results and discussion
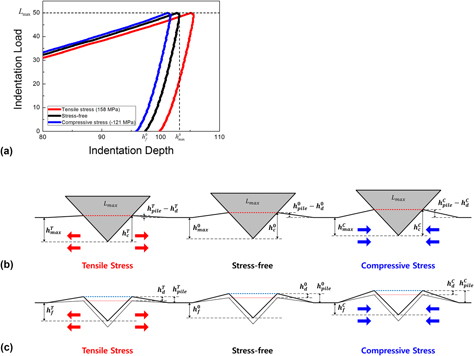
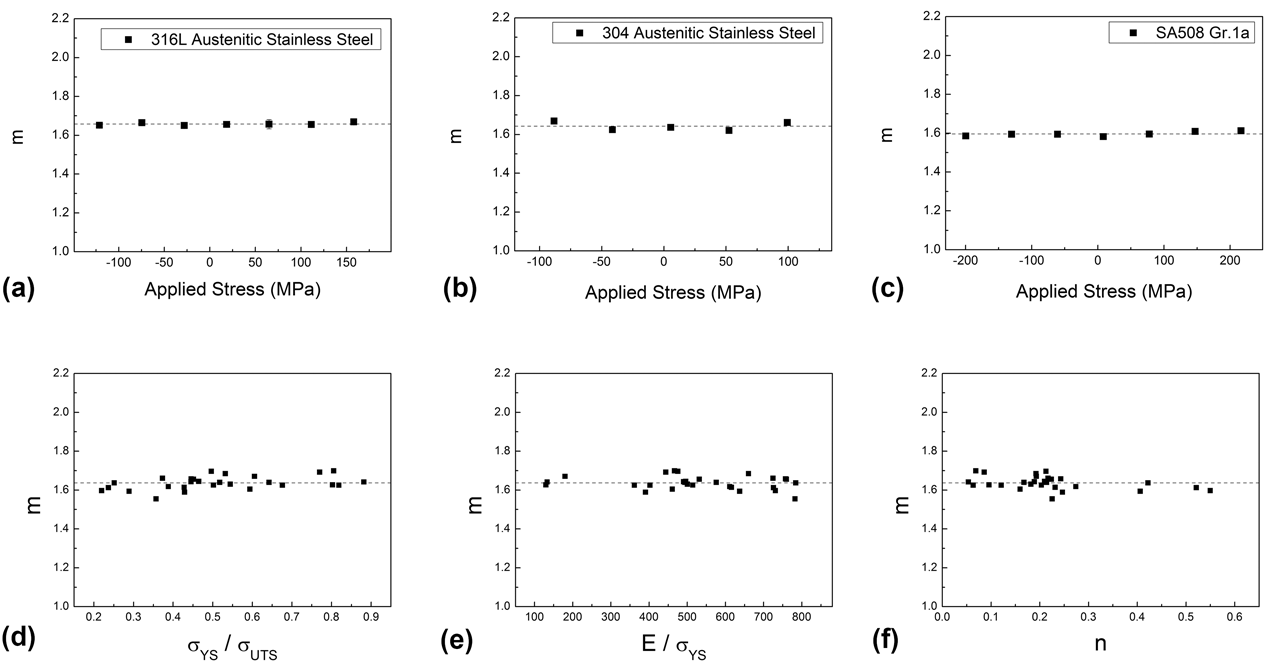
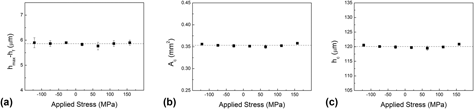
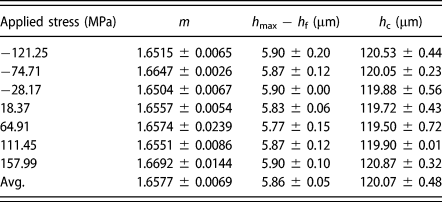
The dependencies of the indentation curve and indentation parameters on stress states are shown in Figs. 2(a), 3, and 4 and Table I. Indentation parameters are obtained from three lines, each line consisting of seven indentation tests of various uniaxial stress states from tensile to compressive stresses. From the indentation loading curve, the exponent of Meyer’s power law (m) is obtained. As shown in Figs. 1 and 2(a), the indentation curve is shifted from the stress-free state curve depending on the stress state of the specimen [Reference Bolshakov, Oliver and Pharr2, Reference Lee and Kwon6, Reference Lu, Feng, Peng, Yang, Huan and Zhang9]. Although the indentation curves are shifted by the stress, when we express the indentation loading curve as Meyer’s power law (L = k·h m) describing the elastoplastic-behavior aspect of the indentation [Reference Attaf10], the exponent in Meyer’s power law (m) is relatively constant [Fig. 3(a)]. This means that only parameter k changes in Meyer’s power law when the indentation curve changes in response to the stress state of specimen. We confirmed the dependence of m on stress for the other materials: they all have a similar value with small deviations, independent of the stress, as shown in Figs. 3(a)–3(c). When indentation is performed in an ideal material with an ideal shape of a sharp indenter in a depth range where an indentation size effect does not occur, the evaluated hardness values should be constant regardless of the indentation depth [Reference Voyiadjis George and Almasri Amin11, Reference Broitman12]. This means that if the indentation loading curve is fitted to Meyer’s power law, the exponent value should be 2. However, the exponent values obtained in this study range from 1.6 to 1.7, probably due to the imperfect shape of the indenter tip: depending on the degree of bluntness of the indenter tip, the indentation depth varies to reach the same indentation load and the loading curve is shifted [Reference Akatsu, Numata, Shinoda and Wakai13]. This shift ultimately affects the exponent in Meyer’s power law. In addition, using the same Vickers indenter, indentations were performed on 28 stress-free metal specimens and the exponent in Meyer’s power law of the indentation loading curve was calculated. As shown in Figs. 3(d)–3(f), m has a relatively constant value, mean value of 1.64 and standard deviation of 0.03, regardless of mechanical properties such as ratio of yield strength and ultimate tensile strength  $\left( {{{{\sigma _{{\rm{YS}}}}} \over {{\sigma _{{\rm{UTS}}}}}}} \right)$, ratio of elastic modulus and yield strength
 $\left( {{E \over {{\sigma _{{\rm{YS}}}}}}} \right)$, and strain-hardening exponent (n). In other words, it can be confirmed that exponent of Meyer’s power law (m) does not depend on the stress or mechanical properties but on the shape of a specific indenter. For the indenter used in this study, it can be deduced that the indenter deviates from the ideal shape of a sharp indenter by having some bluntness. If the indenter used here was an ideal-shaped Vickers indenter, then the value of m would be near 2 regardless of the stress and mechanical properties. The difference between the maximum and final depths (h max − h f) is obtained from the indentation unloading curve [Fig. 2(a)]. As shown in Fig. 4(a), the values are relatively constant and independent of the applied stress. This means that the residual stress changes only the initial strain state of the material and does not affect the elastic behavior of indentation as the elastic behavior in the tension test does not change with the stress state. Because the elastic behavior in indentation does not change with the stress state, the indentation unloading curve showing elastic recovery [Reference Stilwell and Tabor14] should not be changed depending on the stress, and the difference between maximum and final depths should also be the same. The result of Tsui et al.‘s study that the stiffness (S) does not depend on the stress [Reference Tsui, Oliver and Pharr1] also shows that the elastic behavior of the indentation is unaffected by the stress. The indentation contact area
 $\left( {A_{\rm{c}}^{{\rm{pro,opt}}}} \right)$ is obtained from optical microscopy, and the contact depth (h c) is calculated from the contact area using Eq. (15). When indentation was performed under the same maximum load, the contact area and depth were relatively constant regardless of stress, as shown in Fig. 4, and this is consistent with the results of the previous study [Reference Tsui, Oliver and Pharr1]. Indentation causes elastic deflection and plastic deformation such as pileup or sink-in around the imprint [Reference Oliver and Pharr15, Reference Giannakopoulos, Larsson and Vestergaard16, Reference Bolshakov and Pharr17], so that the real contact depth should reflect the elastic deflection, pileup, and sink-in at the maximum depth [Reference Kang, Kim, Park, Kim and Kwon7] [Fig. 2(b)]. In previous researches [Reference Bolshakov, Oliver and Pharr2, Reference Lee, Takashima, Higo and Kwon18, Reference Ling, Long, Ma and Liang19], it was confirmed that the pileup height depends on the stress of the specimen. Comparing with the results in the stress-free state tested at the same maximum load, the maximum depth decreases with compressive residual stress but pileup height increases; on the other hand, the maximum depth increases with the tensile residual stress, but pileup height decreases. In other words, the contact depth is constant regardless of stress because the two factors tend to be opposite to each other (Fig. 2). In this study, it has been proven by the experiments that the projected contact area obtained by optical microscopy and the unloading curve does not depend on the stress at the test condition of same maximum load. This indicates that the indentation hardness (H IT) and elastic modulus (E) determined by the projected contact area obtained from optical microscopy using Eqs. (3)–(5) are independent of the stress as shown in the previous research [Reference Tsui, Oliver and Pharr1, Reference Bolshakov, Oliver and Pharr2].
 $${H_{{\rm{IT}}}} = {{{L_{{\rm{max}}}}} \over {A_{\rm{c}}^{{\rm{pro}}}}}\quad ,$$
 $${E_{{\rm{eff}}}} = {1 \over \beta }{{\sqrt \pi } \over 2}{S \over {\sqrt {A_{\rm{c}}^{{\rm{pro}}}} }}\quad ,$$
 $${1 \over {{E_{{\rm{eff}}}}}} = {{(1 - {\nu ^2})} \over E} + {{(1 - \nu _i^2)} \over {{E_i}}}\quad .$$
(a) Load–depth results for Vickers indentation of type 316L austenitic stainless steel in various stress states, (b) surface morphology during contact, and (c) surface morphology after unloading.

Dependence of exponent of Meyer’s power law for loading curve on stress: (a) type 316L austenitic stainless steel, (b) type 304 austenitic stainless steel, (c) SA508 Gr.1a and mechanical properties: (d) ratio of yield strength and ultimate tensile strength, (e) ratio of elastic modulus and yield strength, and (f) strain-hardening exponent.

Effect of stress on indentation parameters: (a) difference between maximum and final depths, (b) contact area obtained from optical microscopy, and (c) contact depth calculated from contact area.

Effect of stress on stress-independent indentation parameters for type 316L austenitic stainless steel.

Here, to estimate the stress-free indentation curve from the stress-independent indentation parameters, h c, h max − h f, and m, obtained in the stressed state, the contact depth function is introduced. (In the superscripts, 0 means stress-free state and s means stressed state.) In the previous research, Kang et al. [Reference Kang, Kim, Park, Kim and Kwon7, Reference Kang, Kim, Lee, Kim and Kwon8, Reference Kang, Kim, Lee, Kwon and Kim20] confirmed that  $h_{\rm{c}}^{\rm{0}}$ depends on the ratio of
 $h_{\max }^0 - h_{\rm{f}}^0$ to
 $h_{\max }^0$, which corresponds to the ratio of yield strength to elastic modulus in the stress-free state:
 $$f = {{h_{\rm{c}}^{\rm{0}}} \over {h_{\max }^0}} = a{{h_{\max }^0} \over {h_{\max }^0 - h_{\rm{f}}^{\rm{0}}}} + b\quad .$$
In Eq. (6), the parameter f is a correction factor that gives the indentation contact depth (h c) from the indentation maximum depth (h max). If f is 1, the degree of elastic deflection is equal to the pileup height. When f is greater than 1, the pileup height is greater than the elastic deflection, and if f is less than 1, the pileup height is less than the elastic deflection or sink-in occurs instead of pileup. In other words, f indicates the extent of pileup and sink-in that occur around the indenter in contact. The larger its value, the larger the pileup, and the smaller its value, the larger the sink-in. This Eq. (6) is meaningful in that the information about elastoplastic deformation around the indenter in contact, which depends on the mechanical properties, can be represented with indentation parameters obtained from indentation curves and optical microscopy.
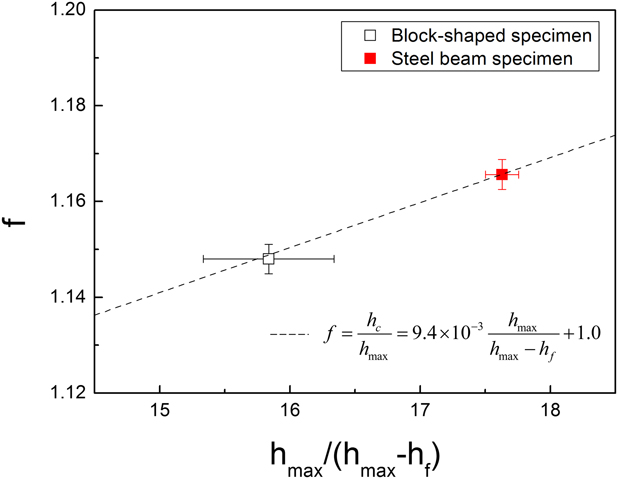
Because the parameters a and b depend on the indenter’s apex angle and tip bluntness [Reference Kang, Kim, Lee, Kim and Kwon8, Reference Kang, Kim, Lee, Kwon and Kim20], they are determined by the results of a specific Vickers indentations in the stress-free state. Here, to obtain the parameters a and b, a block-shaped stress-free specimen of 15 × 30 × 30 mm3 with the same heat treatment as the steel beam specimen was additionally prepared. Both specimens were air-quenched after the same heat treatment, although the indentation hardness after annealing is slightly different because the geometries of the two specimens are different: the indentation hardness (H IT) [21] of the blocked-shaped specimen is 150.8 ± 3.1 and that of steel beam specimen is 141.9 ± 1.7. Although the hardness values of the two stress-free specimens differ, when the parameter b is set to 1.0, it is confirmed that the parameter a has the same value of 0.0094 as in Eq. (7) (Fig. 5): that is, even though the mechanical behavior represented by hardness of the two stress-free specimens differs, they have the same contact behavior. This result is consistent with a previous study [Reference Kang, Kim, Lee, Kim and Kwon8] that indentation results have the same a and b in Eq. (7) even if the microstructure is changed by applying different prestrains to the same material. However, Eq. (7) shows that the equation is always greater than 1.0. If b is set to 1.0, the equation can be applied only to materials in which large pileup occurs; it cannot be applied to materials in which small pileup or sink-in occurs. For a material with small pileup or sink-in, both a and b should be determined from the optimal linear relation between f and h max/(h max − h f) without prior decision.
 $$f = {{h_{\rm{c}}^0} \over {h_{\max }^0}} = 9.4 \times {10^{ - 3}}{{h_{\max }^0} \over {h_{\max }^0 - h_{\rm{f}}^{\rm{0}}}} + 1.0\quad .$$
Linear correlation between contact depth morphology and indentation depths.

According to Figs. 3 and 4 and Table I, the following relations hold for the indentation parameters in stress-free and stressed states for the same maximum indentation load:
 $${m^{\rm{s}}} = {m^0}\quad ,$$
 $$h_{\rm{c}}^{\rm{s}} = h_{\rm{c}}^0\quad ,$$
 $$h_{{\rm{max}}}^{\rm{s}} - h_{\rm{f}}^{\rm{s}} = h_{\max }^0 - h_{\rm{f}}^0\quad .$$
Based on Eqs. (9) and (10), Eq. (7) can be expressed as:
 $${{h_{\rm{c}}^{\rm{s}}} \over {h_{\max }^0}} = 9.4 \times {10^{ - 3}}{{h_{\max }^0} \over {h_{{\rm{max}}}^{\rm{s}} - h_{\rm{f}}^{\rm{s}}}} + 1.0\quad ,$$
 $h_{{\rm{max,estimated}}}^{\rm{0}}$ can be obtained by expressing Eq. (11) with respect to
 $h_{\max }^0$ as follows:
 $$h_{{\rm{max,estimated}}}^{\rm{0}} = {{\left( {h_{{\rm{max}}}^{\rm{s}} - h_{\rm{f}}^{\rm{s}}} \right)\left( {\sqrt {1 + {{4 \times 9.4 \times {{10}^{ - 3}} \times h_{\rm{c}}^{\rm{s}}} \over {h_{{\rm{max}}}^{\rm{s}} - h_{\rm{f}}^{\rm{s}}}}} - 1} \right)} \over {2 \times 9.4 \times {{10}^{ - 3}}}}\quad .$$
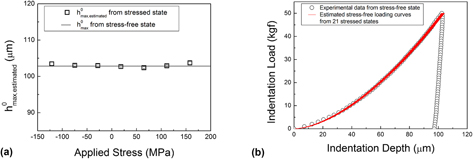
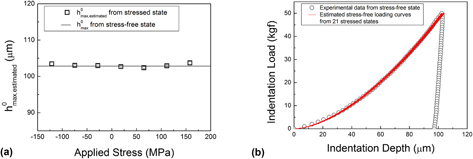
This means that we can derive the maximum indentation depth of a stress-free state from a stressed specimen of the same composition and microstructure if we know the form of Eq. (6) for a specific indenter. Using the contact depth function obtained in this study,  $h_{{\rm{max,estimated}}}^{\rm{0}}$ values are estimated from the results of indentation performed in various stressed states. The line in Fig. 6(a) is the average of the
 $h_{\max }^0$ values performed before stressing the steel beam. It can be confirmed that the
 $h_{{\rm{max,estimated}}}^{\rm{0}}$ from the stressed state agrees well with the experimental results for the stress-free state.
(a) Maximum indentation depth for stress-free state estimated from various stressed states, and (b) comparison between real stress-free indentation curve and loading curve estimated from stressed state.

Meyer’s power law was used in this study to obtain the loading curve of the stress-free state using the  $h_{{\rm{max,estimated}}}^{\rm{0}}$ from the stressed state. Considering Eq. (8) and the result of Eq. (12), we can obtain
 $k_{{\rm{estimated}}}^{\rm{0}}$ through Eq. (14) for the same maximum indentation load (L max):
 $${L_{\max }} = {k^0} \cdot {\left( {h_{\max }^0} \right)^{{m^0}}} = {k^0} \cdot {\left( {h_{\max }^0} \right)^{{m^{\rm{s}}}}}\quad ,$$
 $$k_{{\rm{estimated}}}^{\rm{0}} = {{{L_{\max }}} \over {{{\left( {h_{{\rm{max,estimated}}}^0} \right)}^{{m^{\rm{s}}}}}}}\quad ,$$
If k and m are known, the shape of the indentation curve can be determined according to Meyer’s power law. Since L max is the test condition and  $h_{{\rm{max,estimated}}}^{\rm{0}}$ and m s can be obtained from the stressed state, we can derive indentation curve information for the stress-free state represented by k 0 and m 0 without stress-free specimen. The indentation curve composed of circles in Fig. 6(b) is obtained before applying stress to the steel beam; the red lines are the indentation loading curves corresponding to the stress-free state estimated from the results of the 21 indentations on the stressed steel beam. It can be seen that the estimated loading curve follows the real indentation curve well and shows reproducible results.
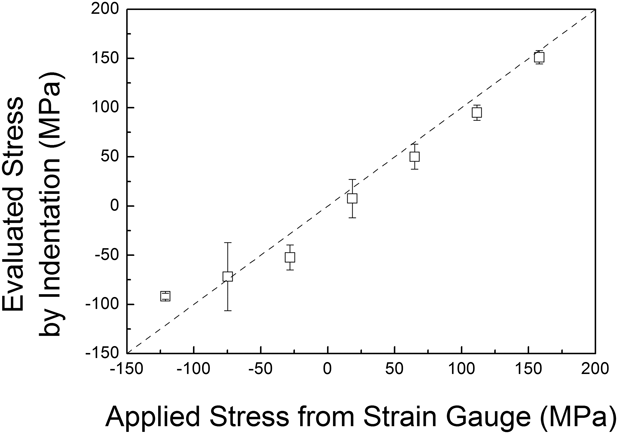
The applied stress was evaluated using Eq. (2) by comparing the stressed indentation curve and stress-free loading curve estimated from the stressed states. Figure 7 compares the evaluated stress values with the stress profile obtained from the strain gauges. It can be seen that the stresses evaluated by using this model only with the stressed-state specimen match the reference values, applied stresses obtained by strain gauges, well. However, as shown in Fig. 7, the applied stress and evaluated stress have slightly different relations in the tensile stress and compressive stress regions. The slope in the tensile stress region is slightly larger than the slope in the compressive stress region, a difference due to the influence of Eq. (2) used here to evaluate the stress. In the previous study [Reference Xiao, Ye and Chen22], it can be confirmed that the tendencies in the tensile and compressive stress regions are slightly different depending on the residual stress evaluation model, and if a model is developed that compensates for the difference in behavior, the differences in tensile and compressive stress can be resolved.
Evaluated stress using indentation by estimating stress-free state from stressed specimen.

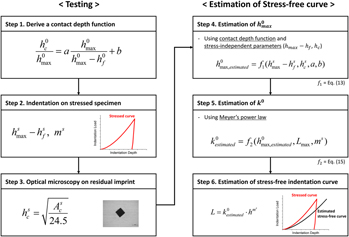
This study was performed for type 316L austenitic stainless steel, and the proposed model summarized in Fig. 8 could be applied to other materials based on the assumption that the stress-independent indentation parameters identified here apply equally to those materials. The contact depth function [Eq. (6)] used to estimate the stress-free loading curve from the stress-independent indentation parameter confirms that the relationship between  ${{{h_{\max }}} \over {{h_{\max }} - {h_{\rm{f}}}}}$ and
 ${{{h_{\rm{c}}}} \over {{h_{\max }}}}$ is quite linear for the same material (Fig. 5) here and in previous study [Reference Kang, Kim, Lee, Kim and Kwon8]. Also, since this contact depth function is influenced by indenter tip shape [Reference Kang, Kim, Lee, Kwon and Kim20], if we obtain a contact depth function by accurately evaluating a and b for the target material and specific indenter, we can estimate the stress-free state indentation curve from stressed state accurately and, as a result, evaluate the residual stress without having a specimen of the stress-free state. This method will be particularly applicable in situations such as in-field residual stress testing where it is difficult to obtain stress-free state specimens. In addition, in the case of real structures, the component may be subjected to combined isotropic-kinematic hardening due to cyclic-loading/unloading. For the method of this study to be usefully applied in-field, additional research is needed to confirm if the assumptions of this study are appropriate for materials subjected to combined isotropic–kinematic hardening.
Method estimating stress-free indentation curve from stressed specimen by using stress-independent indentation parameters.

Conclusion
To evaluate the residual stress by indentation, stress-free specimens of the same composition and microstructure as the stressed specimen are necessary. In this study, several indentation parameters, contact depth, difference between maximum and final indentation depths, and exponent in Meyer’s power law, were confirmed to be independent of stress, and information on the indentation curve for the stress-free state was derived by applying the corresponding parameters to the contact depth function for the stress-free state. The contact depth function parameters for the Vickers indenter and type 316L austenitic stainless steel were obtained before applying the stress to the specimen. The stress-free loading curves were well predicted from the stress-independent indentation parameters obtained in the stressed state using the contact depth function established here. Finally, it was confirmed that the stresses evaluated from the stress-free loading curve estimated from the stressed state and the experimental stressed-state loading curve match well with the applied stress values obtained from the strain gauge. In other words, using the model proposed in this study, residual stress can be evaluated with only a stressed-state specimen: no stress-free state specimen is necessary.
Experimental procedure
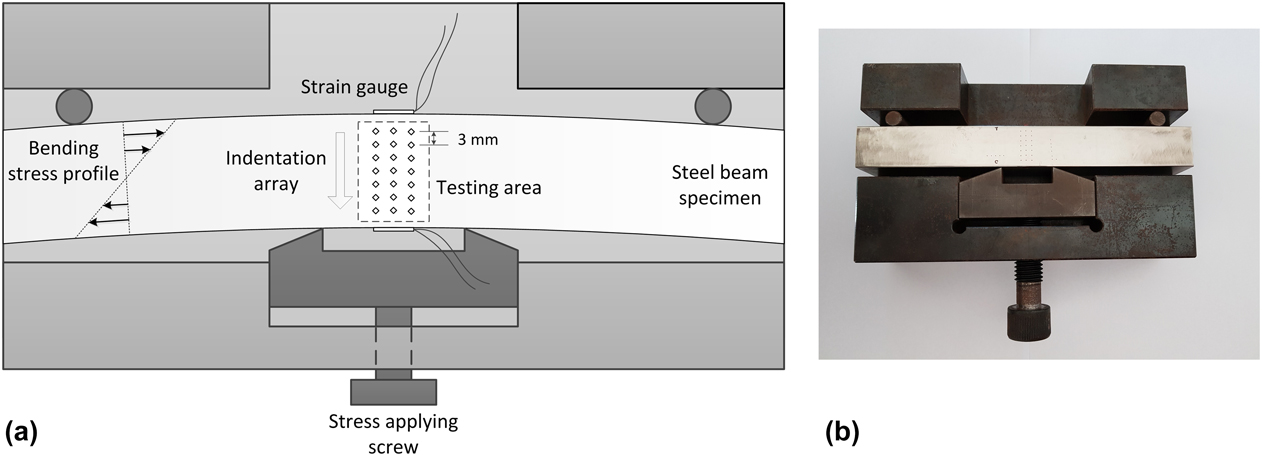
Type 316L austenitic stainless steel, which is widely used in pipes, was used for this research. A steel beam of size 25 × 30 × 200 mm3 was annealed at 1050 °C for 1.5 h to relax internal stresses and then polished with up to 1.0-μm alumina powder. Uniaxial stresses were applied to the steel beam by four-point bending using a stress-generating jig [Reference Lee, Ji and Kwon23] (Fig. 9). The stresses are applied below the elastic limit as derived from the yield criterion. The applied stress profile was obtained from strain gauges on both sides of the beam and elastic modulus evaluated with an ultrasonic pulse-echo technique according to ASTM standard E494 (2015). The yield strength is obtained with tension tests. The elastic modulus of the steel beam is 189.4 ± 16.4 GPa, and the yield strength is 241.6 ± 3.4 MPa. Indentation tests were carried out using the AIS 3000 system (Frontics, Inc., Seoul, Republic of Korea), with a load resolution of 55 mN (5.6 gf) and a displacement resolution of 0.1 μm; a Vickers indenter with an apex angle of 136° was used [21]. The indentation tests are performed with loading rate of 0.3 mm/min and maximum indentation load of 490 N (50 kgf) in both stress-free and stressed states. Before applying stress, indentation tests were performed on stress-free steel beam. After applying stress on the steel beam, Vickers indentations were performed in three rows, seven times per row at 3-mm intervals to avoid interference (Fig. 9). The indentation contact area  $\left( {A_{\rm{c}}^{{\rm{pro,opt}}}} \right)$ is obtained by measuring the projected area of the residual imprint using optical microscopy because elastic recovery during unloading mainly occurs along the indenting direction and is negligible in the in-plane direction [Reference Alcalá, Barone and Anglada24]. Here, the indentation contact depth (h c) is calculated based on the ideal geometrical shape of Vickers indenter as [Reference Kang, Kim, Park, Kim and Kwon7]:
 $${h_{\rm{c}}} = \sqrt {{{A_{\rm{c}}^{{\rm{pro,opt}}}} \over {24.5}}} \quad .$$
(a) Schematic diagram and (b) photo of uniaxial-stress-generating jig.

The indentation contact area  $\left( {A_{\rm{c}}^{{\rm{pro,opt}}}} \right)$ corresponding to the stressed state was measured without releasing the stress state.
In addition, Vickers indentations were performed with a maximum load of 490 N (50 kgf) for 28 block-shaped metal specimens including carbon steels, stainless steels, Al alloys, Cu alloys, Ti alloy, and API steels. These specimens were annealed to relax internal stresses and polished with up to 1.0-μm alumina powder. Tension tests were performed on 28 metal specimens subjected to the same heat treatment to obtain yield strength (σYS), ultimate tensile strength (σUTS), and strain-hardening exponent (n).
Acknowledgments
This work was supported by the National Research Foundation of Korea (NRF) grant funded by the Korea government (MSIT: Ministry of Science and ICT) (Nos. NRF-2015R1A5A1037627 and 2017M2A8A4015155).