Introduction
In China, it is estimated that the number of people aged 60 years and older will reach 171 million in 2010 and 248 million in 2020. By 2051, China's aging population is expected to peak at 438 million (Mui, Reference Mui2010). The increasing number of older adults in China has resulted in greater demands for culturally valid and reliable geriatric research instruments. Although depression is a common psychological problem among older adults, few researchers have studied depression measures among the elderly in China. Research suggests that there were cultural and gender differences in depressive feelings due to different modes of expression and interpretation of stressful life situations (Mui and Kang, Reference Mui and Kang2006). At present, scientific studies of China's aging population are still in their infancy and cross-cultural validation of depression instruments is an important step in studying geriatric mental health among older population in China.
The Center for Epidemiologic Studies Depression (CES-D) Scale is designed to be a self-reported screening instrument which is commonly used to obtain information about a wide range of depressive symptoms of the respondent. The original CES-D is a 20-item measurement scale designed for use in the general population (Radloff, Reference Radloff1977). Psychometric studies identified four domains among the original 20-items: namely five-item depressive affect (DA) indicators: “Blues,” “Depressed,” “Lonely,” “Crying,” and “Sad”; seven-item somatic symptoms (SS) indicators: “Bothered,” “Appetite,” “Concentrate,” “Talked less,” “Effort,” “Restless,” and “Not Get Going”; four-item positive affect (PA) indicators: “”Hopeful,” “Enjoy,” “Happy,” and “As Good”; and four-item interpersonal relationships (IR) indicators: “Failure,” “Fearful,” “Unfriendly,” and “Disliked” (Mui et al., Reference Mui, Burnette and Chen2001; Shafer, Reference Shafer2006). This scale has been translated into many different languages, including Russian, Spanish, French, Japanese, Italian, and Chinese. Although the 20-item CES-D Scale (CES-D 20) has been validated with excellent reliability and validity indicators, it has been criticized for being too lengthy for use with older populations (Boey, Reference Boey1999; Mui et al., Reference Mui, Burnette and Chen2001; Cheng et al., Reference Cheng, Chan and Fung2006).
Several versions of the shortened CES-D Scale have been developed and validated with the goal of minimizing response fatigue (Lee and Chokkanathan, Reference Lee and Chokkanathan2008). Shrout and Yager (Reference Shrout and Yager1989) validated the CES-D Scale into five items and the new version had satisfactory sensitivity and specificity indicators from an adult sample. Kohout and colleagues (Reference Kohout, Evans and Cornoni-Huntley1993) established an 11-item version of the CES-D Scale short form. More recently, a ten-item CES-D Scale short form was refined from the 20-item original version by Andresen and colleagues (Reference Andresen, Malmgren, Carter and Patrick1994). Based on the scale's item-total correlations, they removed those highly redundant items from the original scale and shortened it into a ten-item version (hereafter called Andresen's CES-D 10) (Andresen et al., Reference Andresen, Malmgren, Carter and Patrick1994). In Andresen's CES-D 10, three items were retained from the original full scale on DA, five items on SS, and two on PA. No IR item was retained. Later, there were several studies on the psychometric properties of the Andresen's CES-D 10 Scale in terms of validity and reliability for use among older populations. In addition, internal consistency, test–retest reliability, concurrent validity, and construct validity were examined. For example, based on a large community sample of older adults in Hong Kong (n = 635), Boey (Reference Boey1999) found that the ten-item CES-D Scale demonstrated good internal consistency (α = 0.78) and an acceptable test–retest reliability (γ = 0.44). There was also a strong agreement of responses between CES-D 10 and CES-D 20 with different cut-off points as indicated by the κ statistics (Boey, Reference Boey1999). Some researchers focused on assessing sensitivity and specificity of the CES-D 10 by establishing cut-off points to classify respondents who may be at risk of depression. A cut-off score of ten was generally selected in the ten-item CES-D Scale which ranges from 0 to 30, resulting in high specificity in older samples (Andresen et al., Reference Andresen, Malmgren, Carter and Patrick1994; Zhang et al., Reference Zhang2012). Cheng and Chan (Reference Cheng and Chan2005) used 12 as a cut-off point that showed higher sensitivity in the CES-D 10 among a sample of Chinese elderly people in Hong Kong.
Validation studies on factor structure of the CES-D 10 are few and results are inconclusive. Carpenter and colleagues (Reference Carpenter1998) identified a single-factor model for both the original and shortened form of CES-D among a sample of women with breast cancer. Yu et al. (Reference Yu, Lin and Hsu2013) indicated that the single-factor model with added covariance between the errors of the two items fitted the data well in a Taiwan sample. Based on a large sample of older patients, Andresen and colleagues (Reference Andresen, Malmgren, Carter and Patrick1994) developed a two-factor model and results showed that DA and SS were loaded together on the first factor, and PA was loaded on the second. The two-factor model has been consistently supported in an older sample in Singapore (Lee and Chokkanathan, Reference Lee and Chokkanathan2008), an adolescent sample in Canada (Bradley et al., Reference Bradley, Bagnell and Brannen2010), and an adult sample with HIV in Canada (Zhang et al., Reference Zhang2012). There is also evidence of a three-factor model among an older Chinese in Hong Kong (Cheng et al., Reference Cheng, Chan and Fung2006). Methodologically, it is more appropriate to use confirmatory factor analysis (CFA) for this validation study, which may provide a more definitive conclusion about the factor structure of the CES-D 10.
The original 20-item CES-D Scale is a standardized measure and has been validated to be appropriate for the general population in Western countries; however, Mui and colleagues (Reference Mui, Burnette and Chen2001) argued that the hierarchy of factors may vary in different cultural contexts and the well-being factors might not be meaningful in samples from the non-Western cultures. Although the CES-D 10 has been validated in Hong Kong (Boey, Reference Boey1999; Cheng and Chan, Reference Cheng and Chan2005; Cheng et al., Reference Cheng, Chan and Fung2006), its applicability for use among older population in Mainland China remains unclear. Psychometrically, more cross-cultural validation work on the CES-D 10 is warranted. In addition, literature in the English language has consistently reported that there are gender differences in rates and correlates of depression (Mui et al., Reference Mui, Burnette and Chen2001; Mui and Kang, Reference Mui and Kang2006). Cross-culturally, it is important to examine whether the expression and interpretation of depressive feelings is different between older men and women in China. Thus, the primary purpose of this study is to evaluate the factor structure of the CES-D 10 Scale in a probability sample of community-dwelling older population in China. The secondary purpose is to explore gender differences in reliability scores of each item, mean scores and prevalence rates of depressive symptoms.
Methods
Study sample
The secondary data for this research are from wave I (2011) of the China Health and Retirement Longitudinal Study (CHARLS). CHARLS is modeled after the United State Health and Retirement Study (HRS) and related aging surveys such as the English Longitudinal Study of Aging (ELSA) and the Survey of Health, Aging and Retirement in Europe (SHARE) (Zhao et al., Reference Zhao2013). CHARLS aims to develop the best scientific database to understand the soon-to-be old and older adult population in China. The first wave of CHARLS was done in 2011 and the study included about 10,000 households and 17,500 sample respondents in 150 counties/districts and 450 villages/resident committees. CHARLS is a biennial survey of a nationally representative sample of Chinese residents who are aged 45 years and over within households in China. The study examined status and well-being of older residents in China communities in terms of demographic, family, health and mental health status, daily functioning characteristics, healthcare and insurance, work, retirement, pension, income, expenditure, and assets. Data collection was done using computer-assisted interviewing. This study focused on mental health of the older population in Chinese context. The cut-off age for the sample was set at 60 years old. . In China, the mandatory retirement age for men is at 60 years old; women are required to retire at 50 or 55 years old, depending on the regulations of their workplace (government or corporate settings). For the purpose of this secondary research, Chinese older adults are defined as people who were 60 years and older. Using this inclusion criterion, a total of 7,660 older respondents were selected for the study. In order to avoid Type I errors, approximately 10% of the older subsample (n = 742) was randomly selected and used for analyses. Statistically, with a very large sample, the goodness-of-fit test becomes sensitive to even very small, inconsequential departures from a distribution (Mui et al., Reference Mui, Burnette and Chen2001).
Description of the CES-D Scale
In CHARLS, respondents were asked to rate how often they experienced each of the ten depressive symptoms of the 10-item CES-D Scale in the past week. Each item was scored on a four-point scale ranging from 0 (rarely or none of the time) to 3 (most or all of the time) with the total possible summary score of 0 to 30. Depressive symptoms included (1) being bothered by things that do not usually bother, (2) having trouble concentrating, (3) feeling depressed, (4) feeling that everything you did was an effort, (5) feeling hopeful about the future, (6) feeling fearful, (7) being sleepless, (8) feeling happy, (9) feeling lonely, and (10) inability to “get going.” Two positively worded items (hopeful and happy) were reverse-coded before analysis. Thus, higher scores indicate higher levels of depressive symptoms. Furthermore, the CES-D 10 Scale was provided both in Chinese and English in CHARLS. The survey questionnaire, including the CES-D 10 Scale went through extensive review and its feasibility, sensitivity, and intelligibility were field tested before the actual data collection process. Details were reported in the original study documentation (Zhao et al., Reference Zhao2013).
Data analysis
Mplus 7.0 software was used for a three-phase analysis. The first phase was analyzing the psychometric properties of the CES-D 10 Scale. CFA was performed to determine whether all items were loaded on one-, two-, or three-factors. According to previous studies, items 1, 3, 6, and 9 are grouped together as the “depressive affect” factor, items 2, 4, 7, and 10 together as “somatic retardation” factor (also known as “somatic symptoms”), and the rest of the items (items 5 and 8) as the “positive affect” factor (terminology adopted from Cheng et al., Reference Cheng, Chan and Fung2006). Three competing factor models were tested based on the work of Lee and Chokkanathan (Reference Lee and Chokkanathan2008). All items represented one construct in a single-factor model. In a two-factor model of the CES-D 10 Scale, DA and SR (DA/SR) were loaded in the first factor and PA remained in the second one. A three-factor solution included DA, SR, and PA factors.
The second phase of analysis was utilizing multiple-groups CFA methods, which helped to examine whether the same construct of depression was perceived in a similar way across female and male groups. Statistical procedures suggested by Brown (Reference Brown2006) and Kline (Reference Kline2010) were adopted. Specifically, the CFA model was tested separately in each group. If the measurement model fits the data for both groups (e.g. female and male groups), the least restricted solution (equal form) was conducted. If the model of interest fits across both groups, it suggested that it had identical factor structure. And then subsequent models were evaluated that entail increasingly restrictive constraints; that was, equal factor loadings, equal intercepts, equal residual variances, and so on. Third, R2 reliability coefficients were used to assess individual item's reliability by gender. Moreover, mean scores and prevalence rate of depressive symptoms were examined between males and females.
Mean- and variance-adjusted weighted least squares (WLSMV) were chosen as an estimator in the study. WLSMV was a robust estimator designed for ordered-categorical outcomes (Kline, Reference Kline2010). It generally performed well except for the small sample size (n = 200) or markedly skewed distribution of variables, which was not the case in this study. The root mean square error of approximation (RMSEA; Browne and Cudeck, Reference Browne, Cudeck, Bollen and Long1993), the comparative fit index (CFI; Bentler, Reference Bentler1990), Tucker–Lewis fit index (TLI, Hu and Bentler, Reference Hu and Bentler1999), Weighted Root Mean Square Residual (WRMR; Yu and Muthen, Reference Yu and Muthen2002), and χ2 statistic (Bollen, Reference Bollen1989) were used as indices of fit for the models. The standards of a good model fit were RMSEAs below 0.05 and upper bound = 0.08, CFIs or TLI above 0.95, and WRMR below 0.90. Generally, a statistically non-significant χ2 indicated a good model fit. It is noteworthy that χ2 is inflated by sample size. Large sample size solutions (n > 500) are routinely rejected on the basis of χ2 even when the predicted variance–covariance matrix and sample variance–covariance matrix are negligible (Brown, Reference Brown2006).
Required assumptions for the CFA were tested and there were no violations of concern (i.e. small sample size and markedly skewed distribution of variables). Approximately 7.7 % of respondents did not complete the scale. The percentage of missing data was small and no systematic pattern of missing data was identified. In this study, the list-wise deletion method was used to remove missing data.
Results
The socio-demographic characteristics of the sample
The age of the older Chinese sample (n = 742) ranged between 60 and 92 years and their mean age was 68.46 years (SD = 6.92). About 76% of the respondents were young-old residents aged between 60 and 74 years. There were an almost equal proportion of participants who were male (51.4%) and female (48.6%). Most older Chinese respondents had low levels of education with 80% of them having completed only an elementary school education. In terms of living arrangement, 78.2% of the sample lived with a spouse or partner at the time of the interview. The majority (78.4%) of the respondents were registered as “agricultural Hukou” which meant that they were more likely to be born in rural areas. Hukou is the household registration system required by law in Mainland China. For migrant families, this system is a possible source of stress and mental health issues because they would be denied social benefits if they do not have Hukou in a new city. In China, social benefits are tied to Hukou and these benefits vary widely from urban to rural areas.
Three competing models’ comparisons of CES-D 10
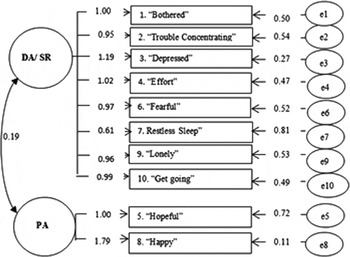
The one-, two-, and three-factor solutions for the ten indicators of the CES-D 10 Scale were compared by conducting CFA. When models are nested, the χ2 statistic can be used to statistically compare the fit of the solution (Brown, Reference Brown2006). In this study, the one-factor model was nested under the two-factor solution. Similarly, the two-factor solution was nested under the three-factor solution. Table 1 showed that the two-factor model provided a significantly better fit to the data than the one-factor model (χ2 (df = 1) = 153.96, p < 0.001). Statistical significance was not found in data fitting between the two-and three-factor model (χ2 (df = 2) = 5.90, p = 0.05). Compared to the other two models, the two-factor model was simpler and a better fit to the data (see Figure 1).
One-, two-, and three-factor models’ comparisons

Note: CFI = comparative fit index; TLI = Tucker–Lewis fit index; RMSEA = root mean square error of approximation; WRMR = Weighted Root Mean Square Residual.
Two-factor model of the CES-D 10.

Two-factor structure of CES-D 10
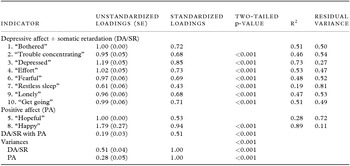
The model fit indices showed that the two-factor model appropriately represents the observed data. CFI and TLI were above the cut-off scores of 0.90 (0.99 and 0.98, respectively), the RMSEA was below the cut-off scores of 0.05 (RMSEA = 0.045), and WRMR was lower than the cut-off scores of 0.90 (WRMR = 0.80) (see Table 1). Table 2 summarized the unstandardized and completely standardized parameter estimates from this solution. All freely estimated unstandardized parameters were statistically significant (p < 0.001). Results indicated that all factor loadings were considered salient because the completely standardized factor loadings of 0.30 and above (Brown, Reference Brown2006). R2 revealed that the most indicators (except for the item “restless sleep” and “feel hopeful”) were strongly related to their purported latent factors (range from 0.46 to 0.89). For example, 73% of the variance in the observed measure of “feeling depressed” was accounted for by the latent variable of DA/SR. Moreover, the relationship between the dimensions of DA/SR and PA was moderate (0.51), suggesting evidence of the discriminant validity. Moreover, the variance for PA factor derived from items 5 and 8 had a low factor loading (0.28), which will be discussed later.
Unstandardized and standardized loading values for each indicator

Note: Total sample size n = 742, missing 57; SE = standardized error.
Tests of factorial invariance
Do female and male older respondents conceptualize the construct of depression in the same way? Table 3 showed the results of simultaneous analysis of equal form, which specified an identical pattern of free and fixed parameters for both gender groups. There was a significant difference of χ2 contributions between the male group (93.53) and the female group (50.60) (χ2 (df = 86) = 144.13, p < 0.001). Female group demonstrated excellent fit in the model, χ2 (df = 34) = 45.85, p = 0.08 (RMSEA = 0.03, CFI = 0.99, TLI = 0.99, and WRMR = 0.58). Compared to females, males had a relatively worse model fit for the two-factor solution χ2 (df = 34) = 77.62, p < 0.001 (RMSEA = 0.06, CFI = 0.97, TLI = 0.96, and WRMR = 0.81). Thus, the pattern of free and fixed parameters was not equivalent.
Tests of equal factor structure of depression in men and women

Note. n = 684. ***Two-tailed p < 0.001. In the equal factor structure, male group had more χ2 contributions (93.53) than female group did (50.60).
CFI = comparative fit index; TLI = Tucker–Lewis fit index; RMSEA = root mean square error of approximation; WRMR = Weighted Root Mean Square Residual.
Gender differences in reliability analysis
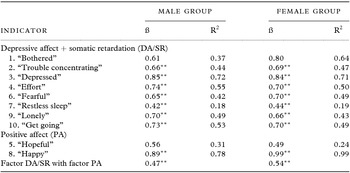
As shown in Table 4, the two-factor model was tested separately in each group. In both groups, all freely estimated factor loadings were statistically significant (all p < 0.01). Results indicated that all factor loadings were considered salient in both male and female groups (larger than 0.30). R2 values indicated how strongly each item related to its purported latent factors, therefore showing item's reliability between males and females. Evidently, some indicator's R2 reliability coefficients differed between the female group and the male group. For example, DA/SR accounted for 37% and 64% of the variance in the depression indicator (“bothered”) for the male and female group, respectively. It also showed that 78% of variance in the indicator “happy” was explained by the PA in the male group while the proportion of variance increased dramatically to 99% in the female group. There were also differences in the proportion of variance explained by the indicators “fearful” and “hopeful” by gender.
Standardized loading values for each indicator by gender

Note: In male group, n = 350; missing 31; in female group, n = 334; missing 26.
ß = standardized loadings.
**Two-tailed p-value < 0.01.
Gender differences in mean scores and prevalence rate
The total score of the CES-D 10 ranged from 0 to 30. The mean score for the entire sample was 8.97. There was a difference in mean scores between males and females on the CESD-10 (7.87 vs. 10.14, t (df = 617.06) = −4.57, p < 0.001). In addition, the mean scores for the DA/SR and PA were computed by gender. Male and female older adults differed significantly on the mean scores of both DA/SR (5.67 vs. 7.64, t (df = 627.54) = −4.69, p < 0.001) and PA (2.21 vs. 2.52, t (df = 663) = −2.1, p < 0.05).
In order to have better cross-study comparability, a cut-off score of 12 was adopted which is consistent with previous study on older Chinese sample in Hong Kong (Cheng and Chan, Reference Cheng and Chan2005). Results showed significant gender differences on the prevalence rate of depressive symptoms (males and females were 22.31% and 37.60%, respectively) (χ2 (df = 1) = 13.96, p < 0.001). The estimated prevalence rates of depressive symptoms for males and females are comparable to Boey's study (Reference Boey1999) on older Chinese in Hong Kong (18.3% and 36.3%, respectively). Boey's sample also included older Chinese aged 60 years and above and he used the cut-off point of ten. Research used other screening instruments such as Geriatric Depression Scale reported 45.7% rate of depression among Chinese immigrant elderly sample in New York City (Mui and Kang, Reference Mui and Kang2006).
Discussion
The present study aimed to develop and evaluate the factor structure of the CES-D 10 among a probability sample of older adults in China. Results showed that a two-factor model that divided items into DA/SR and PA constructs best fit the data in our study sample. The results are consistent with previous studies (Lee and Chokkanathan, Reference Lee and Chokkanathan2008; Bradley et al., Reference Bradley, Bagnell and Brannen2010). However, the factor structure results of the present study are not consistent with the findings of Cheng et al. (Reference Cheng, Chan and Fung2006). They showed that the three-factor model fitted the data from an elderly sample in Hong Kong. The different findings could be contributed to sample differences and the different way of constructing the model. Cheng and colleagues (Reference Cheng, Chan and Fung2006) used second-order factor models for the two- and three-factor model. In other words, the higher construct of depression can be used to explain the intercorrelations of the first-order factor. However, the present study used intercorrelated models.
Interpretation of the fit of two-factor model should be handled with caution. First, the PA factor loadings in the scale are less than satisfactory. Specifically, PA variables showed lower construct validity than DA/SR's in the entire sample, indicated by the lower factor loading on this construct. Conceptually, PA items may not be a good measure of depressive symptom for both males and females. In fact, the factor loadings of PA were disproportional because item 5 (“being hopeful”) had a very low loading and item 8 (“feeling happy”) had a very high loading. Bradley et al. (Reference Bradley, Bagnell and Brannen2010) suggested that PA might need additional items or modified items to have a better fit in the model.
Second, the correlation between the DA/SR and PA is low. This result is consistent with previous studies (Schroevers et al., Reference Schroevers, Sanderman, Sonderen and Ranchor2000; Cheng et al., Reference Cheng, Chan and Fung2006; Lee and Chokkanathan, Reference Lee and Chokkanathan2008). One possible explanation is that PA items may include other constructs in addition to depressive symptomatology, therefore leading to a weak correlation (Schroevers et al., Reference Schroevers, Sanderman, Sonderen and Ranchor2000). Lee and Chokkanathan (Reference Lee and Chokkanathan2008) explained the meaning of depression as the “feeling of worthlessness, hopelessness, and helplessness” (p. 596). They argued that the reversed-coded items (“feeling happy” and “being hopeful in the future”) in PA factor are conceptually dissimilar to worthlessness and hopelessness. The other possible explanation is that Asian populations tend to report their feelings with moderation (Mui and Kang, Reference Mui and Kang2006). Saint Arnault et al. (Reference Saint Arnault, Sakamoto and Moriwaki2005) suggested that PA did not help discriminate depressed participants from non-depressed participants among Japanese women because they may suppress the expression of PA. This pattern of moderated self-reporting was also found in other Asian samples in other countries. For example, Cho and Kim (Reference Cho and Kim1998) indicated that the total CES-D scores increased because Korean respondents did not endorse positive items. In view of these possible reporting patterns, these findings should be interpreted with caution when the CES-D Scale is used with Asian samples because the prevalence rates may not be representative of their true psychological health. One possible way to tackle self-reporting bias is to modify the positive-worded items into negative-worded items so that the items may be culturally more relevant for research samples in Asian countries. This approach will need to be tested empirically. Using the original CES-D items, a version with the PA items modified into negative items (“not Hopeful,” “do not Enjoy,” “not Happy,” and “not as Good”) may be able to assess the cultural meanings of these items. As Sutin and colleagues (Reference Sutin2013) pointed out, older individuals may become less happy rather than experience a depressed mood as they continue to deal with age-related stressful life events such as death and dying.
In addition, more attention is warranted in examining gender variant factor structure of the CES-D 10 Scale based on the multi-group analysis. Specifically, variance can be shown in items’ reliability coefficients, mean score, as well as prevalence rates of depressive symptoms. Gender-relevant response items include “being bothered by things,” “feeling fearful,” “feeling happy,” and “feeling hopeful about the future” in the present study. The former three items were endorsed more by the female group and the last one more by the males, suggesting that some items in the depression scales may be expressed or perceived differently by older Chinese men and women in China. The gender difference in depression experience in this older Chinese sample was also evident by the differences in mean score of the CES-D 10 Scale and prevalence rate of depression. This finding is consistent with most Western mental health research (Mui et al., Reference Mui, Burnette and Chen2001; Leung et al., Reference Leung, Chen, Lue and Hsu2007).
Research on older Asian immigrant populations has identified important correlates of depression among the Chinese and Korean immigrant elderly people in the United States. Specifically, older Chinese immigrant women experienced higher levels of depression than their male counterparts, other things being equal. Other stress and coping factors of depression were poor perceived health, higher levels of stressful life events, lower levels of religiosity, children not in proximity, and more assistance from adult children (Mui and Kang, Reference Mui and Kang2006). The perception, meaning, interpretation, and coping ability of these factors could be possible sources of gender differences in depressive mood experienced. In China, there are clear gender differences in the expectations among family roles (such as grandmother/grandfather; mother/father) and social roles (e.g. friend, relative, volunteer, and neighbor). Culturally, older Chinese women may feel more pressure because they are expected to be caretakers of grandchildren and other members of their extended family. Older Chinese men, on the other hand, are not expected to be caregivers and subsequently may experience less family-related stress (Mui, Reference Mui2010). More research on possible factors associated with gender differences among older Chinese is warranted
This study had several limitations. Since the sampling frame of this study was from community-dwelling Chinese elderly people only, generalizability to an institutionalized older population is limited. In Chinese context, the nursing home population may be a “very unhappy” group because they are more likely to be socially isolated than other Chinese older-adult populations. Using the CES-D 10 with the Chinese nursing home population may have a ceiling effect. Under the Chinese one-child policy, visitation and companionship from a child to the nursing home is less likely to occur, especially if the older adult's only child is not in close proximity or the child has already died (Mui, Reference Mui2010). Second, cross-cultural response bias may be an issue because the CES-D 10 is a self-reported measure. For Chinese elderly people, the issues of mental illness stigma and mental health ignorance may be barriers for them to express true feelings of depressive symptoms (Chung and Wong, Reference Chung and Wong2004). This may create problems of underreporting and underestimating mental health problems among the elderly population in China. Possibly, older Chinese respondents may give socially appropriate responses rather than report their real feelings. In sum, the CES-D 10 Scale is a valid, reliable, and useful mental health measure for older people in China, and gender difference in depression expression is evident. However, more psychometric work is needed to examine the utility of the PA items in assessing depression.
Conflict of interest
None.
Description of authors’ roles
H. Chen conducted the initial analyses and wrote the initial draft. A. C. Mui strengthened the organization of the paper and the interpretation of findings. Both authors contributed equally to the final version of the paper before submission.