INTRODUCTION
The Suape coastal zone is located 40 km south of Recife, capital of the state of Pernambuco, Brazil, and has suffered since the 1980s the effect of anthropogenic action through the development of a port complex, thermoelectric plant, dredging, reef dynamiting, landfills on the reef line, heavy traffic of boats and ships, and suppression of mangrove and native vegetation (Neumann et al., Reference Neumann-Leitão, Medeiros, Parente, Neumann-Leitão and Koening1998; Muniz et al., Reference Muniz, Neto, Macêdo and Pinheiro Filho2005; Pessoa et al., Reference Pessoa, Neumann-Leitão, Gusmão, Silva and Porto-Neto2009). In addition, there were major changes in the geomorphological conditions and hydrodynamic patterns in the area (Paiva & Araújo, Reference Paiva and Araújo2010). These processes have led to an excessive dispersion of suspended matter that affects the distribution and composition of organisms that inhabit mainly the water column such as phytoplankton and the hydrological conditions of the adjacent area (Pessoa et al., Reference Pessoa, Neumann-Leitão, Gusmão, Silva and Porto-Neto2009).
Phytoplankton represents the basis of the food web and modifications in its structure results in changes throughout the trophic web. In addition, it absorbs excess CO2 (biological pump), limiting the processes of marine acidification, and is an effective water quality bioindicator (Cordeiro et al., Reference Cordeiro, Feitosa, Flores Montes and Honorato da Silva2014).
Therefore, the understanding of factors that regulate phytoplankton biomass is essential for the understanding of changes in the environment in its temporal and spatial variations. This is fundamental in studies aimed at minimizing or even preventing negative impacts on the aquatic environment (Anjos et al., Reference Anjos, Passavante, Silva-Cunha and Honorato da Silva2012).
In the Suape estuarine-port complex (EPC), some studies on plankton have already been carried out (Eskinazi-Leça & Koening, Reference Eskinazi-Leça and Koening1985/86; Koening, Reference Koening1997; Neumann-Leitão et al., Reference Neumann-Leitão, Koening, Macêdo, Medeiros, Muniz and Feitosa1999; Koening et al., Reference Koening, Eskinazi-Leça, Neumann-Leitão and Macêdo2003; Bezerra Júnior et al., Reference Bezerra Júnior, Diaz and Neumann-Leitão2011; Borges, Reference Borges2011). This work aimed to continue the environmental monitoring due to constant anthropogenic changes in the area.
MATERIALS AND METHODS
Study area
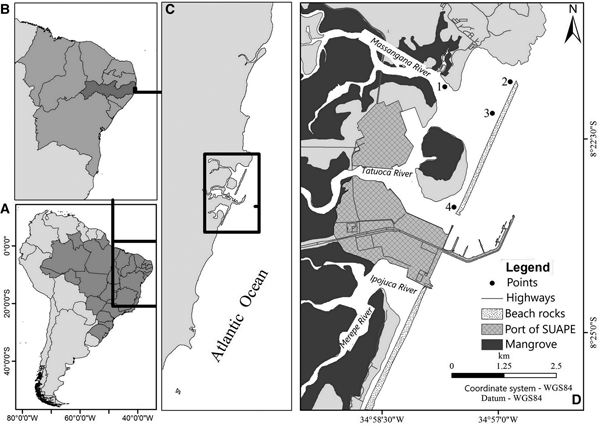
Suape Port is located on the southern coast of Pernambuco (08°23′45″S 34°58′04″W) (Figure 1), between the municipalities of Cabo de Santo Agostinho and Ipojuca, occupying an area of ~13,500 ha, of which 323,258 ha correspond to the area of the Organized Port. The environments found in the surroundings include mangroves, sandy beaches, reefs and banks of algae, among others.
Location of the Estuary Port Complex of Suape, PE, Brazil and location of sampling points.

The tides recorded in the region are semidiurnal, being classified in terms of amplitude as mesotidal, with amplitude of ~3.0 m (Suape, 2015).
According to Köppen, the climate of the Pernambuco coast is of As’ type, characterized by two distinct periods in the pluviometric regime: a dry season and a rainy season. The area has average annual rainfall of 2.272 mm, air temperature of 25.6 °C and relative humidity of 90% (Aragão, Reference Aragão2000; Torres & Machado, Reference Torres and Machado2011).
Before the construction of the port complex, four rivers (Massangana, Tatuoca, Ipojuca and Merepe) converged on Suape Bay, an estuary partially isolated from the ocean by an extensive sandstone line. Today, only the Massangana and Tatuoca Rivers converge to Suape Bay. Ipojuca and Merepe Rivers had their communication with the bay interrupted by intensive earthworks to build the port complex. As a result of restricted access to the sea, the backflow of these rivers flooded the surrounding fields causing damage to agriculture. The government solution was a partial break of the baseline. As a result, a large amount of suspended material now passes through the opening of the drag line that is installed inside the port, with high-cost dredging. In the Suape area, more than 600 hectares of mangroves were destroyed (Neumann et al., Reference Neumann-Leitão, Medeiros, Parente, Neumann-Leitão and Koening1998).
Data preparation
Collections were performed in six months including the rainy period (July 2015, July and August 2016) and dry period (November 2015, and January and April 2016) at four fixed points on the high tide and low tide, in the inner port region (Figure 1).
The following hydrological parameters were determined: water transparency (Secchi); temperature and salinity by CTD; depth by an echo sounder; dissolved oxygen concentration by the modified Winkler method and described by Strickland & Parsons (Reference Strickland and Parsons1972); saturation rate by the UNESCO Table (1973); dissolved nutrients nitrite, nitrate by Strickland & Parsons (Reference Strickland and Parsons1972), ammonia, phosphate and silicate by Grasshoff et al. (Reference Grasshoff, Ehrhardt and Kremling1983) and suspended particulate matter by the gravimetric method of Baumgarten et al. (Reference Baumgarten, Rocha and Niencheski1996).
Samples to obtain phytoplankton biomass were collected in 5 l Niskin bottles.
For fractionation, a PVC pipe with 20 µm mesh was used. The biomass was subsequently calculated; 3 l of samples were vacuum filtered in Whatman GF/F glass fibre filters of 47 mm in diameter and 0.7 µm porosity, with 1.5 l for total biomass and 1.5 for fractionated biomass quantified by the chlorophyll-a (chl-a) content by the spectrophotometric method of UNESCO (1966). In order to perform calculations, the equation of Parsons & Strickland (Reference Parsons and Strickland1963) was used, and the results were expressed in mg m−3.
Statistical analysis
For statistical analysis, data normality and homogeneity were tested through the Shapiro Wilk and Levene tests, respectively. Subsequently, the non-parametric Kruskal–Wallis test was used to verify spatial, seasonal and tidal differences among samples.
PERMANOVA was performed to verify tidal, seasonal and spatial differences of environmental variables. For all tests, values of P < 0.05 were considered significant.
RESULTS
Climatic and hydrological variables
Rainfall precipitation had annual total of 1913.20 mm in 2015 and 1705 mm in 2016, with maximum monthly value of 478 mm in May 2016, and a minimum of 13.70 mm in October 2016, with median of 83.2 mm (Figure 2). In 2015 and 2016, most pluviometric data were below the historical average of 31 years, with significant seasonal differences (Table 1) (P = 0.02).
Rainfall data from the Experimental Station of Curado-PE in 2015 and 2016 and the average historical monthly values (1985–2016). Source: INMET.

Biological and abiotic variables in dry and rainy seasons (Min = minimum, Max = maximum, Med = Median), Kruskal–Wallis test, with P-values for the various treatments (seasonal, spatial and tidal) (Chl-a, Chlorophyll-a; D.O., Dissolved Oxygen; D.O.S., Dissolved Oxygen Saturation; S.P.M., Suspended particulate matter).

Samples were always collected in spring tide, with minimum of 0.0 m at low tide and maximum of 2.5 m in high tide, both in April 2016, with amplitude of 2.5 m.
The minimum depth was 1.3 m and the maximum was 15 m, both at point 3 and in the low tide (April and January 2016, respectively), with median of 6.5 m. There was a significant spatial variation among the different collection points (P = 0.00), where point 4 was different from points 1 and 3 (Table 1).
The water transparency was lower at point 1 in July 2016 with 0.50 m and higher at point 4 in the high tide in November 2015 with 5.2 m, with median of 1.7 m.
The water transparency showed significant seasonal differences (P = 0.00) and between tides (P = 0.04), being more transparent in the dry season and in the high tide (Table 1).
The temperature varied from 25.9 to 31.13°C, both at point 1 and in the high tide, with minimum in July 2015 and maximum in April 2016, with median of 28.03 °C. It presented significant variation with higher temperatures in the dry season (P = 0.00) (Table 1).
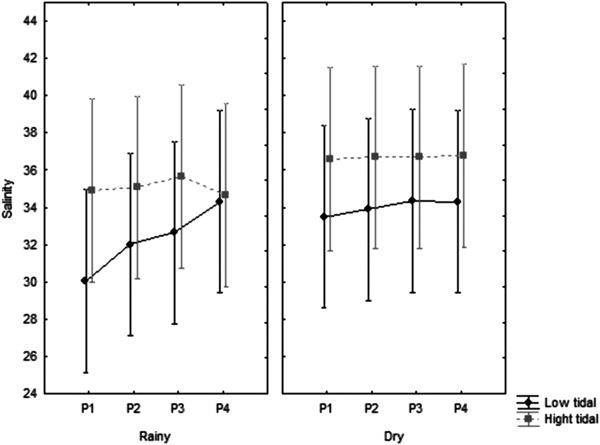
Salinity presented its lowest and highest levels at point 1, in the lowest tide, varying from 19.75 in July 2015 to 37.20 in April 2016, with median of 36.37 (Figure 3). There was significant seasonal and tidal variation (P = 0.01 and P = 0.00, respectively), with higher salinities in the dry season and in the high tide (Table 1).
Distribution of salinity, at the four fixed collection points collected, at low tide and high tide, with the median and interquartile range.

The dissolved oxygen content (DO) presented minimum concentration of 2.60 ml l−1 at point 1 at low tide in January 2016 and maximum of 5.13 ml l−1 at point 1 in August 2016, with median of 4.47 ml l−1. The DO saturation rate ranged from 61.75 to 125.90%, with median of 105.80% (Figure 4). There was significant variation between tides, exclusively for the dissolved oxygen saturation rate (P = 0.00), with higher levels in the high tide (Table 1).
Distribution of dissolved oxygen saturation, at the four fixed collection points, at low tide and high tide, with the median and interquartile range.

The suspended particulate matter (SPM) showed minimum concentration of 1.6 mg l−1 at point 1 in April 2016 and maximum of 50.56 mg l−1 at point 3 in November 2015, with median of 35.56 mg l−1, showing no significant differences (Table 1).
Nitrite presented value of 0.01 µmol l−1 in several points and months sampled, and maximum of 1.34 µmol l−1 at point 3 in the high tide in April 2016, with median of 0.01 µmol l−1, showing no significant variations (Table 1).
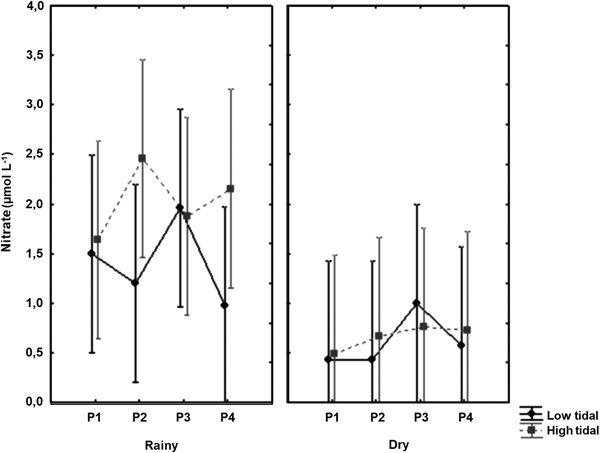
Nitrate values ranged from 0.01 µmol l−1 at point 3 in the high tide in April 2016 and at point 4 at low tide in August 2016 to 4.48 µmol l−1 at point 3 in the low tide on July 2015, with median of 1.07 µmol l−1 (Figure 5) showing significant seasonal variation (P = 0.00), with higher values in the rainy season (Table 1).
Distribution of nitrate, at the four fixed collection points, at low tide and high tide, with the median and interquartile range.

Ammonia levels ranged from 0.01 µmol l−1 at several points and months sampled to maximum concentration of 0.84 µmol l−1 at point 1 on January 2016 at low tide, with median of 0.10 µmol l−1, with no significant variations (Table 1).
Phosphate levels ranged from 0.02 µmol l−1 in the low tide at point 1 on August 2016 to 0.45 µmol l−1 at point 2 on July 2015 in the high tide, with median of 0.12 µmol l−1, with a significant difference for tide, with higher levels at low tide (P = 0.03) (Table 1).
Silicate showed minimum concentration of 0.57 µmol l−1 at point 2 in the high tide in April 2016 and maximum of 51.73 µmol l−1 at point 3 in the low tide in July 2015, with median of 7.38 µmol l−1 (Figure 6), with significant seasonal variation, with higher levels in the rainy season (Table 1).
Distribution of silicate, at the four fixed collection points, at low tide and high tide, with the median and interquartile range.

Chlorophyll-a
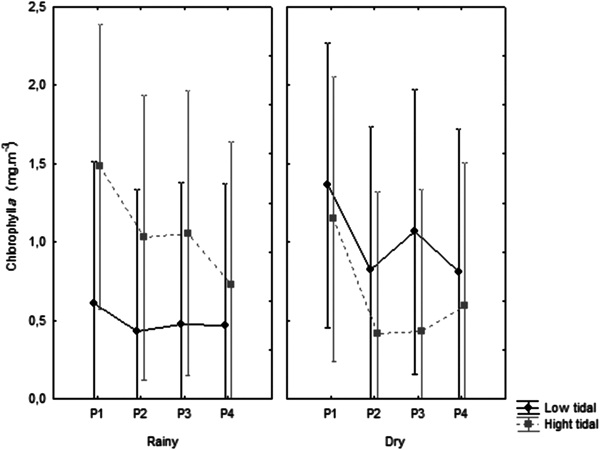
Chlorophyll-a content ranged from 0.04 mg m−3 at point 3 in the high tide in August 2016 to 3.48 mg m−3 at point 1 in the high tide in July 2015 (Figure 7), with median of 0.50 mg m−3, without significant tidal, seasonal and spatial variations (Table 1).
Distribution of chlorophyll-a, at the four fixed collection points, at low tide and high tide, with the median and interquartile range.

Chlorophyll-a <20 µm content ranged from 0.02 mg m−3 at point 1 in the low tide in July 2015 and in the high tide in August 2016, at point 2 in January 2016 and August 2016, at Point 3 in January 2016 in the high tide and in April 2016 and August 2016 in the low tide and at point 4 in January 2016 in the high tide and in April 2016 in the high tide and in the low tide. It obtained maximum value of 2.73 mg m−3 at point 1 in the low tide in July 2015, with median of 0.21 mg m−3 (Figure 8), with significant variation only according to tide, with higher concentrations in the low tide (P = 0.01) (Table 1).
Distribution of chlorophyll-a <20 µm, at the four fixed collection points, at low tide and high tide, with the median and interquartile range.

PERMANOVA
In relation to the group of hydrological variables with the three factors (tide, collection points and climatic period), there were significant variations only for tide and climatic period (P = 0.00 and P = 0.00, respectively).
Chlorophyll-a showed a significant interaction between climatic period and tide (P = 0.04). After the pairwise tests of the period × tide interaction, there was a significant seasonal difference for the dry season (P = 0.01) (Table 2).
PERMANOVA test of chlorophyll-a and hydrological variables in dry and rainy season in the low tidal and high tidal, with P-values of the treatment.

DISCUSSION
Rainfall was below the historical average during the entire study period due to the El Niño atmospheric-oceanic phenomenon characterized by abnormal warming of surface waters, with reduced rainfall and changes in wind patterns, which had as consequences climate changes at regional and global levels (Oliveira, Reference Oliveira2001).
Particularly, rainfall in the Suape estuarine-port complex was enough to cause variations in some environmental parameters analysed, as confirmed by PERMANOVA. In the rainy season, there was elevation in silicate and nitrate contents and reduction of temperature and water transparency.
In the port area of Santos-SP, Masuda et al. (Reference Masuda, Moser and Barrera-Alba2011) observed that higher rainfall caused lower depth of the euphotic zone and higher salinity variation and consequently higher haline stratification in the system. The increase in rainfall increased continental drainage and consequently the eutrophication degree in the system.
On the other hand, tide was also a determining factor in the alterations of some parameters, according to PERMANOVA, such as water transparency, dissolved oxygen and its saturation, salinity and chl-a fractions. This can be explained due to the fact that the region under study has a semidiurnal type tide, with amplitude of 3 m, becoming able to cause significant changes in the environment. In the ‘Golfão Maranhense’ region, Azevedo et al. (Reference Azevedo, Feitosa and Koening2008), observed that physical forces such as wind, tide and high turbidity were the main causes for reductions of the euphotic zone and consequently of phytoplankton biomass.
Water transparency varies according to rainfall and terrestrial drainage, and light may become a limiting factor for phytoplankton in the months of higher rainfall, effectively limiting phytoplankton biomass (Passavante & Koening, Reference Passavante and Koening1984; Sassi, Reference Sassi1991).
In Suape, transparency was within the expected standard for an estuarine area, with more transparent waters during the dry season in the high tide period. This water transparency pattern as a function of tide and seasonality is commonly reported for other Pernambuco estuaries such as the Ilhetas and Mamucaba Rivers (Losada et al., Reference Losada, Feitosa and Lins2003), Formoso estuary (Honorato da Silva et al., Reference Honorato da Silva, Passavante, Silva-Cunha, Nascimento Vieira, Grego and Muniz2004) and Ariquindá River (Grego et al., Reference Grego, Feitosa, Silva, Cunha and Nascimento-Filho2009). In relation to current data compared with those of CONDEPE (1983), it was verified that the euphotic zone practically did not change.
As for depth, the main feature of port areas is being deep due to the mooring of large boats, continuous traffic and dredging activities. Suape Port, being located by a river, needs to undergo periodical dredging activities, increasing the local depth, and therefore, point 4 has been highlighted among the others as the deepest, because it is close to the navigation channel of large boats.
Dredging can cause great alterations in the environment, as a consequence of the resuspension of sedimented material, a fact corroborated by Forte Neto et al. (Reference Forte Neto, Beretta, Ferreira, Souza and Mafalda2014), who evaluated the Aratu Port – Bahia and observed that there was a strong disturbance during the dredging stage, with a decrease in the density of fish eggs and larvae, increase in turbidity and in the density of the microphytoplankton and mesozooplankton, stimulated by the increase in the concentration of phosphorus and ammonia and that after dredging, the environment returned to its stable condition.
In the Ipojuca River estuary, Pernambuco, Koening et al. (Reference Koening, Eskinazi-Leça, Neumann-Leitão and Macêdo2002) observed that the phytoplankton community presented qualitative and quantitative changes after the development of Suape Port, with coastal marine species predominating due to the shallow depth and high hydrodynamism in the area and a decrease of 70% in cell density, contrary to what occurred prior to the construction of the port, when higher occurrence of planktonic marine species and higher number of cells per litre were detected.
In the inner portion of Suape Port, Bezerra Júnior et al. (Reference Bezerra Júnior, Diaz and Neumann-Leitão2011) found high concentrations of fish larvae; despite the port having a high impact on natural conditions, it is still an important nursery area for fish of ecological and economic and commercial interest (Scombridae, Engraulidae, Clupeidae and Bothidae).
For the present study in the Suape Bay, this type of disturbance by the dredging process was not seen, since parameters such as chl-a and dissolved inorganic nutrients did not show significant changes in their patterns. This can be explained by the fact that the environment is influenced by strong hydrodynamism and with the opening of the reefs, there was greater penetration of coastal waters, causing greater water renewal.
Regarding temperature variations, it was observed that they occurred according to patterns expected for the area, which although tropical (where the amplitude is relatively small), showed a significant difference between climatic periods (dry and rainy seasons). However, the effects of these thermal variations on the planktonic community are not obvious because the variation occurs gradually (Passavante & Feitosa, Reference Passavante, Feitosa, Eskinazi-Leça, Newmann-Leitão and Costa2004).
In the Todos os Santos Bay, Mafalda et al. (Reference Mafalda, Sousa and Silva2003) observed larger amplitude possibly due to the fact that the environment has a more limited circulation. Cordeiro et al. (Reference Cordeiro, Feitosa, Flores Montes and Honorato da Silva2014), in the Port of Recife, Santos et al. (Reference Santos, Medeiros, Muniz, Feitosa, Schwamborn and Macedo2008) in the waters of the Amazon River platform, Ferreira (Reference Ferreira2011) in the Aratú Port area and Bastos et al. (Reference Bastos, Feitosa, Koening, Machado and Muniz2011) in the estuary of the Ipojuca river – PE also observed seasonal differences.
In general, low temperatures are related to low salinities because in the rainy period, the flow of fresh water increases due to rain and cloud cover. In the dry season, the increase in temperature coincides with higher salinities, explained by the lower flow of fresh water from rain and rivers (Macêdo & Costa, Reference Macêdo and Costa1990).
In addition, salinity is an important parameter in the estuarine zone delimitation, influencing the distribution of organisms. In EPC, higher salinities with regimens ranging from polyhaline to euhaline were observed. It is noteworthy, however, that in data from CONDEPE (1983) previous to the anthropic action, the environment varied from limnetic to euhaline due to the discharges of the Ipojuca, Tatuoca and Massangana Rivers. Therefore, after the construction of the port, there was a radical change in the local dynamics, favouring a greater marine intrusion with consequences of increased salinity, dissolved oxygen concentration and reduction of dissolved inorganic nutrients, SPM and chl-a.
Salinity showed significant tidal variation, as observed in other areas of the coast of Pernambuco, in the Recife port basin (Borges et al., Reference Borges, Silva-Cunha, Santiago and Lima2012; Cordeiro et al., Reference Cordeiro, Feitosa, Flores Montes and Honorato da Silva2014) and in Porto de Galinhas (Machado et al., Reference Machado, Feitosa, Koening and Flores Montes2017). Taking into account the pattern of circulation of the estuary area of Bay of Suape, it was verified that the environment is homogeneous, with no thermohaline stratification, as reported in previous data from CONDEPE (1983).
The importance of determining dissolved oxygen is due to the fact that it is an essential gas for life and an indicator of environmental conditions. Its aquatic cycle is governed by several biotic and abiotic processes that produce or consume dissolved oxygen, such as respiration, photosynthesis, oxidation of organic matter and chemical compounds and cellular metabolic processes (Flores-Montes, Reference Flores-Montes1996; Gardner et al., Reference Gardner, Kjerve and Petrecca2006). In EPC, well oxygenated waters were found due to the great input of marine waters and low input of organic matter from river discharges. Prior to the construction of Suape Port, dissolved oxygen concentrations in the Suape Bay were similar to those found currently, except for the Ipojuca River, where concentrations below 2.0 ml l−1 were registered, being indicative of organic pollution.
Taking into account the classification of Macêdo & Costa (Reference Macêdo and Costa1978), the oxygen saturation rate ranged from saturated to supersaturated, being indicative of an environment free of excess organic matter, which is compatible with results observed in Maracajaú – Rio Grande do Norte by Feitosa & Bastos (Reference Feitosa and Bastos2007), in the São Francisco River, by Melo-Magalhães et al. (Reference Melo-Magalhães, Moura, Medeiros, Lima and Koening2011), in the Aratú Port area – Bahia, by Ferreira (Reference Ferreira2011) and Porto de Galinhas – Pernambuco by Machado et al. (Reference Machado, Feitosa, Koening and Flores Montes2017).
The amount of suspended particulate matter in the Suape Port area was lower than expected for an estuarine environment, possibly due to anthropogenic action, which provided less continental influence and greater marine influence. However, current SPM levels are higher than those observed by Jales et al. (Reference Jales, Feitosa, Koening, Bastos and Machado2012), in Serrambi – Pernambuco and Masuda et al. (Reference Masuda, Moser and Barrera-Alba2011), in Santos Port – São Paulo and compatible with those reported by Grego et al. (Reference Grego, Feitosa, Silva, Cunha and Nascimento-Filho2009), in the Ariquindá – Pernambuco estuary and Cordeiro et al. (Reference Cordeiro, Feitosa, Flores Montes and Honorato da Silva2014) in the Recife Port region.
Coastal waters tend to receive significant amounts of nutrients such as phosphate and nitrate due to the influence of adjacent continents, not presenting total nutrient depletion, even in the tropics (Lourenço & Marques, Reference Lourenço, Marques, Pereira and Soares-Gomes2009). According to Macêdo et al. (Reference Macêdo, Muniz, Flores Montes, Eskinazi-Leça, Neumann-Leitão and Costa2004), nutrients have high importance in the aquatic environment, because their concentrations, together with light, are the main limiting factors for phytoplankton production, thus affecting the entire trophic web.
In relation to the estuarine region of Suape Bay, nitrogenous nutrients were mostly found at low concentrations, such as nitrite, for example, indicating that there is no contamination by organic matter in the area. The nitrite levels were low, as observed in other environments with good environmental quality, such as Machado et al. (Reference Machado, Feitosa, Koening and Flores Montes2007) in Porto de Galinhas and Jales et al. (Reference Jales, Feitosa, Koening, Bastos and Machado2012) in Serrambi (0.12–5.23 and 0.00–0.13 µmol l−1, respectively). Nitrite is an intermediate and unstable nutrient from denitrification and nitrification reactions, and can be rapidly converted into nitrate, so in general, it is common that its concentrations in water are relatively lower than those of other forms of dissolved nitrogen (Noriega et al., Reference Noriega, Costa, Feitosa, Flores Montes, Grego, Soarea and Silva2005).
Nitrate, in turn, also presented low concentrations possibly because it is the nitrogen form most needed by the phytoplankton community after ammonia. Nitrate and ammonia presented seasonal variations, with relatively higher values in the rainy period for nitrate and in the dry season for ammonia. Bastos et al. (Reference Bastos, Feitosa, Koening, Machado and Muniz2011), in Maracaípe and Machado (Reference Machado2007) in Porto de Galinhas observed similar results (0.00–3.29 and 0.12–5.23 µmol l−1, respectively) different from those observed by Jales et al. (Reference Jales, Feitosa, Koening, Bastos and Machado2012) in Serrambi – PE (0.13–2.10 µmol l−1), where even lower values were found and by Koening et al. (Reference Koening, Eskinazi-Leça, Neumann-Leitão and Macêdo2002) in the Ipojuca River estuary – PE, (0.02–699.0 µmol l−1) with higher values.
In Suape Bay, Batista (Reference Batista2014) observed high concentrations of phosphate, and reported that this fact was associated with the remobilization of sedimented phosphorus to the water column through oxidation-reduction processes, microbial activity and the equilibrium potential of phosphorus concentrations (Reddy et al., Reference Reddy, Kadlec, Flaig and Gale1999; Zhou et al., Reference Zhou, Gibson and Foy2000; Foy et al., Reference Foy, Lennox and Gibson2003). However, as with nitrogenous nutrients, phosphate also showed low levels, with concentrations similar to those observed by Ferreira et al. (Reference Ferreira, Silva Cunha, Aquino, Borges, Feitosa, Eskinazi-Leça and Lima2015) in the reef zone of São José da Coroa Grande and by Azevedo et al. (Reference Azevedo, Feitosa and Koening2008) in Golfão Maranhense (0.04–0.27 and 0.13–0.58 µmol l−1, respectively).
Silicate was the most concentrated nutrient in the region inside Suape Port, probably explaining the predominance of the diatom phytoplankton group, the most representative community in coastal ecosystems, silicate being an essential element for its development (Grego et al., Reference Grego, Feitosa, Silva, Cunha and Nascimento-Filho2009; Borges, Reference Borges2011).
In addition, the Massangana River has suffered several anthropogenic impacts, such as landfills, constructions and deforestation along its banks, increasing the contribution of clayed sediments in the environment (which are sources of silicate), due to the leaching of soil by rainfall, and points 1 and 2 located near its mouth presented high concentrations. In addition, silicate showed seasonal variation, with higher levels in the rainy season, as expected for the area. Rosevel da Silva et al. (Reference Rosevel da Silva, Silva Cunha, Feitosa and Muniz2005), in the Tamandaré Bay – Pernambuco and Borges (Reference Borges2011), in the estuary of the Massangana River – Pernambuco, reported concentrations similar to those of the EPC area (3.72–53.03 and 2.19–65.80 µmol l−1, respectively). Grego et al. (Reference Grego, Feitosa, Silva, Cunha and Nascimento-Filho2009), in the estuary of the Arinquidá River – Pernambuco and Otsuka et al. (Reference Otsuka, Feitosa, Flores Montes and Silva2016), in the coastal region of Barra de Jangadas – Pernambuco observed higher values (6.05–106.02, and 3.10–221.12 µmol l−1, respectively).
Phytoplankton biomass in the ocean is a difficult factor to measure accurately. This is in part due to the discontinuous and relatively irregular distribution of phytoplankton populations in the environment. The most common method of measuring phytoplankton biomass is based on the measurement of a component common to all photosynthetic planktonic organisms, i.e. the chl-a content (Lourenço & Marques, Reference Lourenço, Marques, Pereira and Soares-Gomes2009). According to Vollenweider (Reference Vollenweider1974), it is the most indicated method because chl-a is the most abundant and important pigment of living matter.
Since all photosynthetic organisms have this pigment and use it to perform photosynthesis, the total chl-a of a given volume of seawater should provide a measure of all photosynthetic organisms present (Lourenço & Marques, Reference Lourenço, Marques, Pereira and Soares-Gomes2009).
Total chl-a presented slightly higher levels in the high tide, contrary to what is observed for most estuaries. Coincidentally, there was also an increase in nitrite and nitrate contents. The environment showed low chl-a concentrations, different from what was expected and compatible with those obtained by Borges (Reference Borges2011) in the estuary of the Massangana River at the most downstream point and by Batista (Reference Batista2014) in Suape Bay (0.54–6.46 and 0.00–4.0 mg m−3, respectively). Possibly, the anthropogenic actions affecting the estuary dynamics also caused this type of pattern, and the plume of the Ipojuca River is even able to influence Suape Bay during the period of tide flood. Another possibility is the presence of large boats, which may be contributing with releases of organic matter.
In other port areas of the Brazilian coast, the amount of phytoplankton biomass varied, such as those reported by Paiva et al. (Reference Paiva, Eskinazi-Leça, Passavante, Silva-Cunha and Melo2006) in the Guajará Bay – Pará, from 1.49–23.33 mg m−3; Masuda et al. (Reference Masuda, Moser and Barrera-Alba2011) in Santos – São Paulo, concentrations from 0.9–11.6 mg m−3, and Cordeiro et al. (Reference Cordeiro, Feitosa, Flores Montes and Honorato da Silva2014) in the Recife Port, from 0.24–19.29 mg m−3.
Along the coastline of Pernambuco, a number of authors have observed low chl-a levels in areas considered not impacted, such as Tamandaré Bay (Silva, Reference Silva2016), Porto de Galinhas (Machado et al., Reference Machado, Feitosa, Koening and Flores Montes2017), São José da Coroa Grande (Ferreira et al., Reference Ferreira, Silva Cunha, Aquino, Borges, Feitosa, Eskinazi-Leça and Lima2015) and Serrambi (Jales et al., Reference Jales, Feitosa, Koening, Bastos and Machado2012), presenting values lower than 9 mg m−3. In contrast, there are also other highly eutrophic environments, such as the Pina Basin (Santos et al., Reference Santos, Bezerra Júnior, Costa and Feitosa2009) with contents up to 211.15 mg m−3, Barra das Jangadas (Otsuka et al., Reference Otsuka, Feitosa, Flores Montes and Silva2016; Branco et al., Reference Branco and Feitosa2002) with 34.71 and 49.84 mg m−3 respectively, and Candeias beach (Santos et al., Reference Santos, Passavante and Barros2007) with 158.99 mg.m−3.
Taking into account the classification for the coastal zone of Vollenweider & Kerekes (Reference Vollenweider and Kerekes1982), the Suape estuarine complex ranged from oligotrophic to mesotrophic, with a strong tendency to oligotrophy.
The phytoplankton community is composed of organisms of different sizes. According to Takahashi & Biefang (Reference Takahashi and Biefang1983), the size distribution of the phytoplankton community may play a major role in the dynamics of the food web, in the biological structure and ecological efficiency.
A higher contribution of fraction <20 µm, corresponding to pico- and nanophytoplankton, will be due to a low concentration of nutrients in aquatic environments, considering that larger phytoplankton species in these environments are in disadvantageous conditions (Tada et al., Reference Tada, Sakai, Nakano, Takemura and Monyani2003; Jales et al., Reference Jales, Feitosa, Koening, Bastos and Machado2012).
This limits the development of the largest fraction, which has a surface × volume ratio smaller than the <20 µm phytoplankton. However, Charpy & Blanchot (Reference Charpy and Blanchot1999) suggest that biotic factors may also affect the structure of the phytoplankton community, such as herbivory. In addition, Tada et al. (Reference Tada, Sakai, Nakano, Takemura and Monyani2003) reported that the domain of this fraction may also be associated with environmental factors, with high temperatures in the water column becoming a limiting factor for the phytoplankton cell growth of the largest fraction in relation to the smallest one.
In Suape Port, the fraction <20 µm predominated with an average of 60.75% in the environment, becoming the main contributor. This fraction had higher concentrations at low tide, during the dry season, and these factors were considered determinants, as confirmed by PERMANOVA. According to Moran et al. (Reference Moran, Lopez-Urrutia, Calvo-Díaz and Li2010), this fraction may become more significant for the environment with increasing temperature in the two regions of the Atlantic. Similar situations have also been observed in some coastal regions of the world, such as by Costa (Reference Costa2007), in Todos os Santos Bay, by Tada et al. (Reference Tada, Sakai, Nakano, Takemura and Monyani2003) in Sesoko Island in Okinawa – JP and by Charpy & Blanchot (Reference Charpy and Blanchot1999) in Fiji.
Along the coastline of Pernambuco, other authors have observed low chl-a levels, such as Silva (Reference Silva2016) in Tamandaré Bay, Ferreira et al. (Reference Ferreira, Silva Cunha, Aquino, Borges, Feitosa, Eskinazi-Leça and Lima2015) in São José da Coroa Grande, and Jales et al. (Reference Jales, Feitosa, Koening, Bastos and Machado2012) in Serrambi (0.14–2.25, 0.00–5.70 and 0.35–3.35 mg m−3, respectively).
In view of the above, it could be concluded that rainfall and tide were the physical forces that most affected the environmental variables. The environment presented a circulation pattern of the homogeneous type, with strong marine intrusion.
The low levels of nutrients and chl-a were indicative of an environment free of eutrophication processes, with nitrogen being the limiting biomass element.
Anthropogenic changes in the environment have led to greater marine interference and consequently to a reduction in the productive capacity of the system.
ACKNOWLEDGEMENTS
The authors would like to thank LABFITO – UFPE, LOQUIM – UFPE and LOFEC – UFPE, for analysis and availability of data.
FINANCIAL SUPPORT
This research is part of a larger project titled ‘Studies on the Dissolved Inorganic Carbon Cycle in Northeastern and Northern Coastal Areas of Brazil and its Relation to Marine Acidification Processes (DICAM)’ with financial assistance from the Coordination for the Improvement of Higher Education Personnel (CAPES).