
1. Introduction
Natural convection in liquid during solidification can considerably affect the composition and temperature distribution, which in turn alters the growth of the solid phase in the mushy zone. The buoyant forces arising due to the rejection of less dense residual liquid in the mushy zone (e.g. the bottom cooling of the hyper-eutectic water-salt systems) resist the retarding viscous forces (Beckermann, Gu & Boettinger Reference Beckermann, Gu and Boettinger2000; Shevchenko et al. Reference Shevchenko, Boden, Gerbeth and Eckert2013). The formation of plumes, which are often termed as solute channels or chimneys (Copley et al. Reference Copley, Giamei, Johnson and Hornbecker1970; Yuan & Lee Reference Yuan and Lee2012; Karagadde et al. Reference Karagadde, Yuan, Shevchenko, Eckert and Lee2014), is known to occur when the strength of the buoyant force exceeds a minimum threshold (Shevchenko et al. Reference Shevchenko, Boden, Gerbeth and Eckert2013; Karagadde et al. Reference Karagadde, Yuan, Shevchenko, Eckert and Lee2014). Likewise, the stabilization of convection in the form of plumes is typically characterized by a critical Rayleigh number in the permeable/mushy zone. Poirier (Reference Poirier1987) reported the empirical relations of permeability based on the flow directions with respect to the orientation of the growing solid. Some popular empirical relations are multilinear regression, the Hagen–Poiseuille model, the Blake–Kozeny model, the slit model and the cross-flow model. These empirical relations were based on solidification of Pb-Sn, borneol-paraffin systems. Schneider et al. (Reference Schneider, Gu, Beckermann, Boettinger and Kattner1997) reported the coefficient of the Blake–Kozeny equation, where permeability was assumed as isotropic for columnar growth. Felicelli, Poirier & Heinrich (Reference Felicelli, Poirier and Heinrich1998) reported the modelling studies for plume formation and a number of empirical relations were introduced for the permeability measurements in the mushy zone with their coefficient. In their work, the permeability relations were categorized on the basis of solid fraction. Worster (Reference Worster1991, Reference Worster1997) formulated a permeability-based Rayleigh number in the mushy zone using two different types of length scales, i.e. (a) the height of the mushy zone and (b) the ratio of thermal diffusivity to the growth rate. Ramirez & Beckermann (Reference Ramirez and Beckermann2003) reported a combined study for the formation of plumes in Pb-Sn and Ni-base superalloys, with the average permeability estimated using both the Blake–Kozeny and Poirier's relations and the two prior mentioned length scales. For the Pb-Sn based alloys, the critical permeability-based Rayleigh number for plume formation was 38–46, whereas it was 30–33 for Ni-based superalloys. Yuan & Lee (Reference Yuan and Lee2012) stated that the competition between upward solute transport and dendritic growth determined the survival of the plumes.
The solidifying interface can be classified as either diffuse or faceted, where the formation of the latter is primarily attributed to a higher entropy of phase change at the melting temperature (Porter & Easterling Reference Porter and Easterling1992). Dendritic morphology is a diffuse interface which is mostly found in metallic systems and a few transparent materials, such as succinonitrile, camphor, NH4Cl and Na2ClO3. (Copley et al. Reference Copley, Giamei, Johnson and Hornbecker1970; Huppert Reference Huppert1990; Kerr et al. Reference Kerr, Woods, Worster and Huppert1990a; Karaca et al. Reference Karaca, Çadirli, Kaya and Maraşli2001). The faceted growth is generally observed in semiconductors, oxides, carbides and complex non-metallic compounds, such as KNO3, CuSO4 and Na2SO4 (Chen & Turner Reference Chen and Turner1980; Kerr et al. Reference Kerr, Woods, Worster and Huppert1990a,Reference Kerr, Woods, Worster and Huppertb,Reference Kerr, Woods, Worster and Huppertc; Porter & Easterling Reference Porter and Easterling1992; Dantzig & Rappaz Reference Dantzig and Rappaz1994; Bloomfield & Huppert Reference Bloomfield and Huppert2003). The microstructural morphology together with the solid fraction (equivalent to a packing fraction in a porous medium) considerably affects the transport of rejected components, particularly when it is lighter compared to the bulk-fluid density. A number of studies have reported convection and temperature measurements in the liquid during bottom-cooled solidification of hyper-eutectic water-NH4Cl systems (Chen Reference Chen1997; Kumar, Srivastava & Karagadde Reference Kumar, Srivastava and Karagadde2018a), in which the primary convection is compositionally driven in the presence of a positive thermal gradient in the vertical direction. However, contrasting flow and thermal behaviours have been reported when the primary solid is in the faceted form. Vigorous convective flow was observed during the solidification of water-Na2SO4, and water-CuSO4 (Chen & Turner Reference Chen and Turner1980; Huppert Reference Huppert1990; Bloomfield & Huppert Reference Bloomfield and Huppert2003) under side and top cooled conditions. Thompson et al. (Reference Thompson, Huppert, Worster and Aitta2003) performed bottom-cooled experiments involving KNO3 as one of the constituents and reported vigorous and random convection for a certain duration where KNO3 was the primary solidifying component. Further, a gain in the bulk-fluid temperature was also observed at the end of convection in (Thompson et al. Reference Thompson, Huppert, Worster and Aitta2003), which was attributed to the heat gained from the surroundings. This may not be necessarily true, as the distinguishing flow patterns with dendritic and faceted morphologies control the heat and mass transfer within the liquid.
In order to understand the mechanisms of flow under the said two morphological conditions, and to assess the plausible physical reasons that may explain the uncharacteristic temperature rise, we performed real-time observations of bottom-cooled solidification of water-NH4Cl and water-KNO3 mixtures, with measurement of temperature from several locations along the height of the solidification cell. The density-based shadowgraph technique and particle image velocimetry (PIV) were employed for performing the qualitative and quantitative flow characterization, respectively. Two different Rayleigh numbers, one defined in the bulk fluid and the other in mushy zone volume, were evaluated to measure the convective strength in the respective zones. The temperature rise during the faceted growth has been quantified, and a plausible hypothesis for the anomalous temperature behaviour is proposed.
2. Experimental set-up and procedure
2.1. Materials
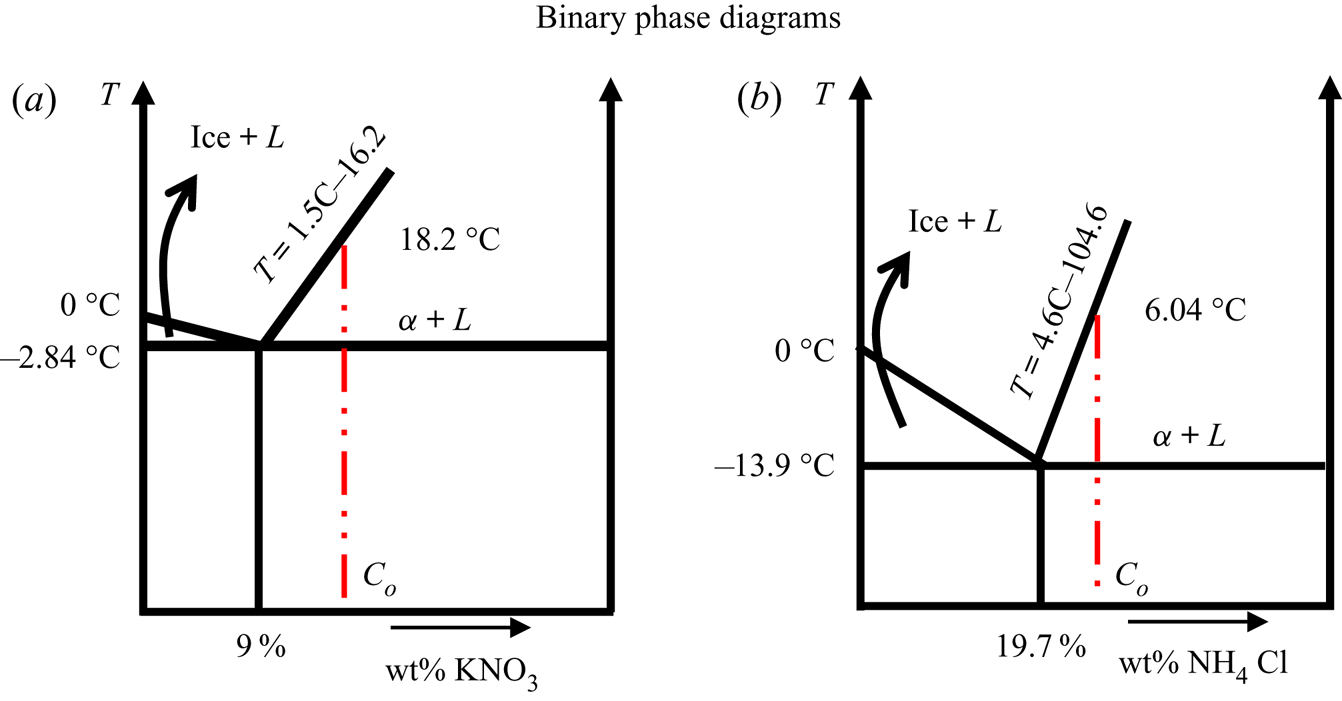
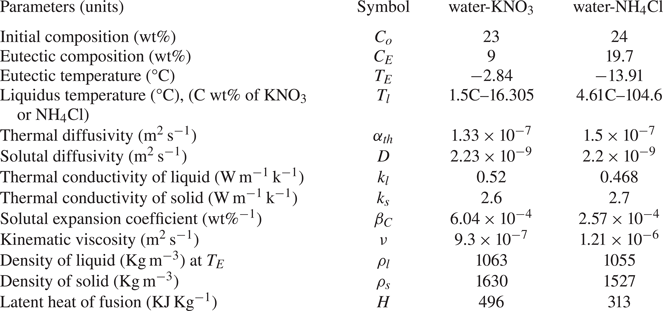
Water-KNO3 and water-NH4Cl aqueous binary solutions were used to obtain faceted and dendritic morphology of the primary α-solid, respectively. Eutectic temperatures of binary eutectic systems water-9 wt% KNO3 and water-19.7 wt% NH4Cl are −2.84 °C and −13.9 °C, respectively (Beckermann & Wang Reference Beckermann and Wang1996; Aitta, Huppert & Worster Reference Aitta, Huppert and Worster2000) (representative phase diagrams are shown in figure 1). At these compositions, the expected solid fraction values at the eutectic temperature are 0.17 and 0.07 (the solid fraction was calculated from the equilibrium phase diagram using the equilibrium lever rule as a reasonable approximation). In the present study, the hyper-eutectic regime was chosen to perform experiments where a low-density mixture was rejected at the solidifying interface. Water-23 wt% KNO3 and water-24 wt% NH4Cl were the initial compositions, and their corresponding liquidus temperatures were 18.2 °C, and 6.04 °C, respectively (Beckermann & Wang Reference Beckermann and Wang1996; Cherkasov, Smotrov & Il'in Reference Cherkasov, Smotrov and Il'in2010). The details of thermo-physical properties are listed in table 1. For the verification of flow phenomena in faceted cases, different initial compositions, which are near the eutectic composition, such as water-(15 and 20) wt% KNO3 systems (appendix A.1., figures 16 and 17) and different bottom temperature (−11 °C) for water-23 wt% KNO3 (figures 18–20), are discussed in the appendix (A.1. and A.2.). Additionally, another faceted-forming system (water-18 wt% Na2SO4) is discussed in appendix B.
Schematic of the phase diagrams of (a) water-KNO3 and (b) water-NH4Cl. The dashed line marks a typical initial composition Co for the experiments.

Thermo-physical properties of water-KNO3 and water-NH4Cl systems (Tanaka Reference Tanaka1975; Beckermann & Wang Reference Beckermann and Wang1996; Thompson et al. Reference Thompson, Huppert, Worster and Aitta2003; Cherkasov, Smotrov & Il'in Reference Cherkasov, Smotrov and Il'in2010; Chakraborty & Dutta Reference Chakraborty and Dutta2013; Guba & Anderson Reference Guba and Anderson2017).

2.2. Experimental set-up, instrumentation and measurements
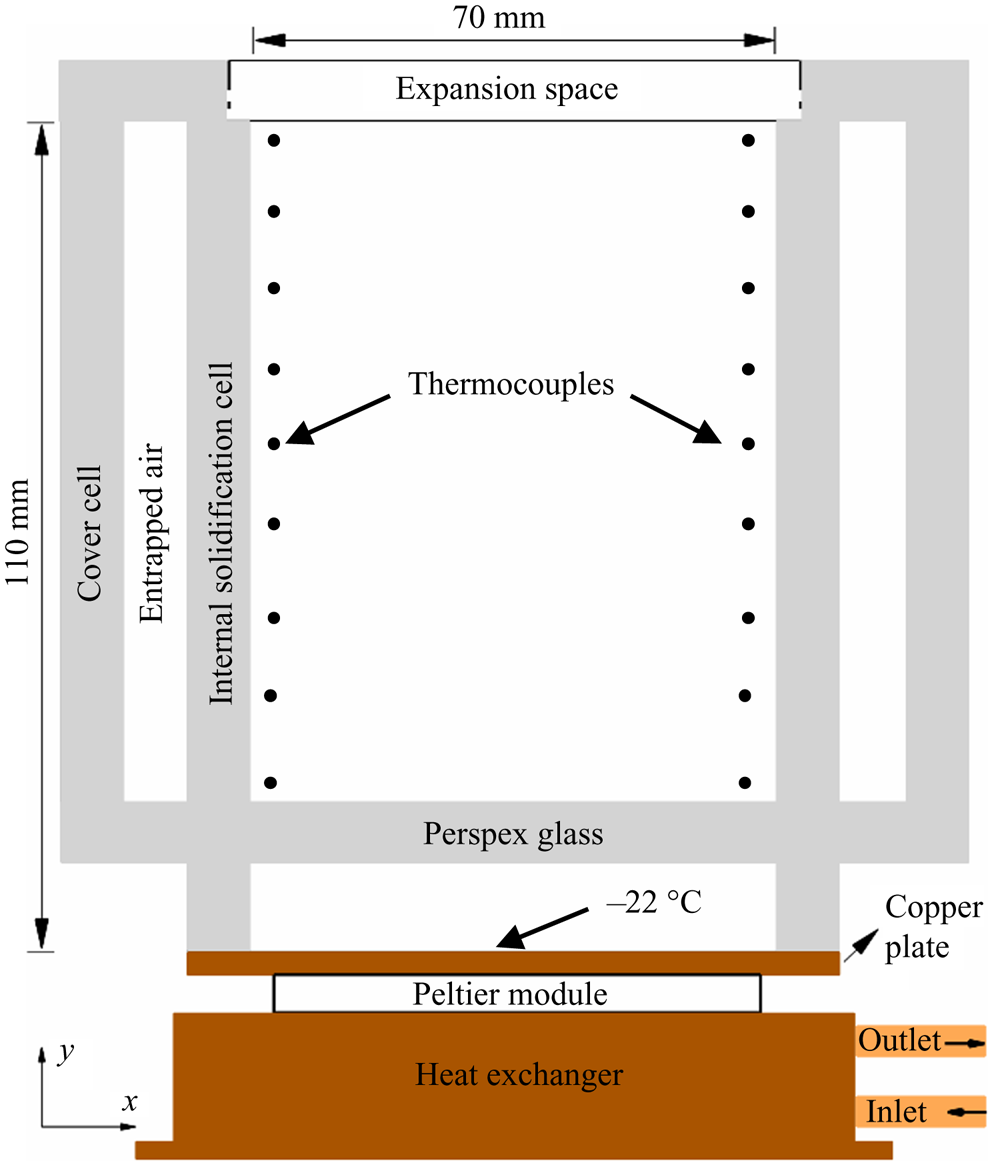
The bottom-cooled solidification cell was made of 8 mm thick perspex glass, as shown in figure 2. The inner volumetric dimension of the cell was 110 × 70 × 50 mm3. To prevent the condensation problem during in situ experiments, a cover cell was placed on the solidification cell. The bottom copper plate of the cell was maintained at −22 °C using an assembly of peltier, thermoelectric cooler (TEC) controller, DC power supply, heat exchanger and a julabo circulating bath (Kumar et al. Reference Kumar, Srivastava and Karagadde2018a; Kumar, Srivastava & Karagadde Reference Kumar, Srivastava and Karagadde2018c). Nine K-type thermocouples (accuracy of ±0.15 °C) were attached to each of the vertical sidewalls to measure the temperature. The temperature data was acquired through data loggers (PICO ® TC-08).
Schematic of the solidification cell.

The density is known to be a function of temperature and composition. For observing the buoyant convection patterns during the experiments, the density-gradient-based shadowgraph technique was employed. In the shadowgraph, a white light source (250 W) was collimated using a plano-convex lens. The collimated beam was passed through the solidification cell, and density changes in the cell were captured by a CCD camera (Imperx CLB-B2520M). For the velocity measurements of the liquid, particle image velocimetry (MicroVec PIV ®) was employed. The PIV system consists of a DPSS (diode pumped solid state) laser (532 nm), synchronizer and a CCD camera (Imperx CLB-B2520M, resolution 2456 × 2048). Neutrally buoyant hollow glass particles (average diameter 10 μm) were used as seeding particles. The details of the employed PIV set-up can be found in the references (Kumar et al. Reference Kumar, Kumawat, Srivastava and Karagadde2017; Kumar, Srivastava & Karagadde Reference Kumar, Srivastava and Karagadde2018b).
The calibration curve of the refractive index with known composition was established using a refractometer (Anton Paar ®). Samples (approximately 0.5 ml) were extracted using a thin needle-syringe from the cell during the experiment, and the refractive index was measured. Using the calibration curve and measured refractive index of the samples, the composition of KNO3 and NH4Cl was evaluated. Since the extraction of samples disturbs the flow slightly, several repititions (~10) were performed to obtain the compositional difference needed for evaluating the Rayleigh number. The error bars of the Rayleigh numbers were based on these repititions.
3. Observations
3.1. Convective flows in faceted and dendritic growth cases
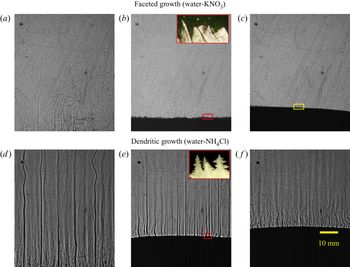
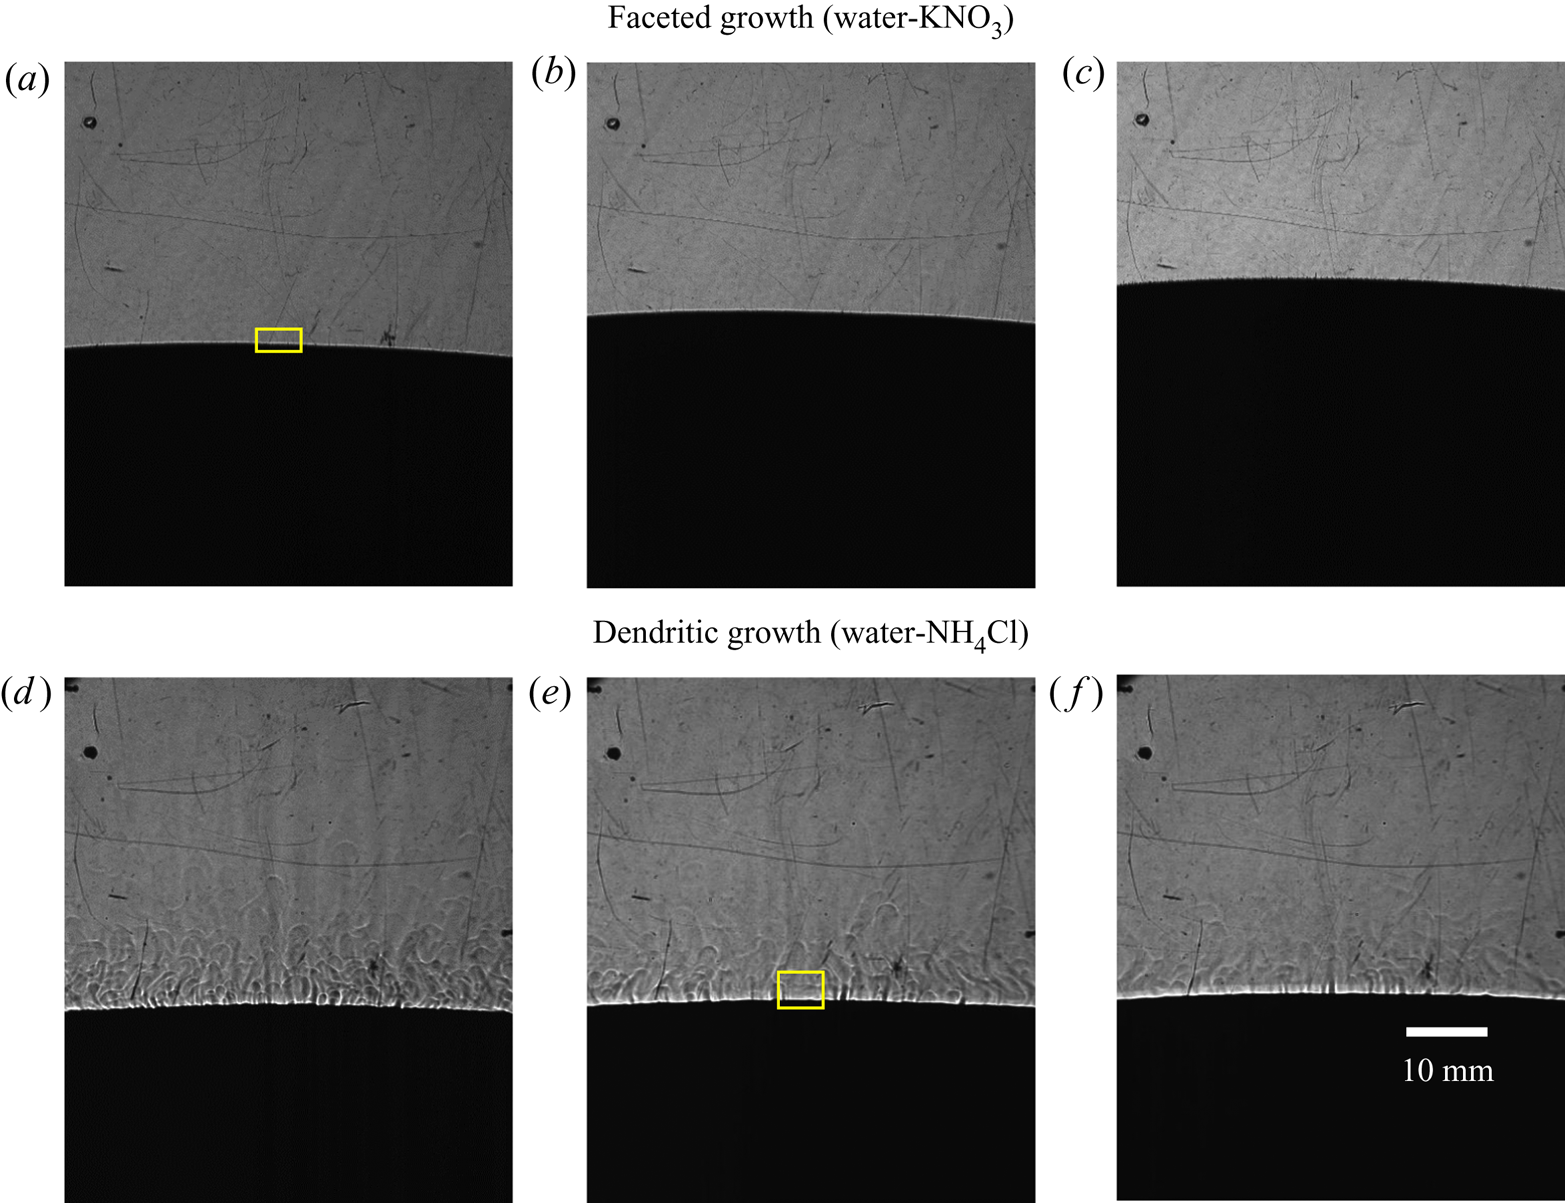
Figure 3 shows the spatio-temporal evolution of the flow field obtained from the shadowgraphs during bottom-cooled solidification of water-23 wt% KNO3 (a–c) and water-24 wt% NH4Cl (d–f). In water-23 wt% KNO3, the flow of rejected (low density) mixture was random (figure 3a), not in specific patterns, such as a plume, whereas in water-24 wt% NH4Cl, the plume formation and localized solutal convection (near the bottom section) were observed (figure 3d). Evolving microstructures were captured using a portable microscope (Dinolite ®, Model AM7515MZT). The faceted and dendritic solids were observed in water-23 wt% KNO3 (inset of figure 3b) and water-24 wt% NH4Cl (inset of figure 3e), respectively.
Observation of solutal buoyancy-induced convective flow using shadowgraph for (a–c) water-23 wt% KNO3 and for (d–f) water-24 wt% NH4Cl: (a) random solutal convection at 60 min and (b) at 260 min (faceted microstructure is shown in the inset of figure), (c) absence of convection at 355 min after liquid becomes nearly homogenous (at eutectic composition), (d) plume formation at 60 min and (e) at 600 min (dendritic morphology captured at solid–liquid interface presented in the inset of figure), (f) localized solutal convection at 970 min. (Note: The region marked by a rectangular box (yellow) on the interface in (c), is used for intensity measurements to be reported later).

The random convective flow essentially homogenized the composition and temperature of the liquid in the cell (particularly ahead of the mushy zone) and reduced the bulk composition to near-eutectic composition within 300 min. Note that in figure 3(c), the macroscopic freezing interface is slightly inclined, which could be attributed to slight variations in the compositional distribution induced by the random convective flow patterns. The composition of the bulk fluid and the strength of convection were found to further reduce with time, and was measured to be water-11.8 wt % KNO3 at 350 min. At 600 min, the composition reached the uniform eutectic composition water-9.9 ± .3 wt% KNO3, and the interface became flat (figure 4a–c) compared to previous time instants (figure 3c).
Observations of the reducing convective flow behaviour are shown here using shadowgraphs. Panels (a–c) show absence of convection in the liquid after the liquid reaches eutectic composition in water-23wt% KNO3, at (a) 740 min (b) 900 min and (c) 1280 min. However, in the water-24wt% NH4Cl case (d–f), presence of weak, localized solutal convection with composition reaching the eutectic was observed at (d) 1410 min, further experiencing eutectic growth at (e) 1515 min and at (f) 1760 min. (Note: The region marked by a rectangular (yellow) box, on the interface in (a and e), is used for intensity measurements).

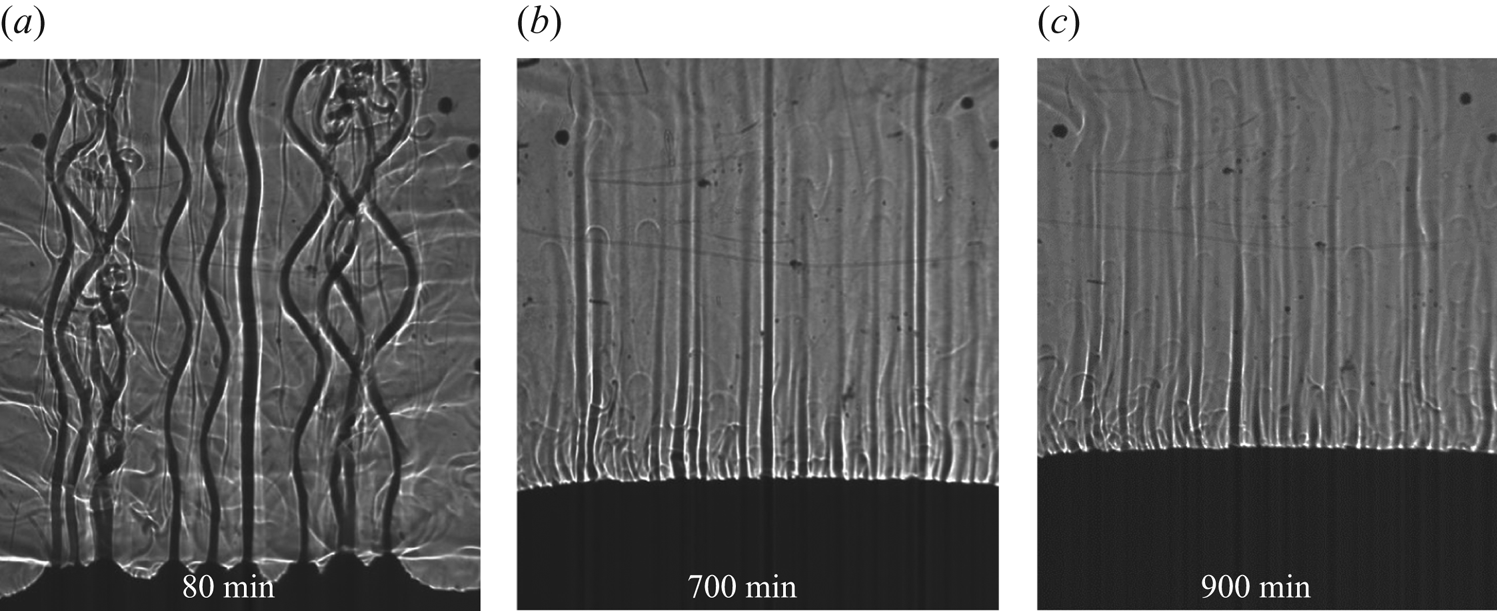
In the case of dendritic growth, the solutal convection dominated in the form of plumes. Plumes transport the composition to the top of the cell, while simultaneously exchanging heat with the warmer bulk liquid. At the top, plumes mix with the bulk, which then gradually moves downward (bulk velocity scale is 10−5–10−6 m s−1). As a result, a solutal gradient is set up in the direction of gravity, which delays the creation of the eutectic composition ahead of the mushy region.
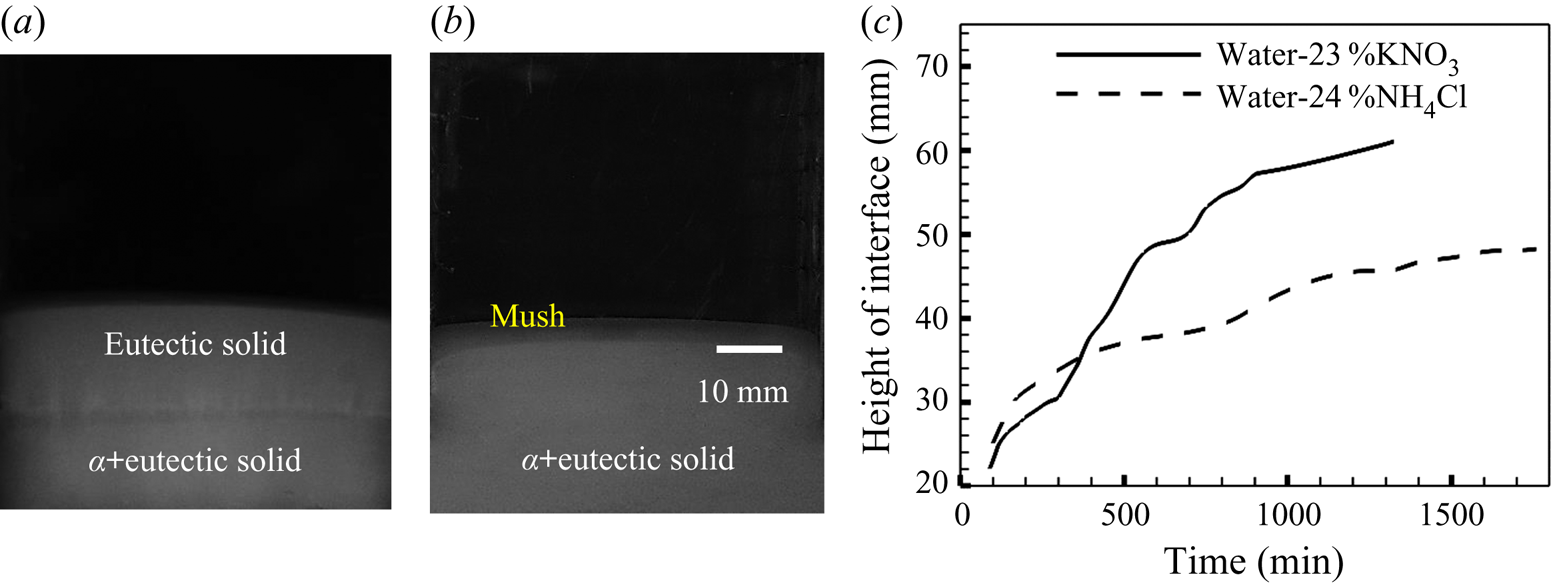
At 600 min, the compositions at the top of the cell and near the solidifying interface were water-21.3 wt% NH4Cl and water-22.47 wt% NH4Cl, respectively. The growth was comparatively slower, between 970 min (figure 3f) and 1410 min (figure 4d), due to continuous change in composition and the liquidus temperature. Composition reached closer to the eutectic composition (water-20.05 wt% NH4Cl) at 1410 min. Furthermore, eutectic solid was observed much later, at 1410 min (figure 4e,f), compared to 600 min in the faceted case.
3.2. Evolution of the solid
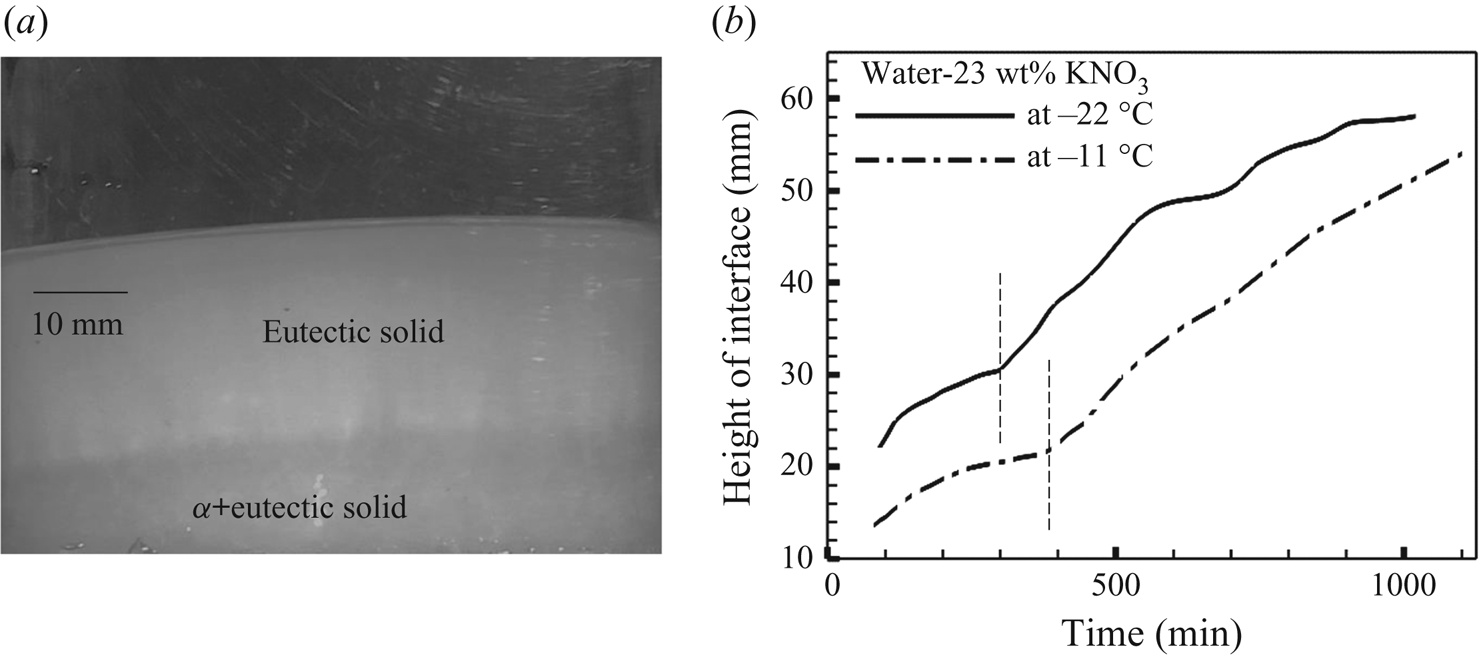
In the two hyper-eutectic binary mixtures (water-23 wt% KNO3 and water- 24 wt% NH4Cl), the primary solid (α) phase is primarily the salt system. At temperatures below the eutectic line, the solid exists as a mixture of α-solid and the eutectic (existing in the inter-granular regions). In the present experiments, such a solid phase was observed at the bottom of the cell and is termed as α+eutectic solid (figure 5a,b). On comparing the solidifying structures of the two binary mixtures, the formation of a larger amount of eutectic solid in the faceted case was observed, as the liquid ahead of the freezing mixture was able to reach near-eutectic composition uniformly due to stronger convective mixing (figure 5c). Similar solid evolution was also observed for a lower bottom-cooled condition (−11 °C) of water-23 wt% KNO3 (figure 19a). In water-24 wt% NH4Cl, the liquid composition was much slower in reaching near-eutectic composition, and, therefore, the amount of pure eutectic solid was considerably less. Moreover, the rate of growth of the uppermost location of the freezing interface was found to be considerably larger in the eutectic growth for the faceted case.
Evolution of the solid during solidification of (a) water-23 wt% KNO3 at 660 min (b) water-24 wt% NH4Cl at 1200 min. (c) Comparison of the progress of the height of the interface between water-23 wt% KNO3 and water-24 wt% NH4Cl.

The existence of a fully eutectic phase and the mixture of primary and eutectic phases were ascertained by measuring the composition of the solid at the end of the experiments. The change in the mass of the solid sample was evaluated by evaporating the water from the solid mixture. In the faceted case, the average composition of α+eutectic and the eutectic was 55 ± 3 wt% and 14 ± 1 wt% KNO3, respectively, whereas in the dendritic case, the average composition of the α+eutectic solid was 32 ± 2 wt% NH4Cl.
3.3. Velocity field in bulk fluid
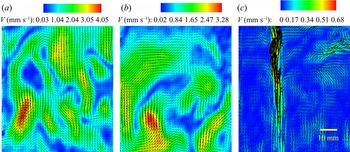
In the faceted growth, the maximum velocity magnitude was 4.1 mm s−1 at 100 min (figure 6a), and it reduced with time to 3.3 mm s−1 (at 120 min) (figure 6b). As the solidification progressed, the convection strength decreased due to the shifting of composition towards the eutectic composition, which led to a decrease in velocity magnitude with time (figure 6a,b).
Velocity field shown as vectors superimposed on the contours representing the magnitude of the velocity. Panels (a,b) show those for faceted growth (water-23wt% KNO3) at (a) 100 min and (b) 120 min, where random but higher magnitude flow field was observed, compared to those of dendritic growth (water-23wt% NH4Cl) showing stabilized plumes at 100 min (c).

After the initial solutal convection during dendritic growth, stabilized plumes were observed in the cell (figure 6c). The approximate average velocity of the plumes was 0.6 mm s−1 and that of the bulk fluid was much lower (~10−2 mm s−1). However, in the faceted case, the velocity field in the bulk fluid was uniform but larger in magnitude (2–4 mm s−1).
3.4. Uncharacteristic temperature rise in the faceted case
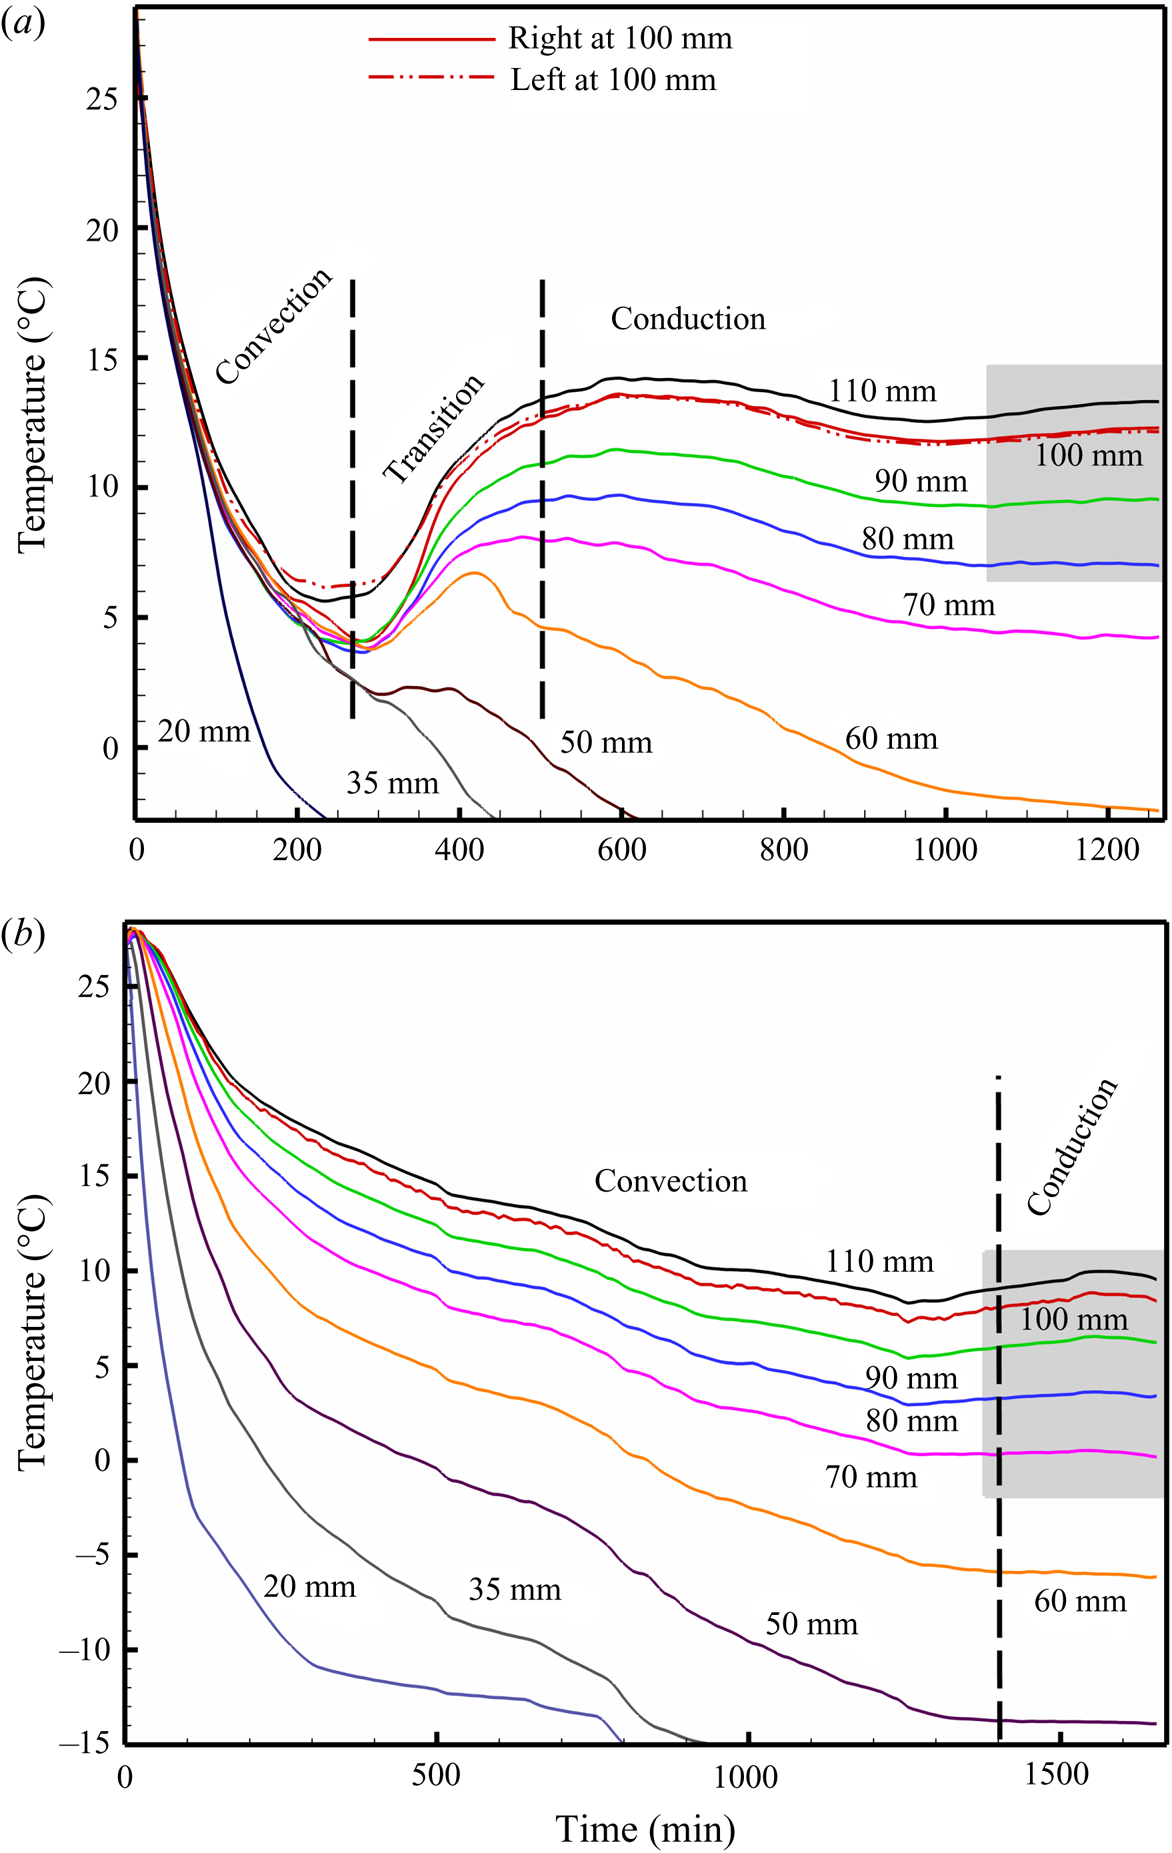
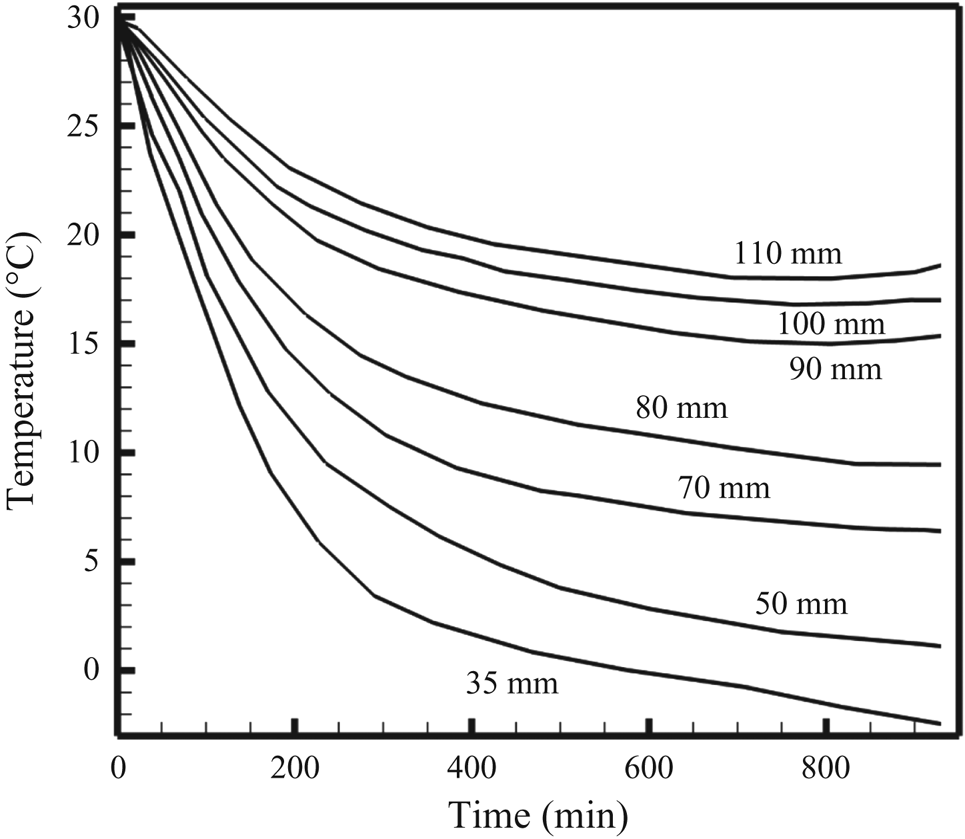
Figure 7 shows the temperature measurements at different locations along with the height of the cell for the faceted (water-23 wt% KNO3, figure 7a) and dendritic (water-24 wt% NH4Cl, figure 7b) growth cases. Significantly dissimilar temperature profiles were observed for the two cases, with the faceted solidification showing drastic initial cooling, followed by an unusual temperature rise. However, the temperature profiles of the dendritic case showed slow but gradual temperature decrease, on par with the nominal cooling rate. Moreover, both cases demonstrated a slight temperature rise towards the end of the experiment (marked by the grey box in figure 7a,b), which is very likely to have been associated with the heat gained from the surroundings. Based on the changes in the slope of temperature versus time measurements of the faceted case, the following three modes of heat transfer in the liquid have been identified: (a) convection-dominated regime, (b) transition regime and (c) conduction-dominated regime. Note that similar regimes were identified in the dendritic case as well, but the changes in the slopes were relatively less severe.
Temperature measurement at the different heights within the cell showing (a) higher cooling rate, unconventional gain in temperature and conduction-dominated cooling in the liquid during solidification of water-23 wt% KNO3 and (b) slow cooling in liquid for water-24 wt% NH4Cl.

3.4.1. Convection-dominated regime
In the faceted case, vigorous and random convective flow decreased the temperature very rapidly and considerably weak vertical thermal gradients were noticed at all the measurement locations (figure 7a). This phase is termed the convection-dominated regime. For the dendritic case, the temperature of the fluid decreased with the nominal cooling rate (much lower than the water-KNO3 case) due to the presence of well-defined convective patterns (plumes), as shown in figure 7(b).
3.4.2. Transition regime
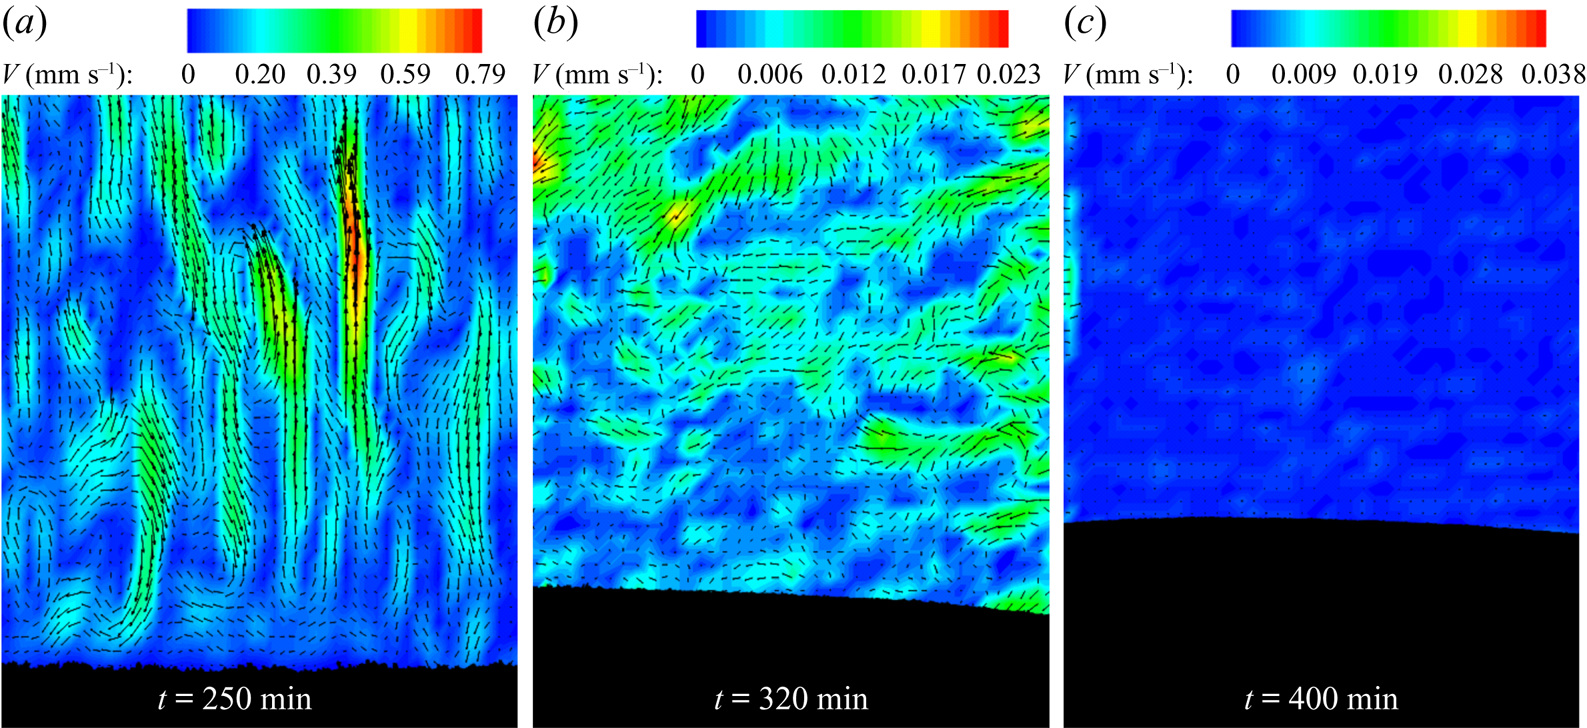
At the end of the convection-dominated regime (the magnitude of convective velocity can be seen from figure 8(a), where the velocity is very low compared to figure 6a,b), low thermal gradients were observed in the bulk fluid. The bulk-fluid composition approached the eutectic composition, where localized solutal convection (the local convective flow was in the order of 0.01 mm s−1, as shown in figure 8b), eutectic growth and a gain in the temperature were observed. Weaker and localized compositional convection maintains the low thermal gradient near the interface. This region was termed the transition regime (300–500 min) (figure 7a). In this regime, a sudden increase in growth rate was observed at the eutectic interface (due to conduction-dominated solid growth) (as shown in figure 5c). Similar gain in the bulk-liquid temperature was observed by Thompson et al. (Reference Thompson, Huppert, Worster and Aitta2003) during bottom-cooled solidification of water-KNO3-NaNO3 where KNO3 was the primary solidifying component. However, the increase was attributed to the heat gain from the surrounding environment.
Velocity vectors and contours for the faceted case, (a) at the end of the convection-dominated regime, (b) at the start of the transition regime, (c) at the end of the transition regime.

In the present work, we further observed gain in the temperature with different initial compositions of water-KNO3 systems (experimental details of water-(15 and 20) wt% KNO3 is presented in appendix A.1 (figures 16 and 17)). Similar gain was also observed with a higher bottom-cooled condition (bottom was maintained at −11 °C) solidification of water-23 wt% KNO3 (appendix A.2, figures 18–20). In order to verify the rise in temperature in different faceted-forming mixtures, experiments with the hyper-eutectic mixtures of water-Na2SO4 were performed, where similar random convection patterns and gain in temperatures were observed during bottom-cooled solidification (data in appendix A.2, figures 21 and 22).
In the water-NH4Cl (dendritic growth) case, a positive thermal gradient in the liquid existed throughout the experiment (figure 7b). The gain in temperature, and hence the transition regime, did not exist, unlike the cases of water-KNO3 and water-Na2SO4 (faceted-growth) systems.
3.4.3. Conduction-dominated regime
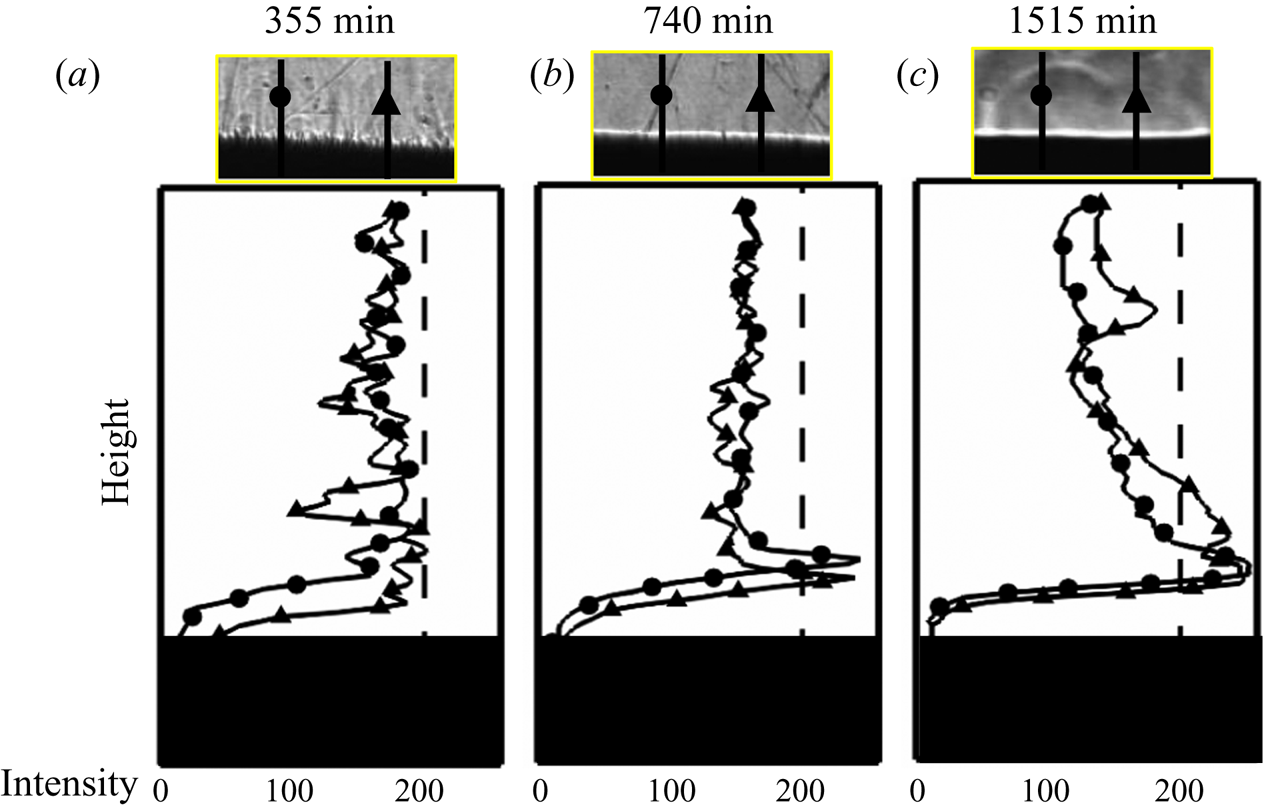
In the conduction-dominated regime, the temperature decreased gradually, with continuous growth of the eutectic solid (no convective flow was observed, as shown in figure 8c). As a result, a larger thermal gradient in the liquid was set up at the interface, which appeared to deflect the collimated light in the shadowgraphs by showing a high greyscale intensity. The intensity measurements at different locations near the solid–liquid interface (marked as rectangular boxes in figures 3 and 4) are shown in figure 9. For the faceted case, a high-intensity (greyscale intensity magnitude ~255) uniform band was observed in figure 9(b) at the interface (740 min), unlike figure 9(a), when the localized convection was present at 355 min. Similarly, in the water-NH4Cl (figure 4d–f) case, the eutectic growth led to a high-gradient region at the interface after 1410 min. From the temperature and the intensity measurements, the gradient near the interface was observed to be higher in water-NH4Cl (figures 7b and 9c) than the water-KNO3 (figures 7a and 9b) system.
Figure shows the shadograph images and the corresponding grey-scale intensity variation in the liquid ahead of the mushy zone. The whitish grey region (high intensity) corresponds to the water-rich liquid. These variations demonstrate the trends of compositional distribution during random convection and conduction-dominated regimes. (a) convection-dominated regime in water-23 wt% KNO3, where random mixing homogenizes the concentration field, and (b) conduction-dominated regime in water-23 wt% KNO3, where a peak concentration ahead of the interface is seen. (c) conduction-dominated regime in water-24 wt% NH4Cl, which shows a typical diffusion profile.

4. Discussion
4.1. Analysis of flow behaviour using the Rayleigh number
It is now clearly understood that the convective flow patterns in the bulk are strongly influenced by the mushy zone morphology. Based on two distinct volumetric zones of the flow, the following two cases were considered for the estimation of convective strength: (a) permeable or mushy zone fluid and (b) bulk fluid.
4.1.1. Natural convective flow through the permeable mushy zone
The strength of solutal convection in the mushy zone can be estimated using the permeability-based Rayleigh number  $(R{a_{C\_P}})$, which is formulated as (Worster Reference Worster1997; Ramirez & Beckermann Reference Ramirez and Beckermann2003)
 \begin{equation}R{a_{C\_P}} = \frac{{g{\beta _C}\Delta {C_P}Kl}}{{D\nu }},\end{equation}
where g is the gravitational acceleration,  ${\beta _C}$ is the solutal expansion coefficient, K is the average permeability, l is the length scale, D is the solutal diffusivity,
 $\nu$ is the kinematic viscosity and
 $\Delta {C_P}$ is the composition difference between the initial and inter-granular regions. All the thermo-physical properties were taken as constant, and details are mentioned in (table 1). Here, Kl is the volumetric length scale in the mushy zone. For unidirectional solidification, the growth rate is not constant; hence, the length scale (l) was chosen to be the height of the mushy zone instead of the ratio of thermal diffusivity and growth rate. The permeability-based Rayleigh number
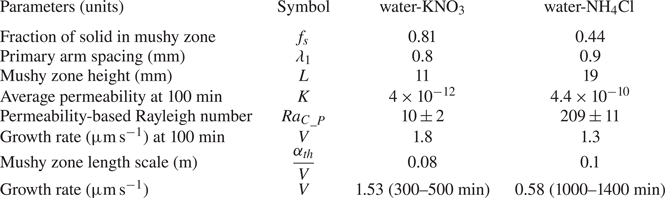
 $(R{a_{C\_P}})$ was calculated to be 10 ± 2 and 209 ± 11 for the water-KNO3 and water-NH4Cl systems at 100 min, respectively. Literature suggested that below the critical permeability-based Rayleigh number
 $(R{a_{C\_P}})$, the plumes were suppressed. In the present study, critical
 $R{a_{C\_P}}$ was estimated to be 93 ± 8. The critical
 $R{a_{C\_P}}$ was evaluated with the minimum composition difference required at the onset of plumes.
The average permeability ( $K = 6 \times {10^{ - 4}}\lambda _1^2({(1 - {f_s})^3}/f_s^2)$, Blake–Kozeny equation (Ramirez & Beckermann Reference Ramirez and Beckermann2003)) is a function of the primary arm spacing
 $({\lambda _1})$ and the mean solid fraction
 $(\,{f_s})$ in the mushy zone. These parameters were estimated from the images of the microstructures, shown in the insets of figure 3(b) (for water-KNO3), figure 3(e) (for water-NH4Cl) and figure 5(a,b). In the faceted case, the higher solid fraction and primary arm spacing typically result in a low value of the permeability (K) (permeability in faceted
 ${\ll} $ permeability in dendritic, table 2), which, along with a lower mushy zone height (l), leads to a low solutal Rayleigh number. In the presence of low permeability in faceted cases (low convective strength or Rayleigh number in the mushy zone), the less dense solute is transported to the bulk fluid without creating a stabilized plume (which also needs a considerable spacing between grains to stabilize). In the present study, it was observed that the permeability-based Rayleigh number was less for faceted cases than that of the critical
 $R{a_{C\_P}}$ (table 2), and, therefore, the condition for the formation of the plumes was not met (figure 3a,b).
Experimental details during solidification of water-23wt% KNO3 and water-24wt% NH4Cl.

4.1.2. Natural convection flow in the bulk fluid
The convective velocity scale in the bulk fluid  $({V_{scale}}\sim \sqrt {g{\beta _C}\Delta Ch} \sim Ra_{C\_Bulk}^{0.5}{h^{ - 1}})$ is proportional to the solutal expansion coefficient
 $({\beta _C})$,
 $\Delta C$ (composition difference between the initial and the instantaneous bulk-fluid compositions in water-KNO3 systems, and composition difference between the initial and the plume compositions in the water-NH4Cl case) and h (height of liquid) or solutal Ra in bulk fluid (
 $R{a_{C\_Bulk}}$). For estimating the bulk-fluid velocities, a differently scaled Ra is necessary. The solutal Rayleigh number in bulk fluid (
 $R{a_{C\_Bulk}}$) is defined with liquid height as length scale, and it is expressed as
 \begin{equation}R{a_{C\_Bulk}} = \frac{{g{\beta _C}\Delta C{h^3}}}{{D\nu }},\end{equation}
where h is the height of the liquid and h3 is the volumetric length scale for bulk fluid. Higher values of  ${\beta _C}$,
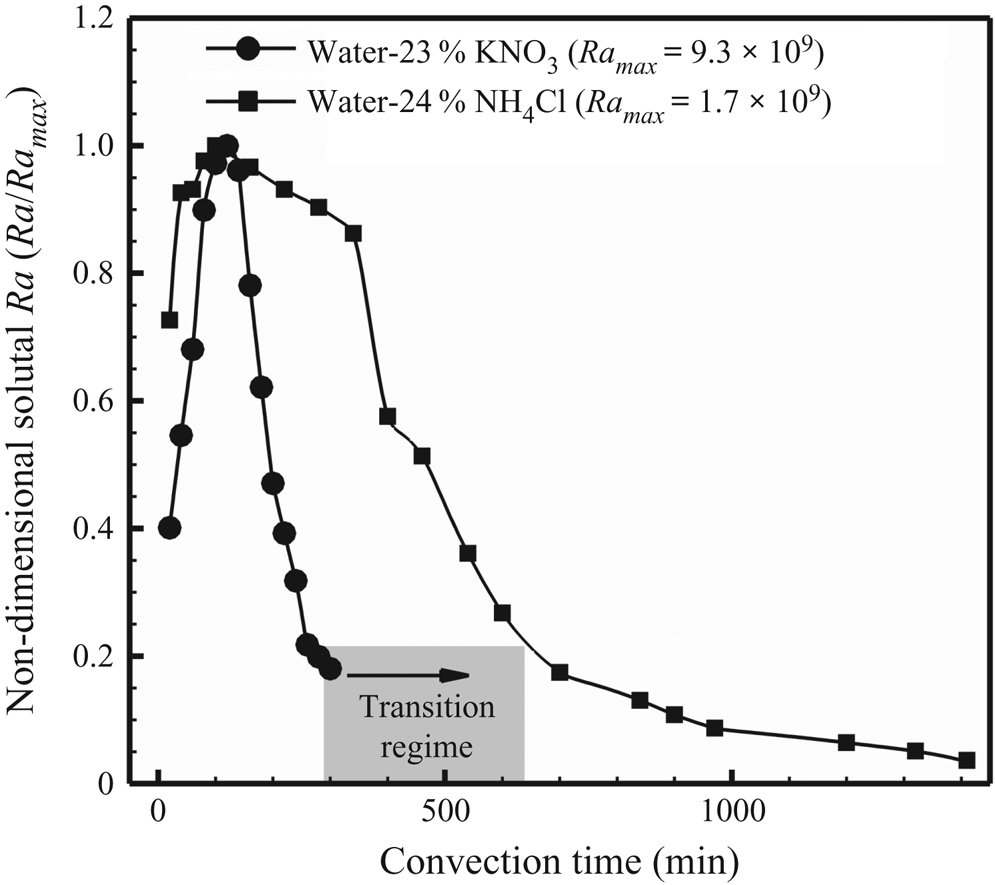
 $\Delta C$ and h (figure 5c) led to higher solutal Rayleigh number in the faceted case (water-KNO3). At 100 min, solutal Rayleigh number in the bulk fluid for water-23 wt% KNO3 was 9.1 × 10⁹ and 1.7 × 10⁹ for water-24 wt% NH4Cl. Similarly, water-KNO3 has a higher velocity scale (7.5 mm s−1 at 100 min) than water-NH4Cl (2 mm s−1 at 100 min), which agreed well with the experimental data obtained from PIV (figure 6). Figure 10 shows the transient variation of non-dimensional solutal Rayleigh numbers in bulk fluid. Non-dimensional solutal Rayleigh number in bulk fluid is the ratio of instantaneous Rayleigh number to the maximum Rayleigh number (
 $Ra/Ra_{\textit{max}}$). While the maximum solutal convection occurred at the same instant for both cases, the lower mushy zone permeability of the faceted solid rapidly suppressed the convection.
Non-dimensional solutal Ra (Ra/Ramax) in bulk fluid versus time for the water-23wt% KNO3 and water-23wt% NH4Cl experiments.

4.2. Energy balance in the transition regime
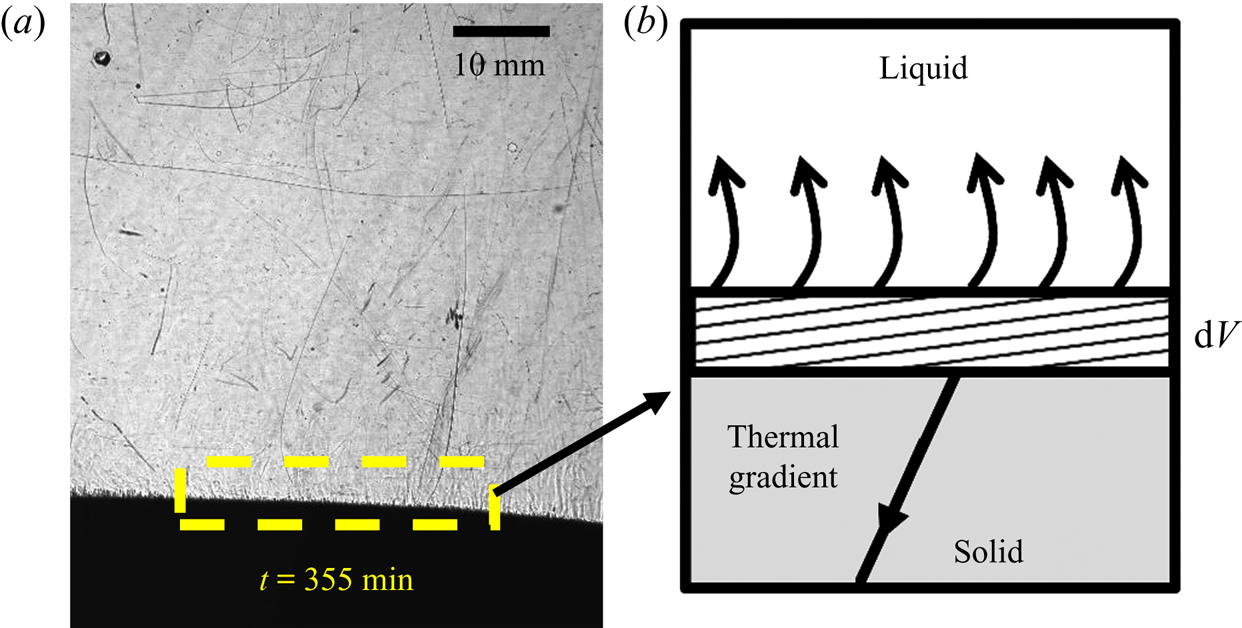
In order to correlate the role of natural convection patterns to the anomalous rise of liquid temperature in the faceted case, energy balance for a control volume was performed by considering the solidification of a differential volume element dV. Figure 11(a) shows an image of the experiment (water-KNO3, time = 400 min) in which a representative control volume at the interface is considered (figure 11b). The energy balance at the interface for the growth of dV amount of solid during the 300–500 min is expressed as
 \begin{equation}{k_s}\frac{{\textrm{d}{T_s}}}{{\textrm{d}x}} - {\rho _s}HV = {\rho _l}{C_{pl}}\Delta {T_{change}}V + {k_l}\frac{{\textrm{d}{T_l}}}{{\textrm{d}x}},\end{equation}
where  $\textrm{d}T/\textrm{d}x$ is the thermal gradient, with subscripts s and l corresponding to the solid and liquid sides of the control volume, k is the thermal conductivity, ρ is the density, H is the latent heat of fusion, V is the average growth rate during 300–500 min,
 $C_{{pl}}$ is the specific heat capacity of liquid,
 $\Delta {T_{change}}$ is the change in temperature of the liquid and
 $\Delta t$ is the duration of time (300–500 min). The volume of the liquid is continuously changing with the growth of the solid, represented by V (solid growth rate). Thermo-physical properties and experimental details for the present study are shown in tables 1 and 2.
(a) Energy balance at the liquid–solid interface in the transition region during faceted growth at 355 min. (b) Schematic of the control volume.

It was assumed that the interface temperature of the growing solid was the eutectic temperature, and the solid has a uniform gradient. The gradient in the solid and the average solid–liquid interface position was taken at approximately 400 min (figure 5c). In the presence of a negligible thermal gradient in the liquid due to random natural convection in the faceted case, a  $\Delta {T_{change}} = 13.1\,\mathrm{^\circ }\textrm{C}$ can be estimated from (4.3), which is approximately equal to the experimental gain of temperature in the liquid (in the transition regime, figure 7a). Note that for the dendritic case, the localized convection cannot be ignored, and thus the control volume analysis would not be valid. However, the gain in temperature for the dendritic case from (4.3) was near to 0 °C.
Based on these observations, a relation for the estimation of an approximate order of the gain in temperature (for a low permeability mush) is given by the following relation:
 \begin{equation}\Delta {T_{change}} \approx \frac{{\left( {{k_s}\displaystyle\frac{{\textrm{d}{T_s}}}{{\textrm{d}x}} - {\rho_s}HV} \right)}}{{{\rho _l}{C_{pl}}V}}.\end{equation}
After the reduction of local solutal convection, the composition ahead of the interface reached near eutectic. As the eutectic solid does not possess a mushy zone, a larger fraction of the solid was formed in the transition region compared to the previous regime. In the transition regime, a weak thermal gradient in the liquid developed. The time scale for the development of the thermal gradient in eutectic growth was  $(\alpha_{th} /{V^2})$ (~105 s), which is larger than the time duration associated with the transition regime (300–500 min ~104 s). This comparison validates the hypothesis that the gain of temperature in the liquid is primarily due to the reduced transport of heat in the solid.
The analysis finds that the uncharacteristic temperature rise during the solidification of the water-KNO3 mixture can be attributed to the localized solid fraction and morphology, controlled by the natural convection patterns ahead of the mushy zone. Though a length scale, such as the primary spacing, was offered by the faceted morphology, the absence of secondary arms, as in that of the dendritic case, meant that the liquid flow was completely restricted in the mushy zone. This was further aided by a higher solid fraction and early eutectic growth. Therefore, the fluid mixtures that freeze with low mushy zone permeability can exhibit a significant temperature increase during freezing. This study reveals the underlying physical mechanism behind the apparent heating of the liquid, which was previously thought to be associated with the laboratory surroundings. The control volume analysis considers experimentally known flow behaviour. Therefore, scaling analysis is presented to theoretically describe the role of the faceted morphology on convection.
5. Generalization of gain in temperature: a semianalytical study
In what follows, we present a semianalytical generalization of the gain in temperature of the liquid during freezing of mixtures with low permeable mushy zones. The analysis is presented for two extreme mushy zone permeability conditions, chosen to mimic two morphologies having (a) a high-permeable dendritic and (b) a low-permeable faceted mushy zones.
We first derive the relations of the two extreme permeability conditions and develop a correlation of the velocity field at the mushy–liquid interface with the mushy zone permeability. Subsequently, for a given density difference in the vertical direction, the horizontal and vertical velocity scales at the base of the liquid are compared, along with the vorticity values. In the case of a low permeable mush, it is seen that while the vertical component of velocity is smaller compared to its counterpart, the vorticity scales are considerably larger. We use this theoretical basis to show that the mixing is always higher in such cases, which can lead to a near-uniform temperature and compositional distribution in the bulk liquid. Subsequently, a simplified, one-dimensional numerical solution is used to demonstrate the mechanism of the temperature gain.
5.1. Role of permeability on the convective scales
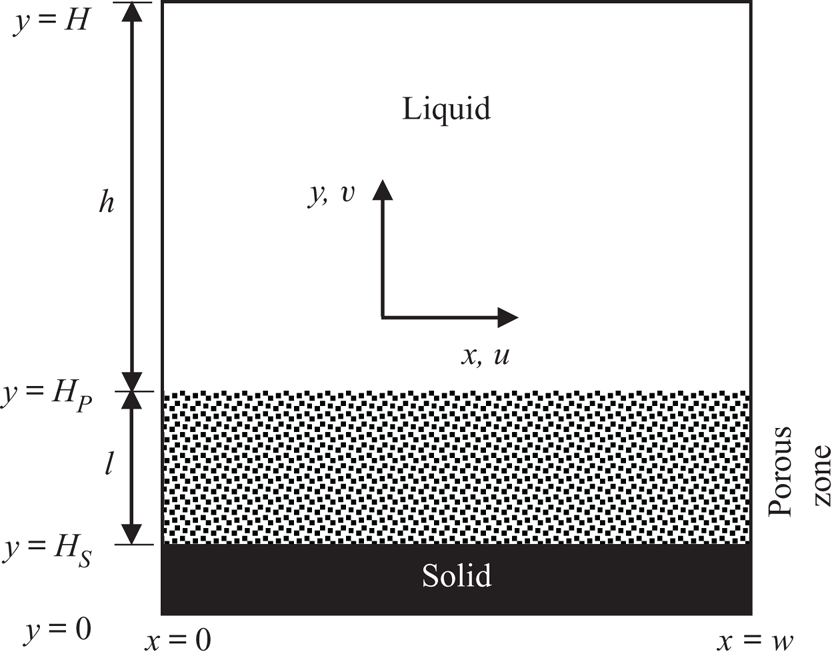
A scale analysis is performed to obtain the velocity, temperature/composition scales in the mushy/porous, and the bulk zones during convection. For the analysis, we consider a three-layer (solid, porous mushy zone and liquid) system in a bottom-cooled configuration, as shown in figure 12.
Schematic representation of problem description for the scale analysis.

The solid is of height HS with a mushy zone of height l above the solid. The mushy zone is characterized by a porous zone with an overall permeability K, which is assumed to be constant in the present analysis. A liquid layer of height h is available on top of this porous zone. The system can be envisaged to be a unidirectional solidification case, where the height of the mushy zone is constant during the convection process. The left and right walls are considered adiabatic. Note that a thermally stable condition is assumed, and compositional gradient is considered as the driving factor for the Rayleigh–Bénard convection. The scale analysis using the Rayleigh number in the (a) porous and (b) bulk-fluid zones are discussed separately below.
5.1.1. Porous zone: HS ≤ y ≤ HP
The governing equations for the mass, Darcy flow, energy and species conservation, and respective boundary conditions in the porous media are written as
conservation of mass:
 \begin{equation}\frac{{\partial u}}{{\partial x}} + \frac{{\partial v}}{{\partial y}} = 0,\end{equation}
Darcy flow in x direction:
 \begin{equation}u ={-} \frac{K}{\mu }\frac{{\partial P}}{{\partial x}},\end{equation}
Darcy flow in y direction:
 \begin{equation}v ={-} \frac{K}{\mu }\left( {\frac{{\partial P}}{{\partial y}} + \rho g} \right),\end{equation}
conservation of energy:
 \begin{equation}\frac{{\partial T}}{{\partial t}} + u\frac{{\partial T}}{{\partial x}} + v\frac{{\partial T}}{{\partial y}} = {\alpha _{th}}\left( {\frac{{{\partial^2}T}}{{\partial {x^2}}} + \frac{{{\partial^2}T}}{{\partial {y^2}}}} \right),\end{equation}
conservation of species:
 \begin{equation}\frac{{\partial C}}{{\partial t}} + u\frac{{\partial C}}{{\partial x}} + v\frac{{\partial C}}{{\partial y}} = D\left( {\frac{{{\partial^2}C}}{{\partial {x^2}}} + \frac{{{\partial^2}C}}{{\partial {y^2}}}} \right),\end{equation}
boundary conditions:
 \begin{equation}\left. {\begin{array}{c@{}} {u,v = 0,T = Th,C = {C_S}\quad \textrm{at}\,y = {H_S}},\\ {u = {u_l}, v = {v_l},T = {T_{interface}},C = {C_{interface}}\quad \textrm{at}\,y = {H_P}}, \end{array}} \right\}\end{equation}
where u and v are velocity in x and y directions, respectively,  $\mu$ is the dynamic viscosity of liquid and P is pressure. Density
 $(\rho )$ is established with Boussinesq approximation
 $\rho = {\rho _0}[1 - {\beta _T}(T - {T_0}) - {\beta _C}(C - {C_0})]$, where
 $\beta_T$ is thermal expansion coefficient in
 $\text{K}^{-1}$. For the scale analysis in the porous zone, flow is assumed to be predominant along the y-axis
 $(v \gg u)$. From that, the velocity scales can be written as (5.2a,b). Note that the ratio of the two length scales in the system, namely the primary arm spacing of the microstructural features and the length of the mushy region, given by
 ${\lambda _1}/l$, is negligible. This reaffirms the assumption of
 $v \gg u$.
 \begin{equation}v \approx \frac{{gK\Delta \rho }}{\mu }\sim \frac{{gK{\beta _T}\Delta T}}{\upsilon },\quad u \approx \frac{{gK\Delta \rho }}{\mu }\frac{{{\lambda _1}}}{l}\sim \frac{{gK{\beta _T}\Delta T}}{\upsilon }\frac{{{\lambda _1}}}{l}.\end{equation}
The convective velocity scale can be written in terms of the composition
 \begin{equation}{v_P}\sim \frac{{gK{\beta _C}\Delta C}}{\upsilon },\quad {u_P}\sim \frac{{gK{\beta _C}\Delta C}}{\upsilon }\frac{{{\lambda _1}}}{l}.\end{equation}
Subscript P stands for the porous (mushy) zone. From the scale relations, it can be clearly observed that, as the permeability decreases, v and u show lower velocities for a given buoyancy-driven system. This implies that the faceted cases have lower vertical velocities than those of the dendritic cases in the mushy zone. At the base of the plumes (in dendritic growth), low solid fraction (and higher primary arm spacing) leads to a high value of the permeability (K), which indicates a higher velocity in porous zone.
5.1.2. Bulk-fluid zone: HP < y ≤ H
For the scale analysis in the bulk fluid, the conservation of mass, momentum and energy in the bulk fluid is given in (5.3). The conservation of momentum in the bulk is solved through the Navier–Stokes equation.
Mass conservation:
 \begin{equation}\frac{{\partial u}}{{\partial x}} + \frac{{\partial v}}{{\partial y}} = 0,\end{equation}
momentum balance:
 \begin{equation}\frac{{\partial \boldsymbol{v}}}{{\partial t}} + \boldsymbol{v}\boldsymbol{\cdot}\boldsymbol{\nabla v} ={-} \frac{1}{{{\rho _0}}}{\boldsymbol{\nabla}}\boldsymbol{P} + \upsilon {\nabla ^2}\boldsymbol{v} - \frac{{\rho g}}{{{\rho _0}}},\end{equation}
energy conservation:
 \begin{equation}\frac{{\partial T}}{{\partial t}} + u\frac{{\partial T}}{{\partial x}} + v\frac{{\partial T}}{{\partial y}} = {\alpha _{th}}\left( {\frac{{{\partial^2}T}}{{\partial {x^2}}} + \frac{{{\partial^2}T}}{{\partial {y^2}}}} \right),\end{equation}
species conservation:
 \begin{equation}\frac{{\partial C}}{{\partial t}} + u\frac{{\partial C}}{{\partial x}} + v\frac{{\partial C}}{{\partial y}} = D\left( {\frac{{{\partial^2}C}}{{\partial {x^2}}} + \frac{{{\partial^2}C}}{{\partial {y^2}}}} \right).\end{equation}
The vector v represents u and v velocities in x and y directions, respectively. The vertical component of velocity at the interface of porous media and bulk liquid will be equal ( ${v_{P - }} = {v_{P + }}$, where
 ${v_{P - }}$ is the vertical velocity magnitude in the porous zone and v P+ is the vertical velocity magnitude in the bulk liquid; point P is the interface of porous media and bulk liquid). The horizontal component of velocity at this interface was proposed by Beavers & Joseph (Reference Beavers and Joseph1967), and is given by
 \begin{equation}\mathop {\frac{{\partial u}}{{\partial y}}}\nolimits_{y = {H_P}} = \frac{\chi }{{\sqrt K }}({u_{P + }} - {u_P}),\end{equation}
where  ${u_{P + }}$ indicates horizontal velocity at the interface of porous and bulk fluid,
 $\chi$ is a unit order dimensional quantity, which characterizes the structure of permeable material within the porous zone (Beavers & Joseph Reference Beavers and Joseph1967). From the relation, it can be concluded that the horizontal velocity gradient is inversely proportional to permeability. The high velocity gradient in the low permeable case implies more vorticity and circulation which can lead to low gradient of temperature and species (vorticity/circulation is inversely proportional to thermal or compositional gradient (Meunier & Villermaux Reference Meunier and Villermaux2003)). The lower permeability in faceted growth leads to a higher horizontal velocity gradient in the vertical direction when compared to the dendritic case.
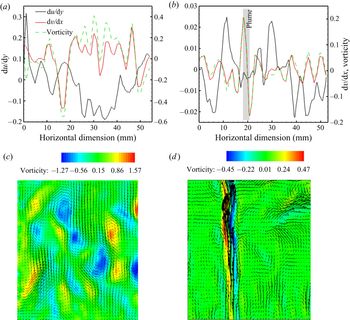
As a secondary confirmation, we compare the scaling relations with the measured velocity gradient and vorticity near the interface experimental PIV data, as shown in figures 6 and 13. Figure 13(b) shows that the vorticity in the x–y plane near the interface is mainly dominated by the horizontal gradient of vertical velocity, compared to the vertical gradient of horizontal velocity. At the plume location (high permeable dendritic case), the vertical gradient of horizontal velocity is negligible, which indicates that, in the bulk, there is low circulation, and the plume is the only dominant convective path. Whereas, in the faceted case having low permeability (figure 13a), the vorticity is controlled by the vertical gradient of horizontal velocity and horizontal gradient of vertical velocity, which is known to create considerable mixing in the bulk. The mixing in the faceted case leads to the homogenization of thermal and composition field, as observed in figure 7(a), whereas the plume creates a thermal and composition gradient in bulk with a lower magnitude of vorticity. In the following section, this behaviour is represented through a numerical simulation in order to capture the average temperature rise in the bulk.
Experimentally captured data of the vertical gradient of horizontal velocity, the horizontal gradient of vertical velocity and vorticity near the solid–liquid interface at 100 min during solidification of (a) water-23 wt% KNO3 (low permeable faceted growth) and (b) water-24 wt% NH4Cl (high permeable dendritic growth). Vorticity fields for the faceted case (c), and its corresponding velocity field from figure 6(a), and for the dendritic case (d), and its corresponding velocity field from figure 6(c). These data are provided as supporting information to theoretical scaling estimate.

5.2. Gain in temperature during the transition regime
A numerical model to simulate solidification was developed with an aim to generalize the plausible mechanism behind the gain in the liquid temperature. The aim of the simulation is to demonstrate the evolution of the thermal field during the onset of eutectic phase growth after the reduction of convection. A one-dimensional simulation of solidification was performed with the following assumptions: (a) the solid–liquid interface is flat during eutectic growth (this assumption is well justified by the experimental data presented earlier) and the interface is maintained at the eutectic temperature, and (b) the system is in a bottom-cooled configuration with a fixed temperature at the bottom and an adiabatic top surface. The conditions of the simulation are based on the actual experimental measurements to enable the generalization in both high and low Prandtl number (Pr) fluids. The simulation methodology involves explicitly solving the heat equation with a Dirichlet-type temperature boundary at the bottom, an adiabatic boundary at the top and the Stefan condition at the solid–liquid interface. The heat equation for solid and liquid and the boundary conditions are given by
 \begin{gather}\rho {C_p}\frac{{\partial T}}{{\partial t}} = \frac{\partial }{{\partial x}}\left( {k\frac{{\partial T}}{{\partial x}}} \right),\end{gather}
 \begin{gather}T{|_{x = 0}} = {T_{Bottom}},\end{gather}
 \begin{gather}{\left. {\frac{{\partial T}}{{\partial x}}} \right|_{x = L}} = 0,\end{gather}
 \begin{gather}{\left. {{k_s}\frac{{\textrm{d}{T_s}}}{{\textrm{d}x}}} \right|_{x = {x^ \ast }}} - \rho HV = {\left. {{k_l}\frac{{\textrm{d}{T_l}}}{{\textrm{d}x}}} \right|_{x = {x^ \ast }}},\end{gather}
where  $\rho$ is the density, t is the time, and
 ${x^ \ast }$ is the position of the solid–liquid interface.
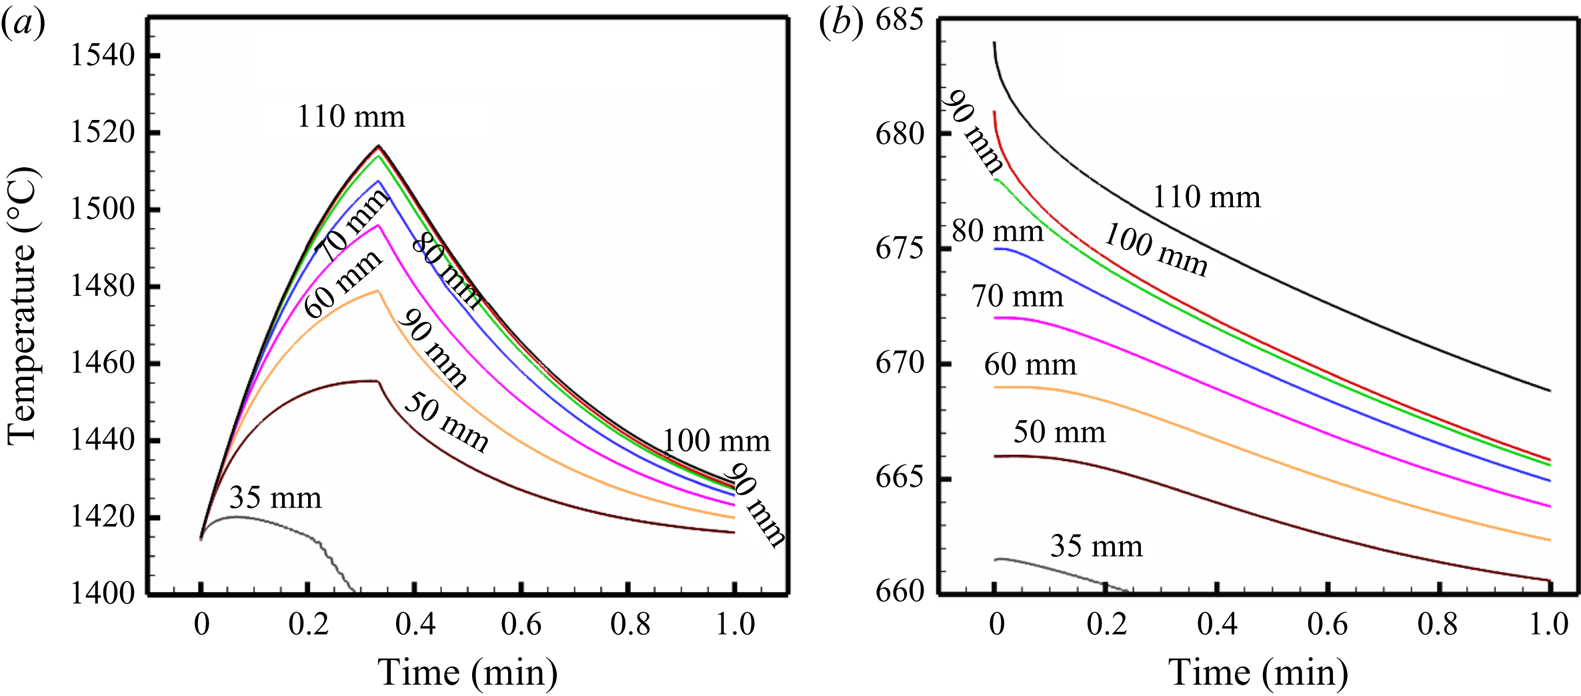
In systems that experience dendrite formation, convection in the liquid is non-existent at the onset of the formation of the eutectic phase. Thus, the system can be assumed to solidify under purely conductive heat transfer conditions, which is well described by the above model. However, systems that exhibit faceted growth experience almost negligible thermal gradients in the liquid phase due to vigorous random convection in the bulk liquid prior to the onset of eutectic growth, which gradually reduces with time through the transition regime. The heat transfer in this regime is through conduction and localized random convection. The convective effects enhance the net heat flow into the liquid phase. Therefore, the net heat flow into the liquid is considered to be higher than that of pure conduction alone, by approximately 2–4 times. This is justified by considering the orders of magnitudes of conductive (~20 W m−2) and convective (~80 W m−2) heat flux on the liquid side of the interface. Note that this exercise was performed with a primary objective of capturing an order of magnitude of the temperature change, with the help of a simplified one-dimensional model. For accurate predictions of temperature change, more exact, three-dimensional numerical simulations would be performed; these have not been included here to avoid restricting the focus of the present investigation. The initial temperature gradient condition in the cell has been used from the experimental data, as shown in figure 7.
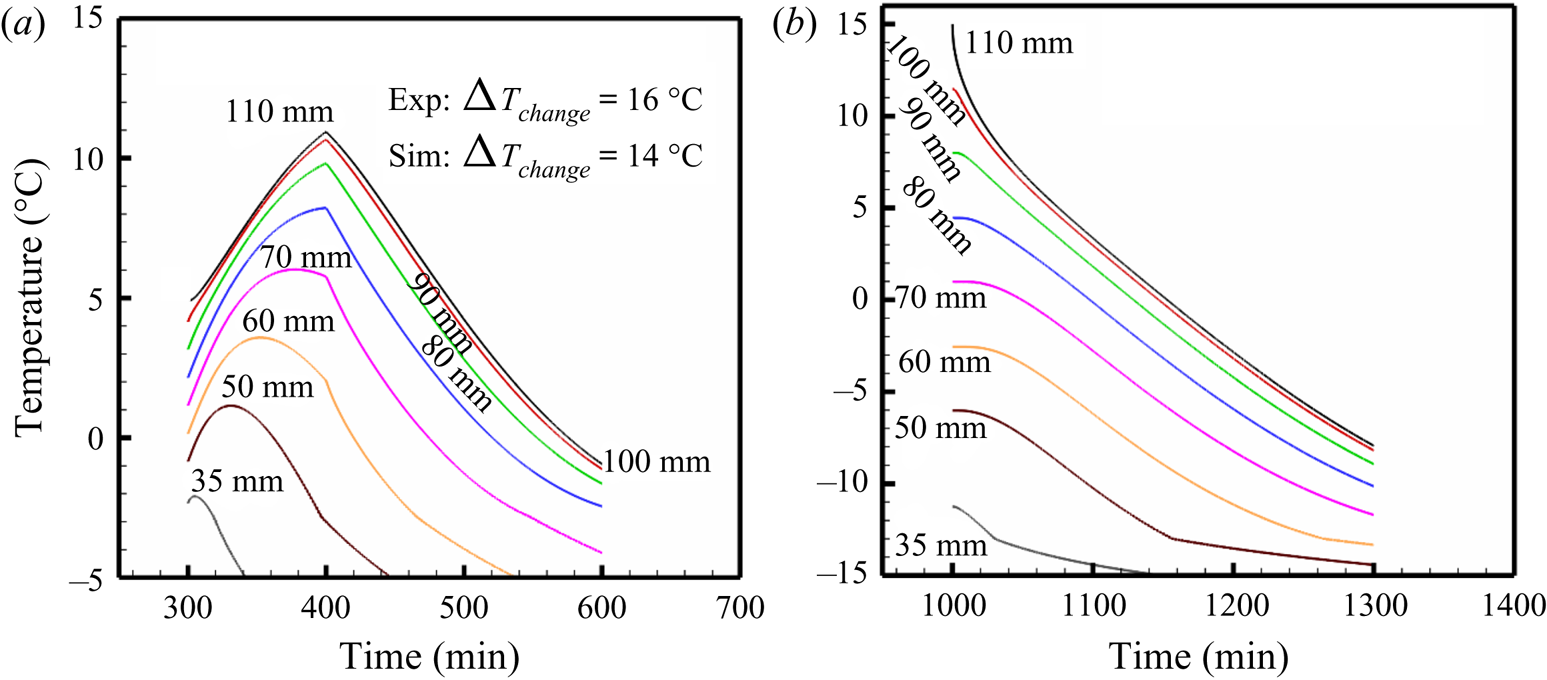
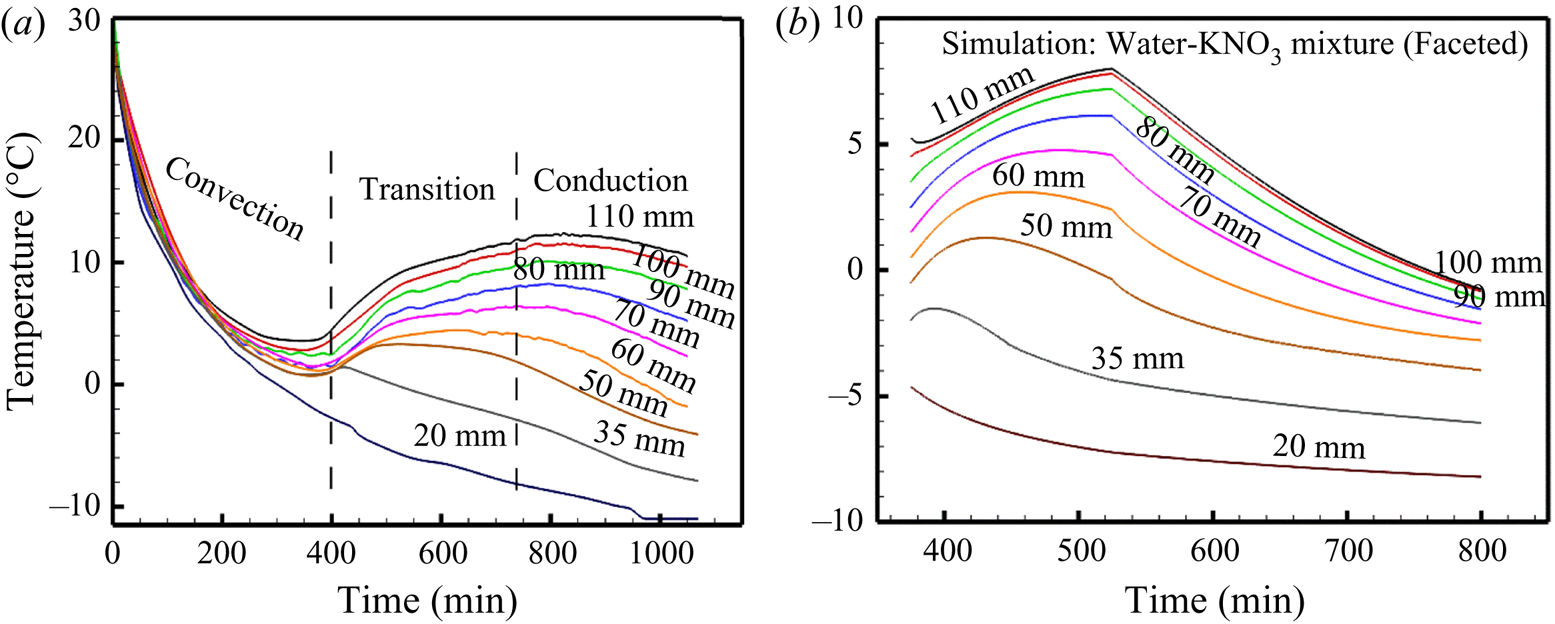
At the end of the transition regime, the system experiences a purely conductive heat transfer. Simulations were performed on NH4Cl and KNO3 materials (figure 14). Further, simulations were also performed on low-Prandtl-number fluids, such as alloys of aluminium (dendritic) and silicon (faceted), in order to observe the corresponding thermal fields (figure 15).
Temperature plot at different positions in the cell after the end of convection during (a) faceted growth of the water-KNO3 system and (b) dendritic growth in the water-NH4Cl system.

Temperature plot at different positions in the cell in the metallic system during solidification of (a) faceted growth in Si-alloy and (b) dendritic growth in the Al-alloy system.

The temperature history at various locations along the height is evaluated, mimicking the experimental measurement locations. The comparison shows a clear agreement between the two sets of results (figures 7 and 14). The NH4Cl (dendritic) case predicts monotonically decreasing temperature with time, while the KNO3 (faceted) case predicts a gain in the temperature profile in the transition regime. The extent of temperature rise is of similar magnitude as observed in the experimental results. Therefore, the mechanism of random convective flow causing an earlier eutectic transformation resulting in an increased liquid temperature is also ascertained with this numerical analysis. Similarly, numerical simulations on low-Prandtl-number fluids, such as alloys of aluminium and silicon also predicted a similar temperature profile (figure 15), thus indicating that the hypothesis could be extended to the realm of low-Pr fluids.
6. Conclusions
The present experimental study investigated the role of microstructural morphology in governing the natural convection patterns in faceted and dendritic growth during bottom-cooled solidification. Real-time visualization of the flow field was presented with the help of shadowgraph and PIV techniques. The study primarily sheds insights into the differences between the mushy zone Rayleigh numbers of the dendritic and faceted cases that capture the microstructural physics via the mushy-zone permeability, the resulting nature of circulation in the bulk, and the mechanism behind an uncharacteristic gain in the bulk-liquid temperature.
(i) The values of solutal Rayleigh number in the mushy zone
 $(R{a_{C\_P}})$ were found to be 10 ± 2 and 209 ± 11, whereas those in the bulk fluid Ra $(R{a_{C\_Bulk}})$ were 9.1 × 10⁹ ± 1.3 × 10⁹ and 1.7 × 10⁹ ± 2.1 × 10⁸ for water-23 wt% KNO3 (faceted) and water-24wt% NH4Cl (dendritic), respectively. The $R{a_{C\_P}}$ for the faceted case was found to be considerably lower than the critical value required for plume formation (93 ± 8).
(ii) The convective flow patterns were predominantly in the form of plumes during dendritic cases, whereas they were completely random in the faceted case due to suppressed permeability. During dendritic solidification, considerable thermal gradients continued to exist ahead of the interface throughout the course of solidification, resulting in a monotonic decrease of the bulk-fluid temperature over time.
(iii) However, the faceted solidification was observed to develop an anomalous temperature rise after the initial vigourous mixing, at the onset of the eutectic solidification. This is attributed to the homogenization of the thermal fields in the liquid, resulting in a negligible thermal gradient as well as uniform composition (near to eutectic composition) ahead of the interface. This led to a much faster solidification and release of a larger amount of latent heat, which was further advected through the bulk liquid. The mechanism is further verified by changing the mixture composition, base temperature and the mixture itself.
(iv) This observation is further generalized with the help of a semianalytical, one-dimensional model of solidification, in which the random convective mixing is simplified to a homogenized temperature field. This simplification is made on the basis that the scaling relations of flow and vorticity fields in the porous mush and bulk-fluid zones, as a function of mushy zone permeability, are evaluated using the local solid fraction, microstructural spacing and morphology. It is shown that the vorticity is considerably higher for the low permeable mush (faceted case), which is known to enhance mixing in the bulk. The subsequent numerical simulation of the temperature in the liquid was performed on both high-Pr (water-based) as well as low-Pr (metallic) fluid systems exhibiting dendritic and faceted structures. The results clearly ascertained the existence of an unconventional thermal behaviour during freezing for a generic alloy mixture that can exhibit low permeability in the mushy region.


The present work highlights the importance of mushy zone permeability and has shed new insights into the role of natural convection in changing the bulk-fluid temperatures.
Acknowledgements
The authors gratefully acknowledge the financial support from the Department of Science and Technology (DST), India (Grant No. EMR/2015/001140).
Declaration of interests
The authors report no conflict of interest.
Appendix A. Gain in temperature during solidification of water-KNO3 (faceted) systems
A.1. With varied initial composition
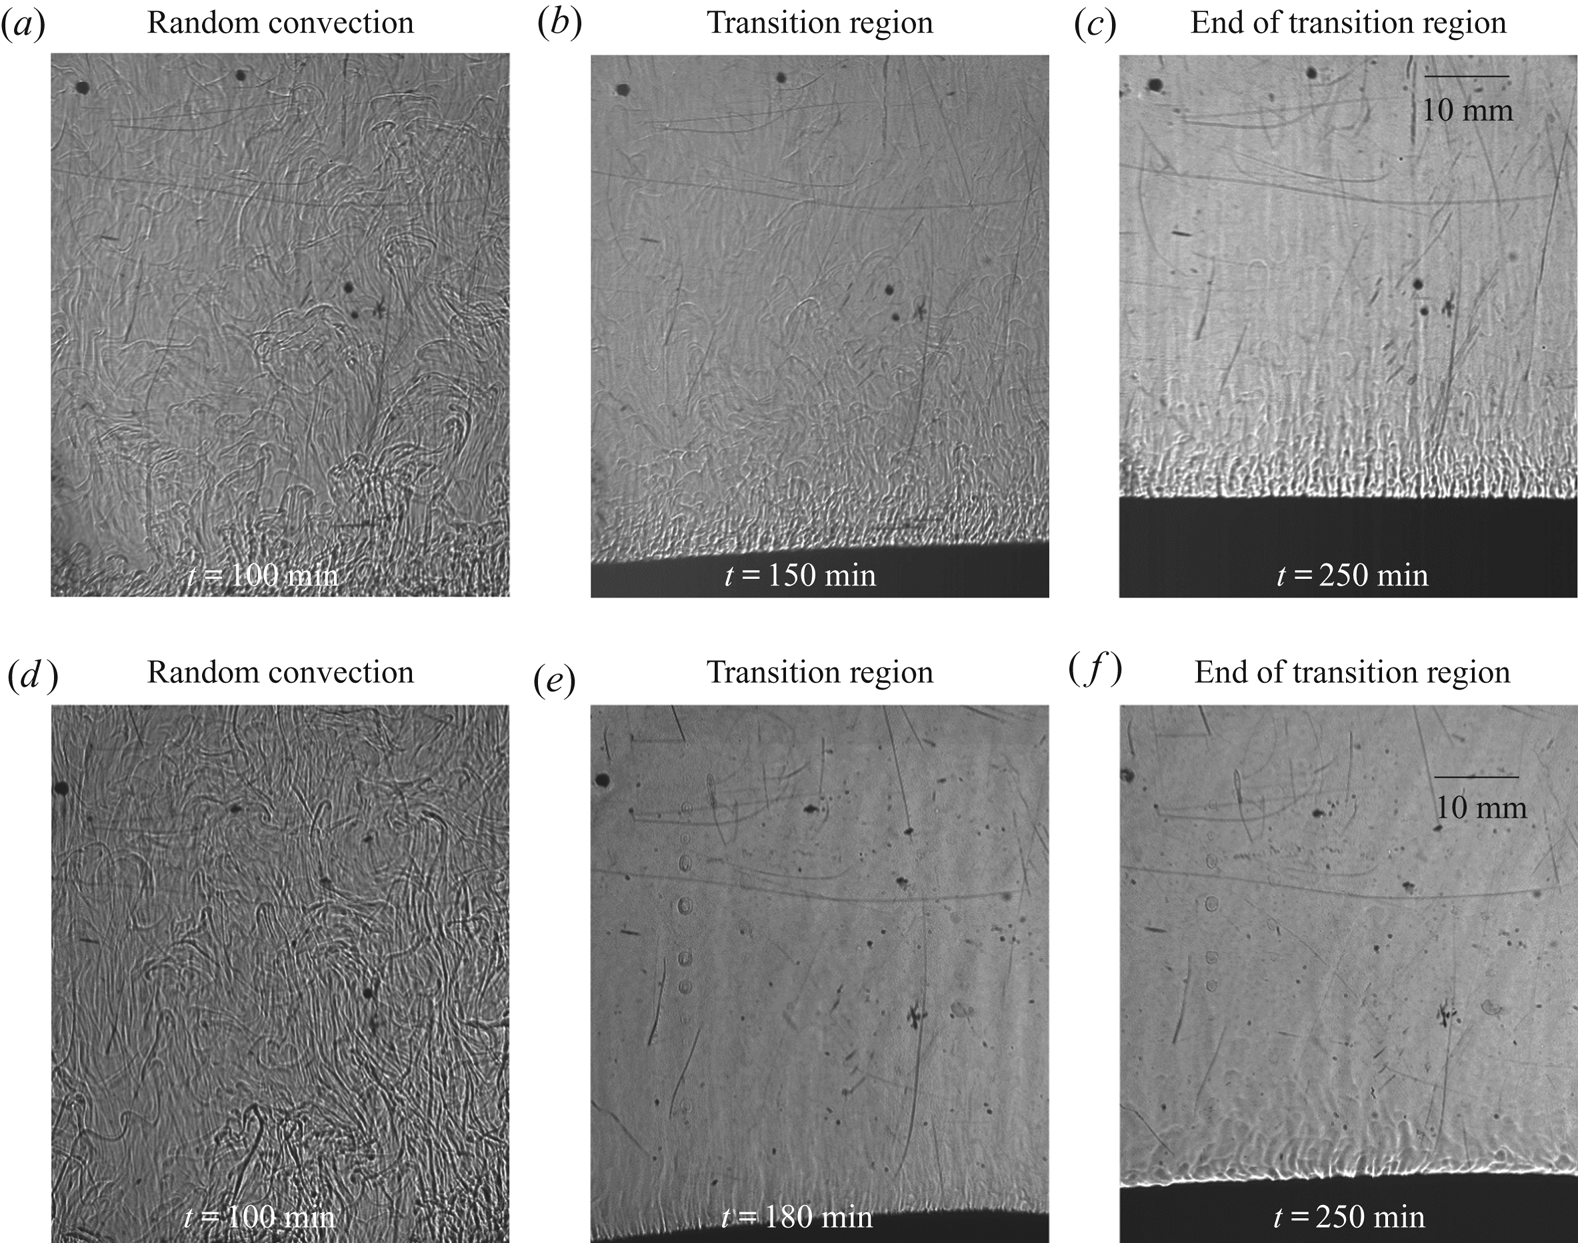
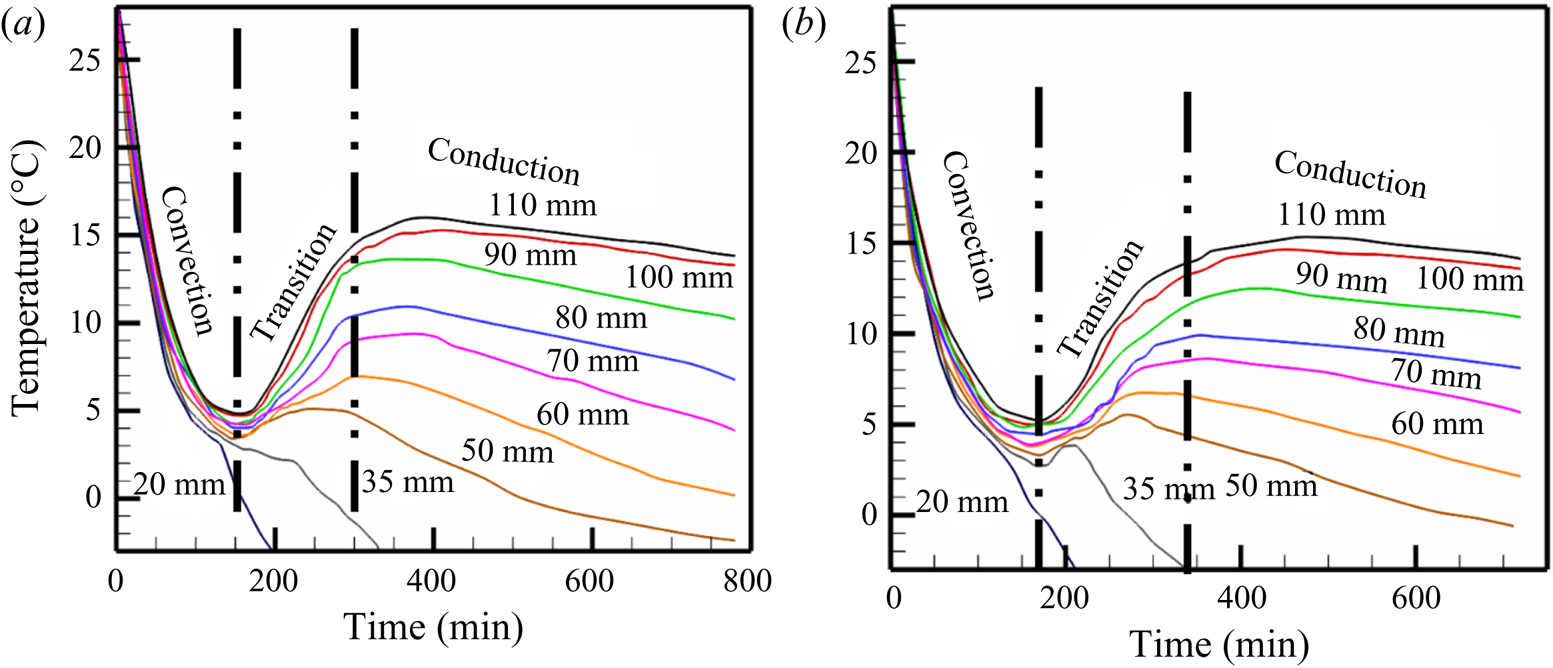
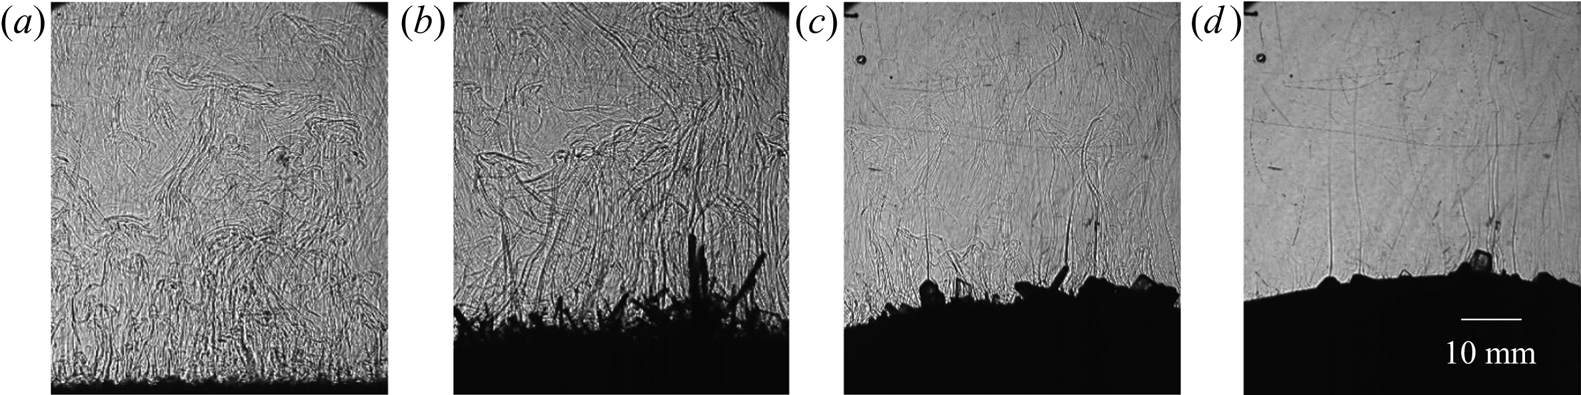
Due to the high solid fraction in faceted growth (low permeability), the bulk-liquid composition reaches the near-eutectic composition in the early stages of solidification (compared to the dendritic case) and experiences negligible thermal and compositional gradients in liquid. In the study, a composition far away from the eutectic (23 % KNO3) was chosen to clearly demonstrate the growth regimes leading to a final eutectic formation. Here, observations from additional experiments with 15 % and 18 % KNO3 are reported. If the initial composition in the faceted cases is chosen to be near the eutectic, it seems that random convection and high solid fraction were not solely responsible for the composition reaching eutectic. Hence, the authors have chosen a water-23 wt% KNO3, which is far from the eutectic. Random convection, suppression of convection and eutectic growth during solidification of water-15 wt% KNO3 (figure 16a–c) and water-18 wt% KNO3 (figure 16d–f) were observed. Further, the anomalous gain in temperature during the transition regime was observed in both water-15 wt% KNO3 (figure 17a) and water-18 wt% KNO3 (figure 17b) systems. This reaffirms the observations made for water-23 wt% KNO3 (figure 7).
Observation of convective flow patterns using shadowgraph for (a–c) water-15 wt% KNO3 and for (d–f) water-20 wt% KNO3: (a,d) random solutal convection at 100 min, (b,e) reduction in convective strength and localized solutal convection and (c,f) bulk composition near to eutectic and eutectic growth at 250 min.

Temperature measurement at the different heights within the cell during solidification of (a) water-15 wt% KNO3 and (b) water-20 wt% KNO3.

A.2. With varied bottom temperature
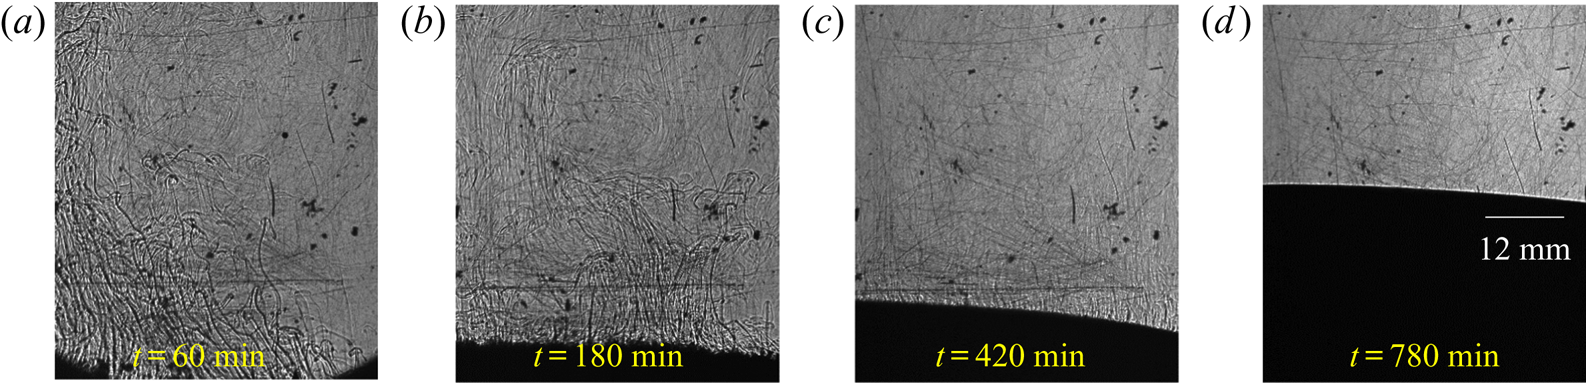
The difference between the eutectic temperature and the bottom temperature in water-23 wt% KNO3 and water-24 wt% NH4Cl were 19.16 °C and 8.09 °C, respectively. To clarify the influence of the bottom temperature on the occurrence of anomalous temperature rise in the bulk liquid, a bottom temperature of −11 °C was applied in otherwise similar experimental conditions (figure 18) (in these experiments, the difference between eutectic and bottom temperature in the faceted case is 8.16 °C, which is similar to that of the dendritic case (water-24 wt% NH4Cl)). An increase in the growth rate at the end of convection was observed (figure 19b). However, the magnitude was lower than the previously used bottom-cooled temperature of −22 °C, as expected (figure 19b). The phenomenon of anomalous gain in temperature of bulk fluid in the transition regime was also observed (figure 20a). Since the rate of eutectic growth is slower in comparison to the −22 °C case, magnitude of the temperature rise was observed to be lower. Further, the numerical model also shows similar results (figure 20b). Thus, it conclusively demonstrates that the changes in the bottom temperature do not alter the convective patterns, the increase in the growth rate after convection and the anomalous temperature rise.
Convective flow patterns for water-23 wt% KNO3: (a) random solutal convection at 60 min, (b) similar flow with reduction in convective strength at 180 min, (c) localized solutal convection and composition reached near-eutectic composition at 420 min and (d) eutectic growth at 780 min.

(a) Evolution of the solid phase during solidification of water-23 wt% KNO3 at 660 min, where the bottom cooling condition was imposed with −11 °C. (b) Comparison of the height of interface with the time of experiments during solidification of water-23 wt% KNO3 with different bottom-cooled plate temperatures.

Temperature measurement at different heights within the cell for (a) experiment of water-23 wt% KNO3 where the bottom was maintained at −11 °C and (b) numerical prediction of water-23 wt% KNO3 where the base was maintained at −11 °C.

Appendix B. Gain in temperature during solidification of water-Na2SO4 (other faceted) systems
To generalize the observations reported in faceted systems, experiments were performed on a similar binary mixture that exhibits faceted morphology upon solidification. Faceted growth and random convection were observed during solidification of water-18 wt% Na2SO4 as shown in figure 21, which were similar to water-23 wt% KNO3. The temperature measurements show the three regimes are similar to the water-KNO3 case, as shown in figure 22. Note: Eutectic temperatures of binary eutectic of water-4 wt% Na2SO4 is −1.5 °C (McCarthy et al. Reference McCarthy, Cooper, Kirby, Rieck and Stern2007).
Convective flow observation using shadowgraph (a–d) for water-18 wt% Na2SO4: (a) random solutal convection at 60 min (b) similar flow at 260 min, and faceted microstructure was observed (c) reduction in convective strength (d) localized solutal convection and composition reached near-eutectic composition and the sloped interface was observed at 450 min.  $(a)\, t = 40\,{\rm min},\, (b)\, t = 80\,{\rm min},\, (c)\, t = 300\,{\rm min}\,\, {\rm and}\,\, (d)\, t = 450\,{\rm min}.$

Temperature measurement at the different heights within the cell during solidification of water-18 wt% Na2SO4.

Appendix C. Transport phenomena during solidification of water-NH4Cl (dendrite) systems
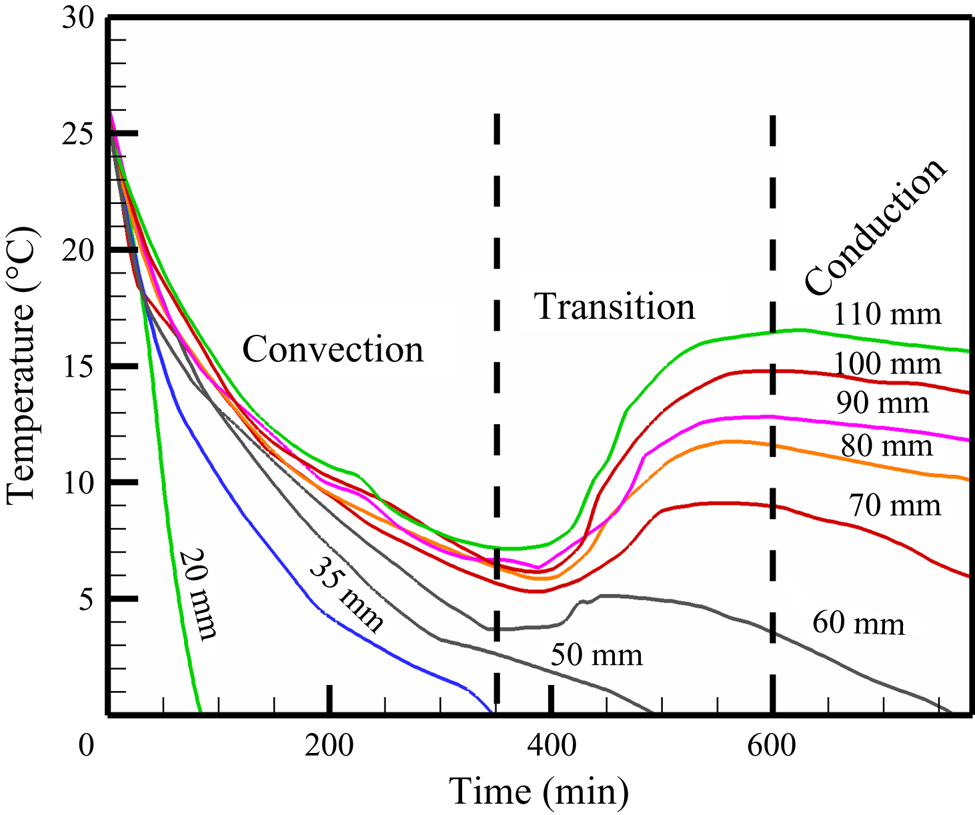
Observation of plume formation, suppression of plume and localized convection during solidification of water-27 wt% NH4Cl are shown in figure 23(a–c). Figure 24 shows the decreases in temperature at all the positions in the cell during dendritic growth.
Convective flow observation using shadowgraph during solidification of water-27 wt% NH4Cl. (a) Plume convection, (b) Suppression of plume and (c) Localized convection.

Temperature measurement at the different heights within the cell during solidification of water-27 wt% NH4Cl. All the thermocouple temperatures decrease with a similar cooling rate in the presence of dendrites.