INTRODUCTION
As a member of the xanthophyll family of carotenoids, lutein contains two hydroxyl groups on each side of the molecule (Seppanen et al. Reference Seppanen, Rahmani and Csallany2003). In plants, lutein has important functions as an antioxidant and can shield plants from light-induced free radical damage (Baroli & Niyogi Reference Baroli and Niyogi2000). Although lutein is not an essential nutrient for humans, lutein still plays an important role in maintaining and improving eye, heart and skin health (Dwyer et al. Reference Dwyer, Navab, Dwyer, Hassan, Sun, Shircore, Hama-Levy, Hough, Wang, Drake, Merz and Fogelman2001; Landurm & Bone Reference Landurm and Bone2001; Heinrich et al. Reference Heinrich, Gartner, Wiebusch, Eichler, Sies, Tronnier and Stahl2003). Lutein is the major carotenoid component in soybean [Glycine max (L.) Merr.] seeds (Seppanen et al. Reference Seppanen, Rahmani and Csallany2003). Lutein is richer in immature soybean seeds than in mature seeds (Simonne et al. Reference Simonne, Smith, Weaver, Vail, Barnes and Wei2000), and green cotyledons contain higher amounts of lutein than yellow cotyledons (Monma et al. Reference Monma, Terado, Ito, Saito and Chikuni1994). Soybeans are rarely considered a primary lutein source because they contain lower lutein content than sweetcorn and peas. Sweetcorn and peas are the top two crops for dietary intake of lutein in many countries, including the UK, Ireland and Canada (Johnson-Down et al. Reference Johnson-Down, Saudny-Unterberger and Gray-Donald2002; Granado et al. Reference Granado, Olmedilla and Blanco2003). However, soybean-derived food is traditional in the diets of many Asian countries, such as China, Japan and Korea. Increasing lutein content in soybean seeds is believed to be an effective way to improve the nutritional value of soybean-derived food. Therefore, a soybean cultivar with increased lutein content in the seed would be a desirable objective for a breeding programme.
Variations of lutein in different soybean genotypes have been analysed. Kanamaru et al. (Reference Kanamaru, Wang, Abe, Yamada and Kitamura2006) evaluated the seed lutein content of 490 cultivated and 610 wild soybean (Glycine soja Sieb. & Zucc) accessions, and the results suggested that lutein content in wild soybeans (mean: 14·31 µg/g and range from 5·8 to 32·8 µg/g) was significantly higher than that in cultivated soybeans (mean: 3·7 µg/g and range from 1·6 to 14·8 µg/g). Additionally, the lutein content in high-lutein wild soybean accessions was stable over years. Wang et al. (Reference Wang, Kanamaru, Li, Abe, Yamada and Kitamura2007) estimated the heritability of lutein content from a population of a cultivated soybean variety ‘Keszthelyi A.S’ and a wild soybean strain ‘B09092’, and the results indicated that lutein in soybean seed was highly heritable (0·41 and 0·72 in the F 2 and F 2 : 3 generations, respectively). Whent et al. (Reference Whent, Hao, Slavin, Zhou, Song, Kenworthy and Yu2009) reported that genotype, environment and genotype × environment interaction could represent 78, 18 and 4% of the total lutein variation, respectively. The results of Lee et al. (Reference Lee, Shannon, So, Sleper, Nelson, Lee and Choung2009) showed that the lutein content in cultivated soybeans was not sensitive to the year or planting date in four environments, but genotype interacting with environment (genotype × year and genotype × planting date) significantly affected soybean seed lutein content. The results of these studies showed that lutein content in soybean seeds was a highly heritable trait and that selection of a soybean cultivar with higher lutein content seemed possible to achieve. However, breeding a soybean cultivar with higher lutein content was still a challenge due to a limitation in genetic information, the complexity of the evaluation of phenotypic value and the effects of environmental variation.
Genetic mapping of quantitative trait loci (QTL) for important traits of crops with molecular markers and marker-assisted selection (MAS) has been used widely in breeding programmes. Marker-assisted selection is a faster and more accurate way to breed, which can be based on genotype rather than on phenotype only. Thus, MAS could improve the efficiency of traditional crop breeding. To date, QTLs associated with lutein content have been reported in only a few crops. Abbo et al. (Reference Abbo, Molina, Jungmann, Grusak, Berkovitch, Reifen, Kahl, Winter and Reifen2005) analysed lutein content QTLs of chickpeas through an F 2 population from a cross between an Israeli cultivar and a wild Cicer reticulatum (Ladiz), and the results suggested that one QTL was identified in linkage group (LG) 8B. Wong et al. (Reference Wong, Lambert, Wurtzel and Rocheford2004) constructed two sets of segregating populations (a set of an F 2 : 3 population derived from ‘W64a’ × ‘A632’ and their testcross progeny with ‘AE335’) to detect lutein content QTLs in maize, in which five and three QTLs in the F 2 : 3 and testcross populations were obtained, respectively. Many QTLs have been identified (http://soybase.org/) for soybean seed quality traits such as fatty acid, vitamin E and isoflavones. However, up to 2016, there have been fewer reports of QTLs underlying lutein content in soybean seeds.
The objective of the present study was to identify QTLs association with lutein content in soybean seeds in the recombinant inbred line (RIL) population from ‘Dongnong 46’ × ‘L-100’ in ten environments (Harbin in 2012, 2013, 2014 and 2015; Hulan in 2013, 2014 and 2015; and Acheng in 2013, 2014 and 2015) using simple sequence repeat (SSR) markers.
MATERIALS AND METHODS
Plant materials
Ten F 1 plants from ‘Dongnong46’ (developed by Northeast Agricultural University, Harbin, China) × ‘L-100’ (a semi-wild line in north-eastern China) were self-fertilized to produce 129 F 2 lines. These F 2 lines were self-pollinated and each line was advanced up to the F 5 and F 8 generations by single seed descent. The genetic material used in the present study consisted of 129 F 2-derived F 5–8 (F 2 : 5–8) RIL. ‘L-100’ contained high lutein content (23·96 µg/g). ‘Dongnong 46’ had relatively lower lutein content (13·10 µg/g).
Field experiments
Field trials were conducted at Harbin (44·05°N, 125·42°E, 127·95 m asl), in north-east China in 2012, 2013, 2014 and 2015; at Hulan (46·04°N, 126·73°E, 128·44 m asl) in 2013, 2014 and 2015; and at Acheng (45·33°N, 127·00°E, 130·12 m asl) in 2013, 2014 and 2015. All locations were characterized by fine-mesic chernozem soil. Plant material was grown in 3 m long rows spaced 65 cm apart and with a space of 6 cm between plants. A total of three replicates were laid out using a randomized complete block design. Each line in each plot contained 20 plants as a seed source that was used for subsequent lutein content measurements.
Lutein extraction and high-performance liquid chromatography analysis
Lutein content was determined by high-performance liquid chromatography (HPLC) as described by Lee et al. (Reference Lee, Shannon, So, Sleper, Nelson, Lee and Choung2009). One gram of soybean flour was used for extraction with 10 ml cold 100% acetone in a 15 ml cap test tube, after which the samples were slowly vortexed at 40 °C for 30 min. After extraction, the suspension was centrifuged at 4000 g for 10 min, the supernatant thoroughly filtered through Whatman 2, filter paper (Maidstone, UK) and kept in a 1·5 ml brown vial. Then 20 µl of this supernatant was used to determine the lutein content using an Agilent™ 1200 series HPLC system (Dionex™ ASI-100, Milford, Massachusetts, USA) equipped with a photo diode array detector operating at 430 nm. Separations were performed on a YMC ODS AM 303 column (Waters, Milford, Massachusetts, USA) protected with a Nova-Pak™ C18 guard insert column. The following conditions for HPLC were employed: the mobile phases were composed of solvent A (75% (v/v) methanol) and solvent B (100% ethyl acetate); the solvent gradient of separation was 0 min 70% A, 15 min 10% A, 20 min 70% A and 25 min 70% A; the solvent flow rate was 1·0 ml/min; the temperature of the column was kept at 30·0 °C. Quantification of the lutein was calculated using the external standard method (Lee et al. Reference Lee, Shannon, So, Sleper, Nelson, Lee and Choung2009).
Simple sequence repeat analyses
Genomic DNA of the RILs was isolated from freeze-dried leaf tissue according to the cetyl trimethylammonium bromide method described by Han et al. (Reference Han, Teng, Yu, Poysa, Anderson, Qiu, Lightfoot and Li2008). A total of 727 SSR markers evenly covering all 20 chromosomes (LGs) of soybean were selected to conduct SSR analysis. The polymerase chain reaction (PCR), conducted according to a method previously described by Han et al. (Reference Han, Teng, Yu, Poysa, Anderson, Qiu, Lightfoot and Li2008) with minor modifications, contained 2 µl 10 × PCR buffer, 1·5 µl MgCl2 (25 mM), 0·3 µl deoxynucleotide mixtures (10 mM), 0·2 µl Taq polymerase enzyme (10 units/ul), 2 µl SSR primer (2 uM), 2 µl genomic DNA (50 ng) and 12 µl of ddH20 water for a total volume of 20 µl. The temperature application protocol followed was 2 min at 94 °C, followed by 35 cycles of 30 s at 94 °C, 30 s at 47 °C, 30 s at 72 °C, then 5 min at 72 °C. After the PCR reaction, the PCR products were kept at 4 °C. Polymorphism was detected by electrophoresis on a 6% (w/v) denatured polyacrylamide gel for 1 h at 100 V followed by rapid silver straining (Han et al. Reference Han, Teng, Yu, Poysa, Anderson, Qiu, Lightfoot and Li2008) for visualization.
Linkage analysis
Linkage between the SSR markers was determined through Mapmaker 3·0b (Lander et al. Reference Lander, Green, Abrahamson, Barlow, Daly, Lincoln and Newburg1987). The commands, including ‘group’, ‘map’, ‘sequence’, ‘lod table’, ‘try’ and ‘compare’, were used for constructing the LGs. The error detection ratio was set at 1%. The Haldane mapping function was used with a minimum log of odd (LOD) score of 3·0 and a maximum distance of 50 cM. The Kosambi mapping function was used to calculate genetic distances with a minimum LOD score of 3·0 and a maximum distance of 50 cM, and a genetic map was constructed with MapChart (Voorrips Reference Voorrips2002).
Data analysis
Broad-sense heritability of lutein content in soybean seeds was calculated as h 2 = h 2 g /(h 2 g + h 2 e /n), where h 2 g and h 2 e were the estimates of genetic and residual variance, respectively, derived from the expected mean squares of the variance where n was the number of replications (Blum et al. Reference Blum, Klueva and Nguyen2001). Quantitative trait loci were identified using single-factor analysis of variance (PROC. GLM. SAS) as described by Primomo et al. (Reference Primomo, Poysa, Ablett, Jackson, Gijzen and Rajcan2005), based on the lutein content of RIL in each tested environment. Genotype and trait biplot software 3·4·47 (Yan Reference Yan2001) was used to evaluate the stability of seven QTLs over the ten tested environments based on principal component analysis.
RESULTS
Phenotypic analysis of lutein content
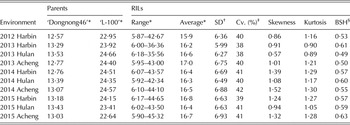
Lutein content in soybean seeds was measured in the RIL population grown in the ten different environments, including Harbin in 2012, 2013, 2014 and 2015; Hulan in 2013, 2014 and 2015; and Acheng in 2013, 2014 and 2015. The mean values, standard deviations, coefficients of variation and values of the parents and RIL population are shown in Table 1. ‘L-100’, varying between 22·64 and 24·57 µg/g, with an average content of 23·96 µg/g, demonstrated significantly higher lutein content than that of ‘Dongong 46’, which varied from 12·57 to 13·43 µg/g, with an average of 13·10 µg/g across the ten environments. A total of 129 RILs ranged from approximately 6–45 µg/g across the ten environments, the average content of which varied from 15·92 to 16·95 µg/g across the tested environments. The phenotypic variation ranges of this population in 2012, 2014 and 2015 were wider than that in 2013 (Table 1). The range of coefficient of variation of the RIL population was 0·38–0·42, which suggested that the lutein content of this population was relatively stable among the ten tested environments (Table 1). The finding that transgressive segregation of the RIL exceeded the lutein content of both parents was observed among the different environments, and the lutein content of a few RILs was shown to be equal or greater than that of ‘L-100’. The value of the broad-sense heritability for lutein content in the mapping population was relatively higher (from 0·49 to 0·63), which indicated that the lutein content in soybean seeds was a highly heritable trait. Shapiro–Wilk tests were used to analyse the frequency distributions of lutein content in this mapping population (designated as W and P values). The result showed that W and P values were 0·86 and 0·4150, respectively. This result showed that lutein content of this mapping population fitted the normal distribution. The distribution of lutein contents of the RIL population exhibited continuous variation and an approximately normal distribution (skewness and kurtosis values in most environment were <1·0), indicating that this trait is quantitative and controlled by multiple genes (Table 1).
Range, average, standard deviation, coefficient of variation, skewness and kurtosis for lutein contents of recombinant inbred lines (RILs) in the ten tested environments of north-east China

* μg/g.
† Standard deviation.
‡ Coefficient of variation.
§ Broad-sense heritability.
Linkage analysis
A total of 727 SSR markers were used to screen for polymorphisms between the two parents (‘Dongnong 46’ and ‘L-100’), 260 of which were polymorphic between them. Of these SSR markers, 213 SSR markers, located on 18 chromosomes (or LG, not included Chr. 2 (D1b) and Chr.10 (LG O)) defined by Cregan et al. (Reference Cregan, Jarvik, Bush, Shoemaker, Lark, Kahler, Kaya, VanToai, Lohnes, Chung and Specht1999), Song et al. (Reference Song, Marek, Shoemaker, Lark, Concibido, Delannay, Specht and Cregan2004) and Hyten et al. (Reference Hyten, Choi, Song, Specht, Carter, Shoemaker, Hwang, Matukumalli and Cregan2010), were scorable and polymorphic among the RILs. They were used to construct a molecular genetic LG. The map that was developed encompassed approximately 3623·39 cM, with an average distance of 17·01 cM between markers (data not shown).
The longest and shortest distance in this map is 510·24 cM (Chr.5 (LG A1)) and 31·70 cM (Chr.14 (LG B2)), respectively, which included 47 and 3 SSR markers, respectively. Chr.5 (LG A1) and Chr.14 (LG B2) also had the most and least SSR markers, respectively.
Quantitative trait loci analyses based on the tested environments
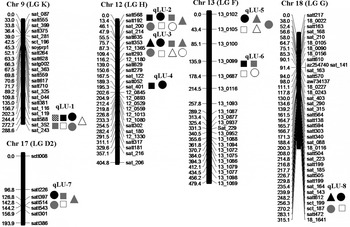
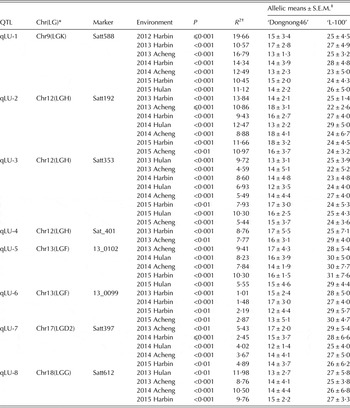
Quantitative trait loci associated with lutein content of soybean seed were identified (Table 2 and Fig. 1). Of these, eight QTLs were mapped onto Chr 9 (LG K), Chr 12 (LG H), Chr 12 (LG H), Chr 12 (LG H), Chr 13 (LG F), Chr 13 (LG F), Chr 17 (LG D2) and Chr 18 (LG G), respectively. Seven of these, including qLU-1 (located near Satt588 of Chr 9 (LG K) in seven tested environments), qLU-2 (located near Satt192 of Chr 12 (LG H) in seven tested environments), qLU-3 (located near Satt353 of Chr 12 (LG H) in eight tested environments), qLU-5 (located near 13_0102 of Chr 13 (LG F) in five tested environments), qLU-6 (located near 13_0099 of Chr 13 (LG F) in four tested environments), qLU-7 (located near Satt397 of Chr 17(LG D2) in five tested environments) and qLU-8 (located near Satt612 of Chr 18(LG G) in four tested environments), could be detected in at least four environments, while qLU-4 was identified only in two environments (Acheng 2013 and Harbin 2013). qLU-1 showed the greatest phenotypic variation as follows: 19·66% at Harbin in 2012, 10·57% at Harbin in 2013, 16·79% at Acheng in 2013, 14·34% at Harbin in 2014, 12·49% at Acheng in 2014, 10·45% at Harbin in 2015 and 11·12% at Hulan in 2015. qLU-6 (1·01% at Harbin in 2013, 1·48% at Harbin in 2014, 2·19% at Harbin in 2015, at Acheng in 2015) and qLU-7 (5·43% at Acheng in 2013, 2·45% at Harbin in 2014, 4·02% at Hulan in 2014, 3·67% at Acheng in 2014, 4·89% at Harbin in 2015) explained a relatively small amount of the observed phenotypic variation. The other five QTLs were able to explain 5–10% of the observed phenotypic variation in most tested environments.
Genomic locations of identified quantitative trait loci (QTL) affecting lutein content. The map distances in cMs are shown on the left. The QTL locations are indicated on the right.  : Harbin 2012;
 : Harbin 2013;
 : Hulan 2013;
 : Acheng 2013;
 : Harbin 2014;
 : Hulan 2014;
 : Acheng 2014;
 : Harbin 2015;
 : Hulan 2015;
 : Acheng 2015.

Markers associated with lutein content in soybean seeds in the ten tested environments of north-east China

* R 2 is the proportion of the phenotypic data explained by the marker locus.
† SEM (standard error mean): SD√N, where N is the number of each allele.
‡ Chr(LG): chromosome (linkage group).
The relationship between the number of quantitative trait loci and lutein content
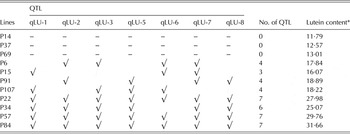
Quantitative trait loci that were identified in at least four tested environments were selected to analyse the relationship between the pyramid effect of QTLs and lutein content across the RIL population. The lutein content of RILs with a maximum accumulation of QTLs for lutein content from ‘L-100’ was higher (ranging from 25·07 to 31·66 µg/g). In contrast, the lutein content of RILs with no QTLs for lutein content was very low (ranging from 11·79 to 13·01 µg/g). The RILs with 3–4 QTLs showed moderate lutein content (Table 3). Lutein content of the RIL significantly correlated with the number of QTL.
Effects of pyramids of lutein content quantitative trait loci (QTL) with beneficial alleles derived from ‘L-100’

* Mean of the ten tested environments.
Stability evaluation of quantitative trait loci associated with lutein content across the tested environments
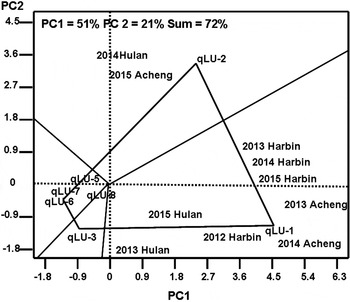
The performance of the QTL was evaluated in each environment. When QTL qLU-1, qLU-2, qLU-6 and qLU-3 were set as the corner QTL for the ten tested environments, seven (Harbin in 2012, 2013, 2014 and 2015; Hulan in 2013; and Acheng in 2013 and 2014) fell within the sector in which the QTL qLU-1 was the best QTL for these seven tested environments (Fig. 2). qLU-2 was the best QTL for two tested environments (Hulan 2014 and Acheng 2015). The other QTLs were not the best for any tested environment.
The relatedness analysis of quantitative trait loci (QTL) and the tested environments using genotype and trait (GT) biplot software. PC1: first principal component; PC2: second principal component. Different tested environment was represented by year and location: for example, ‘at Harbin location in 2012’ was represented by 2012 Harbin.

DISCUSSION
Lutein is a major carotenoid in soybean seeds and has been verified to be beneficial for eye, heart and skin health in humans (Dwyer et al. Reference Dwyer, Navab, Dwyer, Hassan, Sun, Shircore, Hama-Levy, Hough, Wang, Drake, Merz and Fogelman2001; Landurm & Bone Reference Landurm and Bone2001; Heinrich et al. Reference Heinrich, Gartner, Wiebusch, Eichler, Sies, Tronnier and Stahl2003). Thus, selecting soybean lines with higher lutein content is the primary breeding goal of some soybean breeding programmes. The results of some studies indicated that the lutein content of soybean cultivars was stable across environments (Kanamaru et al. Reference Kanamaru, Wang, Abe, Yamada and Kitamura2006; Lee et al. Reference Lee, Shannon, So, Sleper, Nelson, Lee and Choung2009), but other studies reported that the lutein content was significantly affected by environment, including the seeding date and certain forms of management including seeding rate, row spacing and fertilizer (Seguin et al. Reference Seguin, Tremblay, Pageau, Liu and Turcotte2011), and by genotype × environment interactions (Lee et al. Reference Lee, Shannon, So, Sleper, Nelson, Lee and Choung2009). In a previous study, Han et al. (Reference Han, Teng, Yu, Poysa, Anderson, Qiu, Lightfoot and Li2008) showed that ‘L-100’, one novel wild line from north-eastern China, had high lutein content. Though the lutein content of ‘L-100’ fluctuated slightly among the ten tested environments in the present study, a multienvironment examination still showed that the lutein content of ‘L-100’ was stable and only weakly affected by environment and genotype × environment interaction (varying between 22·64 and 24·57 µg/g, with an average content of 23·96 µg/g). The results of the present study were similar to those of Kanamaru et al. (Reference Kanamaru, Wang, Abe, Yamada and Kitamura2006) and Lee et al. (Reference Lee, Shannon, So, Sleper, Nelson, Lee and Choung2009). The variation range of the broad-sense heritability of the RIL population was 0·49–0·63; thus, the lutein content in soybean seeds is a highly heritable trait. This result was similar to the results described by Wang et al. (Reference Wang, Kanamaru, Li, Abe, Yamada and Kitamura2007) using the population from a cross between ‘Keszthelyi A.S’ and wild soybean strain ‘B09092’. In the mapping population, it was observed that the transgressive segregation of the RIL exceeded the lutein content of ‘L-100’, with the lutein content of a few lines found to be greater than that of ‘L-100’ among the ten tested environments (data not shown). The lutein content of these lines among the tested environments was not significantly different via the F test (data not shown), which implies that it is possible to select and breed lines with a high lutein content. However, the lutein content in soybean is difficult to directly evaluate phenotypically; thus, increasing the indirect selection of the genotype by MAS may lead to an improved selection gain.
A total of 213 SSR markers were used for lutein content QTL analysis, out of which eight QTLs located on five chromosomes were identified. These QTLs could explain 1·01–19·66% of the phenotypic variation for lutein content in the ten different tested environments. Of these, the variation explained by qLU-6 and qLU-7 were <5% in the diverse environments, but qLU-1 could explain >10% of the observed variation in the different environments. For the other five QTLs, the explained variation range was 5–10% in most tested environments. The lower level of phenotypic variation estimated by these QTLs revealed the quantitative nature of lutein inheritance in soybean seeds, which was also proven by Wang et al. (Reference Wang, Kanamaru, Li, Abe, Yamada and Kitamura2007).
In the present study, qLU-1 (located near Satt588 of Chr9 (LGK)), qLU-2 (located near Satt192 of Chr12 (LGH)) and qLU-3 (located near Satt353 of Chr12 (LGH)) could be identified in more than seven tested environments. The present study is the first report that these QTLs are related to lutein content. Zhang et al. (Reference Zhang, Qiu, Jiang, Liu, Xin, Li, Hu and Chen2012) reported that Satt588 was associated with drought and low-temperature tolerance through the BC2F3 population from a cross between ‘Hongfeng 11’ and ‘Harosoy’, which has a similar genomic region to that of qLU-1 in the present study. Quantitative trait loci qLU-5, qLU-6, qLU-7 and qLU-8 could be detected in more than four tested environments, while qLU-4 could be identified only in two environments. The present results suggested that the interaction between QTL and environment was an important property of lutein content QTL. The interaction analysis between QTL and environment demonstrated that qLU-1 and qLU-2 were the best QTLs for MAS in seven and two tested environments, respectively. Therefore, information gained about the interaction between QTL and environment should be considered if MAS is to be applied to the manipulation of lutein content in soybean seeds.
In the present study, the identified QTLs controlling lutein content and the soybean cultivar ‘L-100’, with high lutein content, would allow the design and implementation of more efficient breeding programmes to develop high-lutein soybean cultivars. As a constituent in soybean seeds, increasing lutein content could effectively improve the value of soybean-derived food. Consumption of soybean-derived food with higher lutein content would enhance soybean use for human health and nutrition.
This study was conducted in the Key Laboratory of Soybean Biology of the Chinese Education Ministry, Soybean Research & Development Center (CARS) and the Key Laboratory of Northeastern Soybean Biology and Breeding/Genetics of the Chinese Agriculture Ministry, and was financially supported by National Key R & D Programme for Crop Breeding (2016YFD0100300), Heilongjiang Provincial Natural Science Foundation (C2015011), the 948 project (2015–2016), the National Supporting Project (2014BAD22B01), the Youth Leading Talent Project of the Ministry of Science and Technology in China (2015RA228), the Chinese National Natural Science Foundation (31471517, 31301339, 31201227; 31671717), the Provincial/National Education Ministry Project (1252G014, 1253-NCET-005, 20122325120012), the ‘Academic Backbone’ Project of Northeast Agricultural University (15XG04) and the ‘Young Talents’ Project of Northeast Agricultural University (14QC27).