

When speech production is severely compromised in children with developmental disabilities, alternative or complementary modes of communication are often implemented in order to support communicative development. Alternative and augmentative communication (AAC) systems may incorporate a variety of strategies and modalities (e.g., gestures, formal sign languages, graphic symbols, and alphabetic representations). For young children who cannot yet read or write, graphic symbols are often chosen to replace or supplement speech. Graphic symbols are particularly useful for children whose motor skills are compromised, thus rendering the use of gestures and signs more limited. The graphic symbols included in a child's AAC system are typically arranged on displays from which the child selects the symbol(s) he or she wishes to use. Selection is often, but not always, accompanied by voice output (for an overview, see Beukelman & Mirenda, Reference Beukelman and Mirenda2005).
Children who require graphic symbol AAC systems while they are in the process of acquiring language face unique challenges that are of considerable theoretical and clinical interest. They experience an input–output asymmetry because they receive speech as their linguistic input (auditory), but must use a different modality, graphic symbols (visual), as their output, in contrast to the typical language-learning situation where children acquire the same language that they hear (or see) being used by mature language users around them. Exploration of the relationship between speech and graphic symbols is needed in order to understand more fully the nature of the challenges facing children who use graphic symbols and to provide effective intervention to promote language development for these children.
In order to use graphic symbol displays (with or without accompanying voice output) for communication, one must learn not only individual symbols, but also how to combine them into sequences forming utterances. The literature suggests that learning to construct such sequences is not straightforward and may pose challenges for children (e.g., Sutton & Morford, Reference Sutton and Morford1998). Some grammatical elements tend to be omitted from utterances constructed with graphic symbols, resulting in telegraphic utterances (Millikin, Reference Millikin, Glennen and DeCoste1997), and the order of symbols may differ from what would be expected strictly based on the spoken language word order (Soto, Reference Soto1999). For example, Sutton and Morford (Reference Sutton and Morford1998) asked children without disabilities in kindergarten to Grade 6 (N = 32) to produce simple utterances (subject–verb–object [SVO]) to describe actions seen on videotape. After viewing the videoclip, the children constructed an utterance in the graphic modality with Picture Communication Symbols (PCS; Johnson, Reference Johnson1994) and then produced it in the oral modality, to confirm mastery of the oral SVO structure. Most of the children constructed graphic symbol sequences that followed an SVO structure. However, some children, especially in the youngest age group, did not respect this structure and constructed utterances consisting of a single verb (V), suggesting that the action was an important element to be communicated. Other children reduced their utterances to two elements, omitting the subject. Among the sequences not following the target order, the most frequent symbol ordering was the object followed by the verb (OV instead of VO) with or without the subject. Other types of inversions were also present, for example, VSO.
In another study, 3- and 4-year-old francophone children (N = 30) without disabilities were asked to transpose into graphic symbols simple SVO sentences presented orally and accompanied by a photograph (Sutton, Trudeau, Morford, Rios, & Poirier, Reference Sutton, Trudeau, Morford, Rios and Poirier2010). Half of the graphic symbol sequences constructed by the children were incomplete; the element the most frequently omitted was the verb (V), although objects (O), and to a lesser extent, subjects (S) were also omitted. Only one child consistently constructed the expected sequence of symbols corresponding to the SVO structure of the spoken sentence; the other participants constructed various other sequences and were not necessarily consistent in their symbol ordering. Smith (Reference Smith, von Tetzchner and Jensen1996) similarly observed omissions in symbol sequences produced by preschool children without disabilities: they included only one symbol in nearly half of the sequences constructed with PCS, even though their oral syntax was adequate. The explanation offered was that the children may have considered the symbols as global representations instead of individual components that could be integrated in a sequence. Smith (Reference Smith, von Tetzchner and Jensen1996) also found that the order of the symbols in some sequences constructed by preschool children differed from the expected oral syntax structure. These studies all point to difficulty in constructing graphic symbol sequences to convey structures that preschool children could produce orally. They all report omissions and inversions of graphic symbols, although the specific components omitted or inverted did vary.
In a study involving older participants, francophone school-aged children, teenagers, and adults without disabilities transposed into sequences of graphic symbols various utterances that were presented orally and accompanied by photographs (Trudeau, Sutton, Dagenais, de Broeck, & Morford, Reference Trudeau, Sutton, Dagenais, de Broeck and Morford2007). The participants' constructions for simple utterances (SVO) followed the expected sequence. The complex utterances, which were subject relatives (e.g., “Le clown qui pousse la fille porte un foulard.” [The clown who pushes the girl wears a scarf]) and object relatives (e.g., “Le clown pousse la fille qui porte un foulard.” [The clown pushes the girl who wears a scarf]), did not always respect the order of the oral model. However, in this case, following the oral sequence would have caused ambiguity in the corresponding graphic symbol utterances because relative pronouns were not included on the symbol display (i.e.,CLOWN POUSSE FILLE FOULARD Footnote 1 [clown push girl scarf]). Results were interpreted as showing a natural tendency to follow spoken word order, that could be suppressed by some participants (most teens and adults), but not others (particularly among the school-aged children) when the context created the need to contrast between two structures that may otherwise be identical. Nakamura, Newell, Alm, and Waller (Reference Nakamura, Newell, Alm and Waller1998) found that Japanese-speaking adults without disabilities omitted symbols in a different type of task (answering questions about a story) and suggested that absence of certain elements from the display used in the task may have influenced the sequences constructed by their participants. In fact, the participants using displays that did include symbols representing typical Japanese morphemes constructed sequences following the Japanese syntax (SOV), whereas those using symbol displays without the typical Japanese morphemes followed the English syntax (SVO) instead. Taken together, these two studies suggest that construction of graphic symbol sequences can be affected by the nature of the task and the actual symbols made available to the participants.
Omission of symbols and word order modifications have also been observed in graphic symbol utterances constructed by individuals with disabilities who use AAC for daily communication (Soto, Reference Soto1999). In a case study, a child with cerebral palsy communicated with two- or three-symbol utterances that were telegraphic (Bruno, Reference Bruno1989). In another study, following an 18-month intervention targeting communication with Blissymbols, children with cerebral palsy and very limited expressive language communicated mostly through one-symbol utterances (Udwin & Yule, Reference Udwin and Yule1990). Romski and Sevcik (Reference Romski and Sevcik1996) argued that young communicators who are unable to use speech and are learning AAC construct their first symbol combinations in a similar way to young children learning speech: with many symbol omissions, keeping only those expressing key semantic relations. In another study, children presenting moderate to severe intellectual impairment and who communicated using graphic symbols maintained a fixed pattern in their symbol utterances (Wilkinson, Romski, & Sevcik, Reference Wilkinson, Romski and Sevcik1994), although this pattern varied among the children, and the utterances constructed did not necessarily follow the oral structure. Therefore, the few studies conducted thus far point to a tendency by young participants who use AAC to construct telegraphic symbol utterances, as well as important intersubject variability in constructing such sequences. A study where adults with disabilities who use AAC systems were asked to construct graphic symbol sequences for complex utterances (relative clause sentences) presented orally and illustrated in photographs confirmed this variability (Sutton, Morford, & Gallagher, Reference Sutton, Morford and Gallagher2004), as no uniform pattern was observed in the participants' responses. More recently, Trudeau et al. (2010) asked participants with disabilities who communicate using graphic symbol AAC systems to construct and to interpret simple (three-symbol) and complex (four-symbol) utterances. The majority of the participant used stable response patterns, although there were differences across structures (68.2%–77.3% and 59.1%–77.3% for construction and interpretation, respectively). Greater stability was observed for simple structures.
In order to explore the relationship between speech and graphic symbols, studies may be carried out with participants without disabilities. This research strategy permits evaluation of performance under “ideal” conditions (i.e., when participants have all skills that are typically available under normal circumstances) and any difficulties related to motor, perceptual, or other limitations that may affect performance in children with disabilities can be ruled out. The current study uses this research strategy to extend the literature concerning construction of graphic symbol utterances in three ways. First, the participants are children in the age range when performance on graphic symbol construction tasks goes from very poor (i.e., 3–4 years; Sutton & et al., Reference Sutton, Trudeau, Morford, Rios and Poirier2010) to essentially ceiling (i.e., 7–8 years; Trudeau & et al., Reference Trudeau, Sutton, Dagenais, de Broeck and Morford2007) for simple (i.e., single-clause) structures. Although it is clear that an increase in correct responding is to be expected during this period, the rate of improvement may differ across the age groups (4–5 and 5–6 years).
Second, the study considers the impact of training on the ability to construct graphic symbol sequences. In studies conducted thus far with children without disabilities, the experimental task is typically administered once, thus offering no possibility of learning (beyond initial familiarization with the task) for the participants who fail the task initially. However, in intervention for children with disabilities who are learning to use graphic symbols for communication, children would typically receive additional instruction if needed. In the current study, therefore, systematic training was provided to children who were not successful on the experimental task on initial testing. This provided every opportunity for the children to learn how to produce the target graphic symbol sequences.
Third, the study includes measures of maintenance after a 1-month interval during which no systematic use of graphic symbols was offered. For the most part, studies of use of sequences of graphic symbols have examined participants' performance on tasks at one point in time. Whether the skills demonstrated would be maintained, that is, whether the same level of performance would be observed at a later point in time, has received little attention in the literature. When children with disabilities learn to use graphic symbols for communication, there is an assumption that skills learned will be maintained over time. Investigation of maintenance of performance with sequences of graphic symbols and over a substantial period of time (e.g., 1 month) would speak to the strength of the initial learning.
Fourth, the study includes a systematic analysis of error responses. A fine-grained error analysis that goes beyond adherence of the response to the target may shed light on how the children tackle the task when they do not respond correctly. A greater understanding of the nature of errors may provide insight into steps toward correct performance that would be useful in determining intervention targets for children with disabilities who are learning to use graphic symbols for communication.
The purpose of the current study, therefore, was to explore how preschool-aged children transpose onto a graphic symbol display sentences that are presented orally. The following research questions were addressed:
1. Can children without disabilities, aged 4 to 6 years, construct graphic symbol sequences to represent simple sentences presented orally?
2. If not, can training improve their performance?
3. Is the ability demonstrated by the children maintained over a 1-month period with no further exposure to the symbols or the task?
4. What types of errors are observed?
5. For each of these questions, what is the developmental pattern of performance across the age range 4 to 6 years?
The task used in the study resembles that proposed in several earlier studies of construction of graphicsymbol sequences (Sutton et al., Reference Sutton, Trudeau, Morford, Rios and Poirier2010; Trudeau & et al., Reference Trudeau, Sutton, Dagenais, de Broeck and Morford2007), except that two types of symbols were used in the tasks: Blissymbols (Hehner, Reference Hehner1980), and PCS (Johnson, Reference Johnson1994). The literature suggests that PCS are more transparent (i.e., the meaning is guessable from the symbol) than Blissymbols (Bloomberg, Karlan, & Lloyd, Reference Bloomberg, Karlan and Lloyd1990; Huer, Reference Huer2000; Mizuko, Reference Mizuko1987) and that Blissymbols are more generally among the least transparent symbols (Ecklund & Reichle, Reference Ecklund and Reichle1987; Musselwhite & Ruscello, Reference Musselwhite and Ruscello1984). Many authors also mentioned that more transparent symbols were learned more easily and faster than were less transparent symbols (Burroughs, Albritton, Eaton, & Montague, Reference Burroughs, Albritton, Eaton and Montague1990; Ecklund & Reichle, Reference Ecklund and Reichle1987; Hurlbut, Iwata, & Green, Reference Hurlbut, Iwata and Green1982; Luftig & Bersani, Reference Luftig and Bersani1985; Mizuko, Reference Mizuko1987). In addition, maintenance of more transparent symbols would be expected to be stronger (Ecklund & Reichle, Reference Ecklund and Reichle1987; Hurlbut et al., Reference Hurlbut, Iwata and Green1982) and their spontaneous use would be more frequent when both symbol types are available simultaneously (Hurlbut et al., Reference Hurlbut, Iwata and Green1982). Thus, the use of these two types of symbols controls for any potential effect of degree of transparency.
METHODOLOGY
Participants
The participants were 74 French-speaking children aged 4 years (n = 26), 5 years (n = 25), or 6 years (n = 23), with no disabilities. They were recruited through advertisements posted in public places that children and their parents were likely to visit. Children with known language problems (presence of language delay or language disorder; receiving services of a speech–language pathologist; or parental concerns about language abilities) were not included. Parental consent was obtained at the first visit. Participants' receptive vocabulary was assessed through the use of the Échelle de Vocabulaire en Images (Dunn, Thériault-Whalen, & Dunn, Reference Dunn, Thériault-Whalen and Dunn1993) and a standard score of at least 78 (i.e., no more than 1.5 standard deviations below the mean) was required.
Materials
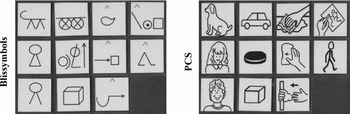
Each child was exposed to one type of symbols, Blissymbols or PCS, chosen at random. A display containing the symbols necessary for the testing tasks was created (see Figure 1). Symbols were placed in four columns in the following order: animate nouns (DOG,Footnote 1GIRL, BOY), inanimate nouns (CAR, COOKIE, BLOCK), transitive verbs (three of the following: WASH, PUSH, TAKE, TICKLE, THROW) and intransitive verbs (two the following: DRAW, WALK, SLEEP).
Examples of the symbol displays used with (left) Blissymbols and (right) Picture Communication Symbols.

A list of simple sentences (SVO) was developed combining three components chosen at random from among the available symbols: a subject (animate noun), a transitive verb and an object (animate or inanimate noun). A similar list was developed for shorter simple sentences (SV) combining two components chosen at random: a subject (animate or inanimate noun) and an intransitive verb.
A puppet was used to make the task more relevant to children. The children were told that the puppet could not hear when she had earphones on, and so they needed to use the graphic symbols in order to convey messages to her.
Procedures
Each child was tested individually in a quiet room. Two research assistants were present: one carried out the testing with the child, whereas the second recorded the child's responses. First, the meaning of each symbol was taught to the child using methods appropriate for the type of symbols. The strategies used to teach each graphic symbols influence initial learning and generalization (Fuller, Reference Fuller1997; Schlosser & Lloyd, Reference Schlosser and Lloyd1993). For the Blissymbols, graphic components were explained (e.g., for the DOG Blissymbol, the examiner explained that a dog is “an animal with four legs and a tail,” these elements being shown simultaneously on the graphic symbol). This type of procedure was proposed in earlier studies (Hooper & Lloyd, Reference Hooper and Lloyd1986; Shepherd & Haaf, Reference Shepherd and Haaf1995; Silverman, McNaughton, & Kates, Reference Silverman, McNaughton and Kates1978). For PCS, the noun symbols required no additional description, as they were all realistic representations of concrete concepts. The verb symbols were explained briefly by pointing out some key elements (e.g., for the PUSH symbol, attention was drawn to the hand pushing on the object, and the arrow implying motion). Corrective feedback and review of the symbols was provided (Raghavendra & Fristoe, Reference Raghavendra and Fristoe1995). The child was expected to remember the symbols in order to point to them and name them correctly. A symbol was considered learned after three consecutive correct identifications. When a child failed to learn a particular symbol, an alternate symbol was introduced, and experimental stimuli were adjusted to reflect the child's symbol set. Seven children had difficulty learning the TAKE symbol, and either the symbol TICKLE or THROW was proposed as replacement for these children.
The experimental task reported in this study was part of a larger research protocol that involved several tasks of increasing complexity using graphic symbols. Prior to participating in this experimental task the participants had therefore already had extensive exposure to the symbols and experience in manipulating them.
The experimental task itself began with a familiarization phase that included a demonstration by the puppet. The experimenter read a sentence out loud, and the puppet selected (i.e., pointed to) the appropriate symbols on the display, in the right order, to construct her response. The child was then asked to produce the same sequence using the display, to ensure that he or she understood what was expected. Following two items with the model by the puppet, two additional items were presented for the child to respond on their own. No corrective feedback was provided during this step. Once the child responded to the oral model by pointing to items on the display, the familiarization was complete. The items used in the familiarization did not overlap with the ones used in the actual experimental task although they were composed of the same basic vocabulary.
The testing block of the experimental task contained eight sentences. The sentences were presented one at a time, and the child could take as long as needed to construct his or her sequence of graphic symbols. If the child constructed at least six correct sequences, the task was considered passed. If the child constructed less than six correct sequences within the eight trials, a block of training was provided using five new items and providing corrective feedback. Following this training block, a second set of eight test sentences was presented. If the child again constructed fewer than six correct sequences, but obtained a score of 5/8 or showed an improvement of at least two points from the initial score, a second block of training was offered. This was followed by a third testing block of eight sentences.
One month after the experimental task, another testing session was conducted with the children who passed the experimental task (whether on the first presentation or after one or two blocks of training) to evaluate maintenance.
Coding and reliability
A response was judged correct if it contained all the relevant graphic symbols, selected in the correct sequence (i.e., in the order conveyed orally). For instance, in response to “The girl washes the car,” the child had to point to GIRL, WASH, CAR in that order to be credited with a correct response. Self-corrections were permitted; if the child changed his response, the last sequence constructed was the one coded.
For each child, a score was calculated for the first testing block (number of correct sequences, out of eight): this was called the initial score. A second score, called the optimal score, was also given: this was the highest number of correct responses on the first, second, or third testing block (when appropriate). Finally, the number of correct responses on the maintenance testing was also calculated.
Procedural reliability and intercoder agreement were evaluated. The task was administered 143 times (to 74 children at initial testing, and to 69 children at maintenance). Eleven task administrations were selected at random to check for adherence to protocol. The procedures implemented were compared to a detailed checklist of all steps included in the protocol. A point was given for each criterion met. The score obtained was divided by the number of targeted steps, and multiplied by 100. For the 11 administrations of the task that were checked,2 reliability was 98.6% for one administration and 100% for the other 10.
In the same way, intercoder agreement was assessed for nine randomly selected participants who completed the task (different from those used for protocol fidelity). A percentage was obtained by comparing the responses recorded by the research assistant during the testing session and the responses recorded by a second assistant looking at the videotapes. When discrepancies were found, errors in notation were corrected. If the two recorded responses still differed, the response recorded during the testing session was retained. At initial testing, agreement was 87.5% (i.e., one disagreement out of the eight items) for one child and 100% for the other eight children. For maintenance, agreement was 100% for all children.
Data analysis
Preliminary analyses were conducted to evaluate the potential effect of symbol type (Blissymbols or PCS). Performance on the task and at maintenance were compared based on mean scores, number of children in each group passing (i.e., obtained a score of 6 or more out of 8) at each testing time, and the effect of the training provided during the experimental task. Age-related differences were explored by comparing mean scores and number of children passing the task in each age group. Nonparametric statistics were used for comparisons of means because of the nonnormal distribution of the data. Chi-square tests were used for comparisons of distributions.
Error responses were analyzed based on types of errors that were observed in the data related to individual elements: omissions, substitutions, and additions; and inversions of pairs of elements relative to the target sequence (SV or SVO): S–V, S–O, V–O. An inversion was counted for each pair of elements (e.g., S–V inversion as in “VSO,” S–O inversion as in “OVS, V–O inversion as in “SOV,” S–VO inversion as in “VOS,” or SV–O inversion as in “OSV”). An omission was counted when an element of the stimulus sentence was not represented by a graphic symbol (e.g., “SO” instead of “SVO”). A substitution occurred when a symbol was used that did not correspond to a word mentioned in the stimulus sentence and replaced a symbol of the same syntactic category (e.g., a verb replacing another verb). An addition occurred when a second symbol was added in a same syntactic category (e.g., “SVVO” instead of “SVO”). Errors that could not be coded using these categories (e.g., construction of a sequence too far from the target) were classified as “other.” When more than one error type applied to a given sequence (e.g., verb omission and S–O inversion), each error was considered separately. Chi-square tests were used for comparisons of distributions. For all statistical analyses, the significance level was set at 0.05.
RESULTS
Most of the children (67/74) learned the target symbols without difficulty, regardless of the type of symbol used. Out of the seven children having difficulties learning the TAKE symbol (noted above), three used PCS, and four used Blissymbols. There was no effect of type of symbol on the initial scores, M = 6.53 and 6.74 for children using Blissymbols and PCS respectively, Mann–Whitney U (1) = 711.500, p = .604; on the optimal score on the task, M = 6.85 and 7.32 for children using Blissymbols and PCS, respectively, Mann–Whitney U (1) = 637.000, p = .179; or at maintenance, M = 7.06 and 7.25 for children using Blissymbols and PCS, respectively, Mann–Whitney U (1) = 574.000, p = .306. Given the lack of effect of symbol type on the performance of the participants, all further analyses were conducted collapsing data across symbol types.
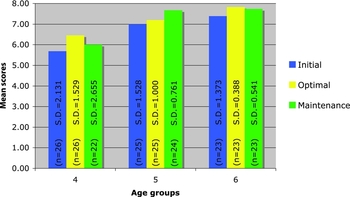
For scores on initial testing, a significant effect of age was observed, M = 5.69, 7.00, and 7.39, for 4-, 5-, and 6-year-olds, respectively, Kruskal–Wallis χ2 (2) = 15.729, p < .001 (see Figure 2). Further analysis revealed that this effect was primarily due to the differences between the 4-year-olds and the other groups, Mann–Whitney U (1) = 187.000, p = .007 for 4- versus 5-year-olds; Mann–Whitney U (1) = 131.500, p < .001 for 4- versus 6-year-olds, although it approached significance for the 5- versus 6-year-olds comparison, Mann–Whitney U (1) = 209.000, p = .061.
Mean scores in the experimental task by age group and time of testing (74 children for initial and optimal scores, 69 children for maintenance). [A color version of this figure can be viewed online at journal.cambridge.org/aps]

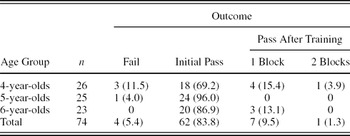
The age effect was also reflected in the outcome of the task (see Table 1). Descriptive analysis of the data suggests that 4-year-old children were more likely to fail or to need training than were older children. Statistical analysis confirmed that the distribution of outcomes according to age was not random, Fisher likelihood ratio: χ2 (6) = 14.571, p = .024.
Number (%) of children achieving each outcome on the task by age group

An effect of training was observed: the mean optimal score (7.08) was significantly higher than the mean initial score (6.63; Wilcoxon Z = −3.084, p = .002; see Figure 2). Further analysis revealed that this effect was present only for the 4-year-olds (Wilcoxon Z = −2.388, p = .017): for the 5- and 6-year-olds, the initial scores were almost at ceiling, leaving little room for improvement.
The large majority of children (88%, n = 69) passed maintenance testing (i.e., score ≥6; see Figure 3). There was clear effect of age, χ2 (2) = 13.674, p = .001: the percentage passing rose from 68% of the 4-year-olds to 96% and 100% of the 5- and 6- year-olds, respectively.
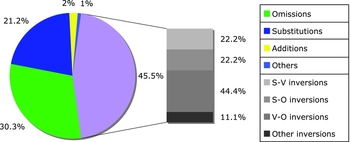
The distribution of errors across types and the distribution of inversions across components inverted. [A color version of this figure can be viewed online at journal.cambridge.org/aps]

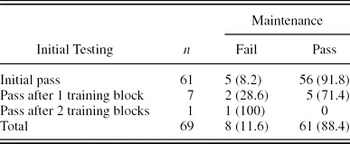
Further analysis of the data was carried out in order to investigate a potential relationship between the initial performance on the task (i.e., whether or not training had been required for the children to succeed), and the outcome at maintenance (see Table 2). The data show that only five of the 61 children who passed the task on the first attempt (i.e., 8.2%) failed the task a month later. Of the eight children who had received training initially, three (i.e., 37.5%) failed the task a month later. These data suggest that children who had received training were more likely to fail the task a month later, which was confirmed by statistical analysis: Fisher likelihood ratio, χ2 (2) = 6.54, p = .036. Age was not a factor in this relationship (all p > .05).
Number (%) of children achieving each outcome on maintenance by initial testing status

Error analysis
Errors were analyzed for the first block of trials of the task (i.e., errors reflect the calculation of the initial score). Approximately half of the participants made errors (36/74); the others obtained initial testing scores of 8/8. Out of the 592 sequences constructed by the group of children (74 participants × eight trials), 95 sequences (16%) contained a total of 99 errors. The number of mistakes exceeds the number of sequences with errors because each error was analyzed separately if more than one were found in a single sequence.
Errors were present in both two- and three-element sequences (6% and 94% for SV and SVO sequences, respectively, n = 99). A chi-square test controlling for the uneven number of items at each sequence length (two SV sequences for six SVO sequences) confirmed that this distribution differs significantly from the distribution of target sequences, χ2 (1) = 18.939, p < .001: errors were more frequent in three-element sequences.
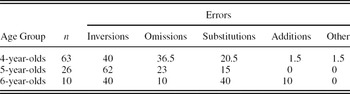
The distribution of errors across error types and across age groups was examined. There were 45 inversions (45.5%, n = 99), 30 omissions (30.3%), 21 substitutions (21.2%), 2 additions (2 %), and only 1 error (1%) that did not fit within these categories (see Figure 3).
Analysis of the distribution of error types across age groups revealed no significant differences: Fisher likelihood ratio, χ2 (8) = 10.372, p = .240 (see Table 3). A secondary analysis also confirmed that the distribution of errors was similar for the two symbol types, Blissymbols and PCS; Fisher likelihood ratio, χ2 (4) = 4.851, p = .303.
Number of errors and percentage of error types across age groups

Errors were then analyzed to identify which elements of the stimulus sentence (i.e., S, V, or O) were involved. Because inversions necessarily implied two or three elements, the total number of elements in error is higher than the number of errors. Out of the 148 incorrect elements, 31 (20.9%) were subjects (S), 72 (48.6%) were verbs (V) and 45 (30.4%) were objects (O). Considering the frequency of the different sequence lengths among the stimuli (SV: 25%; SVO: 75%), a chi-square test controlling for the uneven theoretical distribution of errors (S: 37.5%; V: 37.5%; O: 25%) showed that the observed distribution was not due to chance, χ2 (2) = 17.450, p < .001; subjects (S) were less often in error than were verbs or objects; S versus V: χ2 (1) = 16.320, p < .001; S versus O: χ2 (1) = 11.686, p = .001).
DISCUSSION
In the current study, children aged 4 to 6 years were asked to construct on a symbol display sentences that were presented orally. The main findings are: (a) the 4-year-olds' initial performance was lower than that of the older two groups; (b) training effects were observed, mostly in the youngest group; (c) maintenance was high overall, but somewhat lower for the youngest group; and (d) the distribution of errors was similar across the three groups.
The results confirmed the expectation that older children would demonstrate higher performance than those of the younger children and are consistent with developmental trends in acquisition of individual symbols (Burroughs et al., Reference Burroughs, Albritton, Eaton and Montague1990; Shepherd & Haaf, Reference Shepherd and Haaf1995). Beyond symbol acquisition, though, an age effect was confirmed in the present study for learning to use these symbols in sequences; the performance of 4-year-old children was significantly lower than that of 5- and 6-year-old children, extending the findings of earlier studies with younger (3- to 4-year-old) children (Sutton et al., Reference Sutton, Trudeau, Morford, Rios and Poirier2010) and with older (7- to 8-year-old) children (Trudeau et al., Reference Trudeau, Sutton, Dagenais, de Broeck and Morford2007), and consistent with those of Sutton and Morford (Reference Sutton and Morford1998; 5-year-olds to 11-year-olds). The finding that training was helpful for the 4-year-olds suggests that they were “ready” to learn to construct graphic symbol utterances but some of them could not do so on their own.
The use of graphic symbols in a transposition task was maintained at least 1 month by most of the participants. Retention of this skill goes beyond mere symbol acquisition. The literature concerning maintenance is sparse. Some studies that do take maintenance into consideration mention that (a) teenagers with severe intellectual impairment maintain symbol acquisition at least one day (Hurlbut et al., Reference Hurlbut, Iwata and Green1982) and (b) preschool-aged children maintained the symbols that they had learned for 3 to 6 days (Ecklund & Reichle, Reference Ecklund and Reichle1987). The children who participated in the maintenance testing of the current study had extensive exposure to the symbols and had either demonstrated a high level of performance on initial testing or had received task-specific training. This repeated contact with the same symbols may have served to strengthen learning and thus permitted it to be maintained over a period of a month. This is consistent with the idea that learning is reinforced by symbol revision (Raghavendra & Fristoe, Reference Raghavendra and Fristoe1995). The results also revealed that maintenance was somewhat lower in the 4-year-olds. This finding may be related to the fact that children in this age group showed lower performance initially, and were more likely to need additional training to succeed on the task. The relationship between the need for training and the likelihood of failing the task a month later supports this hypothesis. The fact that no further exposure or use of the symbols occurred between the training and the maintenance testing may also have contributed: the new knowledge acquired through the training could have been compromised by lack of opportunities to review and revisit the newly learned skills.
The finding that newly learned skills were maintained for at least a month, without any intervening systematic exposure to the symbols, is encouraging from the point of view of clinical intervention. The degree to which this finding can be applied in clinical settings will depend on the similarities between the experimental conditions and the actual teaching or intervention situation. In the typical intervention situation for children with disabilities who are learning to use graphic symbols for communication, additional exposure would likely be provided more frequently than the month-long interval used in the current study.
The quantitative differences in correct responding based on age were not accompanied by qualitative differences of error type: the distribution of errors was similar across the age groups. This suggests that the older children simply made fewer errors overall rather than reducing or eliminating particular error types. Although errors were relatively infrequent in the participants' responses in general, the error analysis permitted a more detailed description of the range of productions in the context of graphic symbol use and offered the opportunity to reflect on some of the cognitive processes that may be involved.
The three main error types, omissions, substitutions, and inversions give an indication of the memory demands of the task. To construct the target symbol sequence, the child must remember the sentence elements. If the child forgets one of the words, he or she omits a symbol or replaces it, by a similar symbol (e.g., GIRL becoming BOY) or by a different one (e.g., GIRL becoming BLOCK) depending on the characteristics he remembers (e.g., “it is a person”). While searching for the symbols on the display, the child must also remember the sequence of the elements in the spoken sentence in order to reproduce the same sequence on the symbol display. If this order is remembered incorrectly, inversions might occur. The child may locate one of the target symbols but must refrain from pointing to it immediately if the symbols that precede it in the sequence have not already been located and selected; otherwise, an inversion error would be likely.
Another finding that suggests an influence of memory load in the performance is the disproportionate number of errors committed on SVO versus SV sequences. That SVO sentences include one more element to remember (the object, O) could partially explain the difference, especially for the omissions and substitutions. Only one type of inversion error is possible in the SV sequences (S–V inversions), whereas five inversion error types can occur in the SVO sequences (S–V, S–O, V–O, S–VO, and SV–O inversions). Therefore, the memory load is greater for the SVO sentences.
A potential explanation for the predominance of inversions is the possibility that the children might give more attention to the global meaning of the symbols, rather than their specific ordering reflecting the syntactic form of the sentence. This is consistent with Smith (Reference Smith, von Tetzchner and Jensen1996), who proposes that children may regard symbols as global representations of the meaning rather than individual elements to be ordered in a particular sequence.
In general, verbs were the elements most frequently involved in errors. This finding could partially be explained by primacy effects (a stronger impression is made by the first element) and recency effects (memory is fresher for the last element): the subject and the object would thus be less likely to be the source of errors as the first and last elements of the sentences. The nature of the elements in error does not seem to be a major concern in the literature. Sutton et al. (Reference Sutton, Trudeau, Morford, Rios and Poirier2010) reported that verbs were the most often omitted element in the graphic symbol sequences that their participants constructed to describe photographs, whereas Sutton and Morford (Reference Sutton and Morford1998) observed that the verb was usually preserved in graphic symbol sequences constructed by children to describe short videos. This contrast raises questions regarding the impact of the stimuli on the type of errors generated, as it appears that using a dynamic representation (i.e., videoclip) may have made the verb more salient to children, thus preserving it in their graphic sequences.
The studies mentioned above concerning omissions also analyzed inversions (Sutton & Morford, Reference Sutton and Morford1998; Sutton et al., Reference Sutton, Trudeau, Morford, Rios and Poirier2010). As in the experimental task of the present study, the most frequent inversion was V–O. This type of inversion was seen as a transitional step leading to the syntactic structure of oral sentences (SVO; Sutton & Morford, Reference Sutton and Morford1998). One explanation for this finding could be that the structure constructed (SOV) already exists in other languages, such as Japanese (Nakamura et al., Reference Nakamura, Newell, Alm and Waller1998) and Quebec Sign Language (Nadeau, Reference Nadeau, Dubuisson and Nadeau1993). This syntactic structure would then be an acceptable linguistic structure even though it differs from the one usually used in French. In addition, some AAC users also adopt this structure (Sutton et al., Reference Sutton, Morford and Gallagher2004; Wilkinson et al., Reference Wilkinson, Romski and Sevcik1994).
Another possible explanation for V–O inversions is that they could derive from the oral French syntax structure: SVO is expected with a noun object, but SOV with a pronoun object. That could induce some confusion for children if they are aware of those two different oral structures without having mastered them totally. In future research, crosslinguistic analysis could be useful to see if the V–O inversion errors would be as frequent in a similar task in other languages such as English, where the SVO structure would be expected the oral modality presents a more stable word order.
Another explanation for the V–O inversion could come from the graphic symbol display itself. Given that the nouns were placed to the left of the verbs on the display, a child visually scanning the display from left to right would encounter the verb last (V–O or SV–O inversions), whereas a child scanning the display from right to left would find the verb first (S–V and S–VO inversions). The left to right scanning would be expected to be more popular based on the natural direction of reading in French. Although most participants, based on their age, were likely nonreaders or would not have received extensive formal reading instruction, it is possible that the youngest children committed more errors because their knowledge of script conventions was more limited, thereby resulting in sequencing errors.
The data do not indicate a particular progression in error response types as steps toward correct responding: errors differed in frequency but not type across the age groups. Substitution errors could be considered more primitive, in the sense that the child was not able to identify correctly the elements of the utterance (Sutton et al., Reference Sutton, Trudeau, Morford, Rios and Poirier2010). It would be necessary to examine an earlier point in development in order to explore this possibility more fully; the 5- and 6-year-olds in the current study made very few errors overall.
Both Blissymbols and PCS were used in the experimental task in order to control for possible effects of level of difficulty of the individual symbols. Despite the literature suggesting that Blissymbols are generally less transparent than PCS (Bloomberg et al., Reference Bloomberg, Karlan and Lloyd1990; Huer, Reference Huer2000; Mizuko, Reference Mizuko1987) and that this may have an effect on ease of learnability (Burroughs et al., Reference Burroughs, Albritton, Eaton and Montague1990; Ecklund & Reichle, Reference Ecklund and Reichle1987; Hurlbut et al., Reference Hurlbut, Iwata and Green1982; Luftig & Bersani, Reference Luftig and Bersani1985; Mizuko, Reference Mizuko1987) and maintenance (Ecklund & Reichle, Reference Ecklund and Reichle1987; Hurlbut et al., Reference Hurlbut, Iwata and Green1982), the children's performance on the experimental tasks did not differ across the two symbol types. The literature on iconicity mainly reports results of studies of learning of individual symbols. In many studies, symbol acquisition followed some kind of corrective feedback (Raghavendra & Fristoe, Reference Raghavendra and Fristoe1995). In the present study, symbols were explained to the children and, for the Blissymbols, the explanations concerned the meaning of the different visual elements of the symbols. In addition, the small number of symbols (11) used in this study may have made it easier for children to distinguish the symbols because they formed a fairly limited set. The results suggest that children were able to acquire both types of symbols under these conditions. Symbols that are well learned initially should be easier to use, independently of the iconicity level, because cognitive resources could then be entirely dedicated to the use of the symbols rather than their recall. Furthermore, participants had repeated opportunities to reinforce their acquisition and use of symbols over the course of the larger protocol. This is in line with the idea that learning is strengthened and better when the symbols are reviewed after the initial acquisition, iconicity then losing part of its influence with repeated use of the symbols (Raghavendra & Fristoe, Reference Raghavendra and Fristoe1995).
The current findings point to the 4-year-old age range as a turning point in development of abilities needed to construct sequences of graphic symbols. Because the spoken sentence stimuli were designed to be at a syntactic level that would be easily accessible to 4-year-old children, differences in performance among the age groups cannot be attributed to language skills alone; other skills that develop during this age range likely play a role. Although the current study was not designed to explore these other skills systematically, the child development literature suggests potential contributing factors. Memory is one ability that shows significant changes in the 4-year-old period and that may be related to performance in graphic symbol utterance construction. For example, in a study designed to aspects of working memory in children aged 4 to 8 years, Luiciana and Nelson (Reference Luciana and Nelson1998) found that 4-year-olds made significantly more errors than 5- and 6-year-olds (who did not differ from each other) on a working memory task involving three items and four items, although all groups performed equally well with two items. Zelazo, Müller, Frye, and Marcovitch (Reference Zelazo, Müller, Frye and Marcovitch2003) noted the discrepancy between 4- and 5-year-olds frequently reported in the literature, and conducted a series of experiments to explore in depth the nature of the difficulties experienced by 3- and 4-year-old children on memory tasks, in contrast to the relative ease of performance of 5-year-olds. By manipulating the experimental task they were able to improve the performance of the younger children to some degree; however, these manipulations were not needed for the 5-year-olds. Several of the error analysis results discussed above are consistent with an explanation of development in graphic symbol use based on memory (omissions, inversions, substitutions; fewer errors on two-element than three-element sequences; higher frequency of errors involving the verb). This relationship warrants direct study in future research.
The 4-year-old age range is the period when understanding of graphic representation as a communication medium emerges in the development of artistic skills (Golomb, Reference Golomb2004). Four-year-old children understand the referential and symbolic value of pictures (Mineo-Mollica, Reference Mineo Mollica, Light, Beukelman and Reichle2003), that pictures can replace objects (DeLoach & Burns, Reference DeLoache and Burns1994), and that graphic representations (i.e., drawings) can be flexible, but it is only at the age of 5 years that children grasp the intentional nature of drawings (i.e., that one would draw with the purpose of representing and that one would inspect a drawing with the intent of interpreting it; Callahan, Reference Callaghan2005). The current findings are consistent with developmental changes between 4 and 5 years of age in children's understanding of the graphic medium. However, the applicability of this literature to the use of graphic symbols for communication is limited; the distinction between comprehension and production may be blurred for graphic representations (the child points to a picture to demonstrate both comprehension and production; Mineo-Mollica, Reference Mineo Mollica, Light, Beukelman and Reichle2003), in contrast to distinct behaviors used to demonstrate comprehension and production of drawings (talking about the drawing vs. the act of drawing) and of speech (performing an action versus speaking). In the current study, inversion errors could be interpreted as a reflection of children's developing (but incomplete) understanding of the graphic medium. However, this explanation cannot be fully explored within the current data and should be addressed in future research.
The findings provide some insight into the relationship of speech and graphic symbols, and thus the nature of the challenges that face children with disabilities who require graphic symbol AAC systems. They are consistent with earlier studies suggesting that it is more difficult to construct utterances composed of graphic symbols than in speech. A fairly sophisticated level of skills may be required in order to construct utterances composed of graphic symbols with ease: only the 5- and 6-year-olds in the current study were able to do so. Prior to this facility with graphic symbol use, however, training on the task may help.
Further detailed studies with children in this age range are warranted. In addition, studies with younger children may reveal that some of these skills emerge earlier than the age of 4 years: this age group was already quite successful with this task. The nature of training that best supports learning to construct graphic symbol utterances also merits direct attention in research; task-specific training was used in the present study, and the amount of training was controlled for the purposes of the study. Interventions provided to children with disabilities who use graphic symbols for communication may include several components and involves several settings. The contribution of the elements of these interventions may be difficult to tease apart in natural settings; controlled studies may be required.
ACKNOWLEDGMENTS
This research was funded by a grant from the Social Sciences and Humanities Research Council of Canada awarded to the second and third authors. Preparation of the manuscript was supported by a graduate scholarship awarded to the first author by the Fonds de recherche en santé du Québec.