
Introduction
The analysis of food-consumption patterns of populations under the control of an expanding empire can provide insights into the form, structure and extent of state power and how it affected local domestic economies and daily life (Hastorf Reference Hastorf1985, Reference Hastorf, D'Altroy and Hastorf2002; D'Altroy et al. Reference D'Altroy, Lorandi, Williams, Calderari, Hastorf, DeMarrais and Hagstrum2000). Since the 1990s archaeological inquiry into the expansion of the Inka Empire has taken a ‘household approach’, focusing on food-production and -consumption patterns among state agents and conquered populations alike (D'Altroy Reference D'Altroy1992; D'Altroy et al. Reference D'Altroy, Lorandi, Williams, Calderari, Hastorf, DeMarrais and Hagstrum2000). These activities would have been strongly affected by the need to produce goods for the ruling elites and to supply exchange networks, as well as to guarantee sustenance for the troops mobilised for imperial interests (D'Altroy et al. Reference D'Altroy, Lorandi, Williams, Calderari, Hastorf, DeMarrais and Hagstrum2000; Hastorf Reference Hastorf2017). In many cases, this demand resulted in the generation of agricultural surpluses—an unprecedented practice among local economies—as well as a shift in production towards foodstuffs that had high symbolic value for the Inka state, such as chicha, an alcoholic drink made by the fermentation of maize and consumed during ceremonial and political events (Hastorf Reference Hastorf2017).
According to the chronicles by Miguel Cabello Balboa (AD 1535–1608), the Inka Empire occupied the area of modern north-west Argentina between AD 1471 and 1536, during the wave of expansion led by Tupac Inca, under the rule of Wayna Qhapaq (Rowe Reference Rowe1978). The impact of Inka dominance in this region has been widely investigated, and the nature and intensity of imperial influence on the daily lives of subjugated populations has been a topic of recurring interest (e.g. D'Altroy et al. Reference D'Altroy, Lorandi, Williams, Calderari, Hastorf, DeMarrais and Hagstrum2000; Mengoni Goñalons Reference Mengoni Goñalons2007; Miyano et al. Reference Miyano, Lantos, Ratto and Orgaz2017). Such studies have found continuities in local ethnic institutions, but also regional variations in Inka administrative policies (Williams et al. Reference Williams, Villegas, Gheggi and Chaparro2005; Raffino Reference Raffino2007). The extension of cultivated areas and the construction of irrigation channels, dams and storage facilities, for example, suggest a process of agricultural intensification in the Valliserrana region of north-west Argentina (Williams et al. Reference Williams, Korstanje, Cuenya, Villegas, Korstanje and Quesada2010). The large scale of infrastructure that the Inka developed in this area, which conflicts with estimates of pre-Inka population levels, suggests that the goal of agricultural production went beyond simply ensuring the subsistence base for local inhabitants, but rather aimed to create agricultural surpluses to satisfy state needs (Williams et al. Reference Williams, Korstanje, Cuenya, Villegas, Korstanje and Quesada2010). Similarly, zooarchaeological studies of Inka contexts in the Argentine Northwest have examined evidence for differentiated social access to products resulting from the state-organised capture (chaku) of wild vicuña (Vicugna vicugna) (e.g. Mengoni Goñalons Reference Mengoni Goñalons2007; Miyano et al. Reference Miyano, Lantos, Ratto and Orgaz2017). Other research has focused on the identification of individuals of high social prestige, marked by their association with characteristic imperial wares, such as aríbalos and plates, as well as other ornamental objects (Williams et al. Reference Williams, Villegas, Gheggi and Chaparro2005).
The new agricultural surpluses of the Inka period could also have been used to create and sustain relationships based on patronage between the state and local leaders, creating potential differences in diet between the local elites and the wider local communities of which they formed part (Williams et al. Reference Williams, Villegas, Gheggi and Chaparro2005). Hastorf (Reference Hastorf1985) found that populations located close to the Inka heartland at Cuzco exhibited a change in dietary patterns under imperial rule, characterised predominantly by an increase in the relative contribution of maize to the local diet. Changes in food-consumption patterns described in the Central Andes, however, were not necessarily replicated in the peripheral regions of the Empire, such as in the Argentine Northwest. This article explores the influence of the Inka Empire on food-consumption patterns in the southern Argentinian Puna using carbon and nitrogen isotope (δ 13C and δ 15N) composition data from archaeological human bone from Antofagasta de la Sierra, Catamarca Province—a central node of the Inka occupation in the southern Puna, probably due to its mineral wealth (González Reference González1980). More generally, we seek to illuminate the range of dietary variability in local responses to the mechanisms and strategies involved in imperial expansion. The analysis is based on skeletal remains from two archaeological sites dated to between c. AD 1000 and 1536—also known as the Desarrollos Regionales–Inka (Regional Developments–Inka) period. At one of these sites the individuals were accompanied by grave goods with imperial Inka associations. Our starting assumption was that we would find evidence of a change in food-consumption patterns among these individuals, possibly including an increased proportion of maize in their diet—a resource that has been closely associated with Inka expansion (Hastorf Reference Hastorf1990). In turn, these new data provide the opportunity to illuminate the degree of existing contemporaneous local autonomy regarding decision-making in the economic sphere—especially given the potentially coercive nature of imperial governance—and how this might have affected the daily lives of provincial subjects.
Background
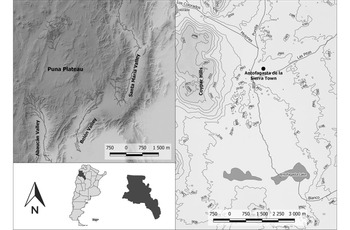
Antofagasta de la Sierra (Catamarca Province) is located between 25°40′–26°10′ south and 67°35′– 67°00′ west, at over 3000m asl. The region is a high-altitude, hyper-arid desert (Figure 1), where rainfall averages 124mm per year. Occupied by humans for the past 10 000 years, it is a highly heterogeneous landscape, encompassing a wide range of micro-environments that offer diverse resources for human populations. The highest potential for agriculture is located on the basin floor, while high-altitude ravines (quebradas) offer perennial water sources and pasture, making them attractive for hunting and herding activities (Olivera & Vigliani Reference Olivera and Vigliani2000–2002; Grant Reference Grant2017). It has been suggested that an economic model combining llama (Lama glama) pastoralism with agriculture was adopted in this area c. 3000 years BP. Under this model, pastoralism was the main economic focus, complemented by small-scale agriculture and the hunting of vicuña (Vicugna vicugna), the latter of which was a significant resource component and perhaps the greatest contributor of meat protein to the local human diet (Olivera & Grant Reference Olivera, Grant, Acosta, Loponte and Mucciolo2008, Reference Olivera and Grant2009). At c. 1700 years BP the importance of agricultural production in Antofagasta de la Sierra increased, followed by further intensification and expansion between c. 1200 and 1000 years BP (Olivera & Vigliani Reference Olivera and Vigliani2000–2002). After c. 700 years BP, a new phase of agricultural intensification led to changes in the social and political organisation of the Antofagasta de la Sierra region (Olivera & Vigliani Reference Olivera and Vigliani2000–2002). This period is designated with the term ‘Regional Developments’ in the local chronological scheme and is characterised by the ceramic style traditionally known as the ‘Belén Culture’. This style has been identified in the low-altitude valleys of Hualfín and Abaucán (Catamarca).
Location of Antofagasta de la Sierra (map by C. Gentile).

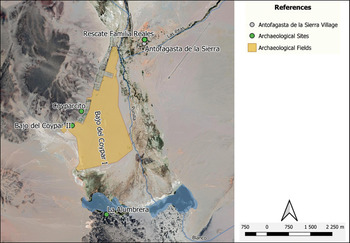
One of the main motivations behind Inka imperial annexation of the Southern Andes in general and Antofagasta de la Sierra in particular (c. AD 1480–1532) was probably the region's mineral wealth in gold and onyx (González Reference González1980). Antofagasta de la Sierra may also have had strategic value for the Inka Empire, as it is situated along the only communication route linking the fertile basins in northern Chile and the extensively cultivated mesothermal valleys of the Argentine Northwest (Williams Reference Williams2000). The material evidence for Inka occupation of the Antofagasta de la Sierra microregion is wide-ranging, including an unequivocal marker of imperial influence: stretches of the Qapac Ñan, or the Inka Road. Pottery styles associated with imperial occupation have been found in residential structures at the site of La Alumbrera, which was occupied during the Regional Developments period. At the Tambería Laguna Diamante site (4500m asl)—probably a high-altitude administrative enclave—enclosures were built using Inka architectural techniques and styles. Construction of the El Coyparcito fortified hilltop site can also be interpreted as a sign of imperial dominion over the local area. Concurrently, Inka occupation prompted changes to farming infrastructure that gave rise to ever more complex agricultural production systems (Tchilinguirian & Olivera Reference Tchilinguirian and Olivera2000). The Coyparcito Fortress may have been instrumental for the control of the 400ha agricultural system of Bajo del Coypar 1 (Figure 2), which had been developed during the pre-conquest Regional Developments period. The presence of Santamariano-style ceramics, both in the Bajo del Coypar I area and in the adjacent funerary structures, suggests that, during the Inka expansion, groups resettled by the Inka (mitimaes) from the mesothermal valley of Santa María (Catamarca) may have provided agricultural labour (Vigliani & Olivera Reference Olivera and Vigliani2000–2002). Thus, the history of pre-Hispanic occupation in the southern Puna can be considered a long-term process oriented towards increasing crop yields, although previous stable isotope analyses of human remains from this region show no evidence for a progressive increase in maize consumption among these local subject populations (Killian Galván Reference Killian Galván2018).
Main archaeological sites at Antofagasta de la Sierra (map by C. Gentile).

Materials and analytical methods
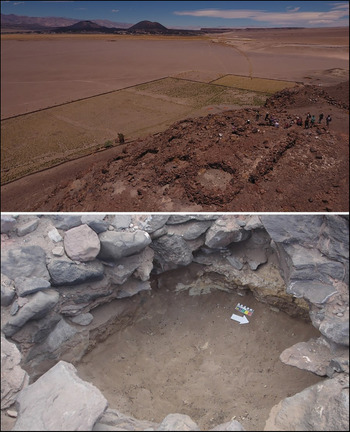
Coyparcito (Figure 3; 3350m asl) is a defensive settlement located on the summit of the Cerros del Coypar range. It has been characterised as a culturally ‘mixed’ site on account of its combination of local and Inka features (‘Belén-Inka’ style) (Olivera & Vigliani Reference Olivera and Vigliani2000–2002). Several pre-Hispanic tombs are located along the slopes of the Cerros del Coypar, one of which—known here as TCC—is an oval structure of volcanic rocks bonded by a reddish mortar. This latter tomb was looted in 2010. Subsequent excavation recovered skeletal material disturbed and discarded by the looters, as well as artefacts associated with the burials, including textile fragments, strings of various colours and thicknesses, fragments of gourd vessels, malachite beads and the remains of rodents (C. Raíces Montero & P. Miranda pers. comm.).
Top) aerial view of Cerro del Coypar, the extensive agricultural fields and several volcanoes associated with the archaeological site of La Alumbrera (photograph by W. Metzke & I. Ewert); bottom) the excavated tomb was an oval structure, built using volcanic rocks and reddish mortar (photograph by A. Elías).

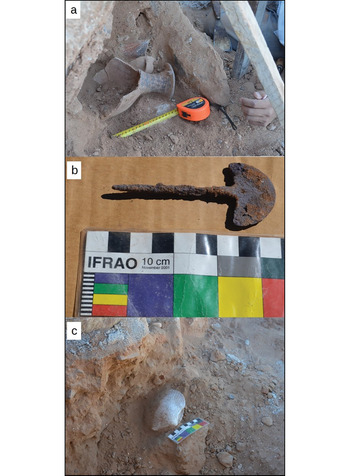
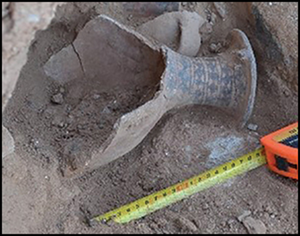
Another rescue excavation was conducted in 2014 within the Reales family home at the Villa de Antofagasta de la Sierra (3323m asl; site named here FR, Olivera Reference Olivera2014). Here, tombs consisted of a series of sub-circular enclosures, delimited by large vertical ignimbrite slabs. The tombs contained human remains and artefacts associated with the Inka, including an aribaloide (a vessel sometimes associated with the consumption of maize chicha), a metallic pin (tupu) and a marine shell (Figure 4). These tombs could have formed part of a larger burial site—possibly the earliest cemetery dated to the Inka period in the Antofagasta de la Sierra microregion. As at Coyparcito, the skeletal assemblage was highly disturbed (Olivera Reference Olivera2014).
Artefacts recovered from the Familia Reales (FR) archaeological site: a) aribaloide, a vessel sometimes associated with the consumption of maize chicha; b) metallic pin (tupu); c) marine shell (photographs by M.I. Pérez).

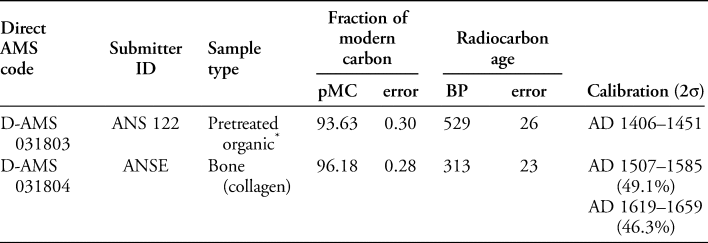
Samples for radiocarbon-dating were obtained from two individuals (one from each site): ANS 122 (from TCC) and ANSE (from FR). The samples were measured using AMS at the DirectAMS laboratory (USA), and the dates calibrated using the Calib 6.0.1 software (McCormac et al. Reference McCormac, Hogg, Blackwell, Buck, Higham and Reimer2004) and SHCal13 curve (Hogg et al. Reference Hogg2013).
For this study, we analysed the carbon (13C/12C) and nitrogen (15N/14N) stable isotope compositions of the organic (collagen) and inorganic (bioapatite) fractions of human bones (TCC n = 4; FR n = 6; 100 per cent of individuals from both sites). Collagen extraction and washing procedures followed Hüls et al. (Reference Hüls, Grootes and Nadeau2007). Approximately 0.60±0.03mg of purified collagen per sample was analysed using an Elemental Analyzer EA Flash 2000 attached via a ConFlo IV interface to a MAT 253 Mass Spectrometer. Bioapatite samples were prepared in accordance with Koch et al. (Reference Koch, Tuross and Fogel1997). The isotope analyses were performed following Révész and Landwehr (Reference Révész and Landwehr2002) in a Gas Bench II used as an interface to the auto-sampler GC PAL, with a temperature-controlled aluminium plate adjoined to a Thermo Finnigan MAT 253 mass spectrometer. Pre-treatment and isotopic analysis of the samples were carried out in the Laboratorio de Isótopos Estables LANGEM, Instituto de Geología, UNAM (Mexico).
Isotope composition data were analysed using the Bayesian mixing model FRUITS (Food Reconstruction Isotopic Transferred Using Signals), designed for the reconstruction of human diets (Fernandes et al. Reference Fernandes, Millard, Brabec, Nadeau and Grootes2014). Three main food groups were considered in the model: terrestrial C3 plants (Solanum tuberosum, Chenopodium quinoa, Geoffroea decorticans and Prosopis sp.), C4 cereals (Zea mays) and meat from terrestrial animals: llama (Lama glama) and vicuña (Vicugna vicugna). The carbon and nitrogen isotope compositions of these resources were obtained from previously published studies (Table 1; Killian Galván & Salminci Reference Killian Galván and Salminci2014; Killian Galván et al. Reference Killian Galván, Ducós, Marbán and Panarello2016; Grant Reference Grant2017). The isotope compositions, estimated contributions and concentrations of macronutrients (i.e. protein, carbohydrates and lipids) were also incorporated into the model, as well as the substrate-to-product offsets: protein-to-collagen, lipid-to-collagen and diet (bulk)-to-collagen. Further details on the estimation of these offsets and priors can be found in Killian Galván (Reference Killian Galván2018).
Descriptive statistics of the food groups used in the FRUITS mixing model.

Results
The estimated dates obtained from the two samples (Table 2) are consistent with our expectations, given the cultural evidence found at the sites. Individual ANS 122 (TCC) dates to the late Regional Development period, during the first half of the fifteenth century AD, corresponding to the onset of Inka imperial occupation. Individual ANSE (FR) dates to the latest Inka occupation in the Antofagasta de la Sierra region, the Hispanic-Indigenous period, from the early sixteenth to the mid-seventeenth centuries. The Inka paraphernalia buried alongside the ANSE individual suggests an imperial affiliation; that is, dating to the first three-quarters of the sixteenth century.
Radiocarbon dates for human remains recovered from Cerro del Coypar (ANS 122) and Familia Reales (ANSE). Dates calibrated using the Calib 6.0.1 software (McCormac et al. Reference McCormac, Hogg, Blackwell, Buck, Higham and Reimer2004) and SHCal13 curve (Hogg et al. Reference Hogg2013).

* Purified collagen obtained using the protocol to prepare samples for stable isotope composition analysis.
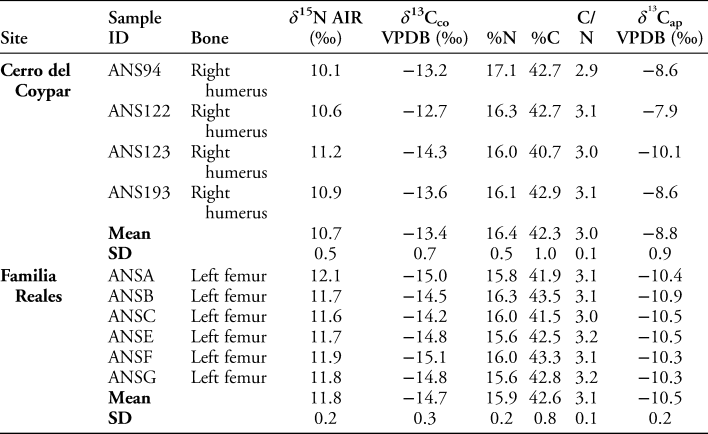
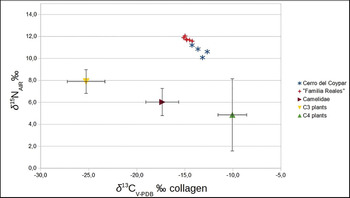
All the samples for stable isotope analysis demonstrated acceptable C:N ratios, %C and %N (Table 3). Figure 4 and Table 3 show that there is little variability in collagen and bioapatite isotope values within and between bone assemblages. Overall, the isotope composition values of collagen suggest a higher influence of C4 plants and camelids on the diet than C3 plants. TCC samples present isotope compositions more strongly related to C4 plants, compared with the FR samples. On average, δ 13Capatite values in FR individuals are 2‰ lower than in TCC individuals, indicating a lower contribution of C4 to the overall diet at FR.
Stable isotope values and standard deviations of bone samples from TCC and FR.

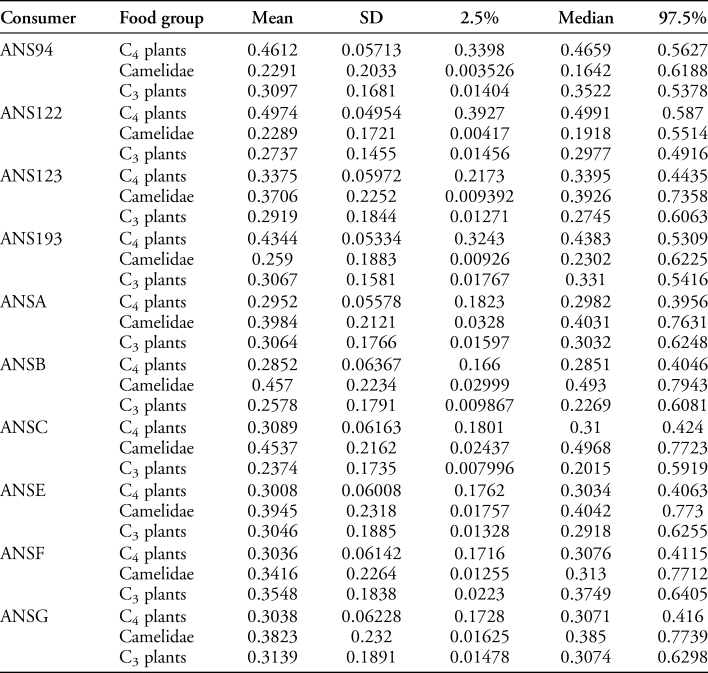
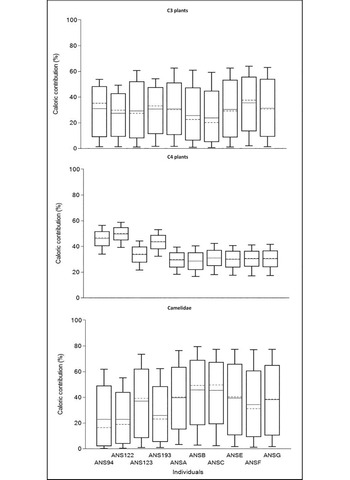
The results of the FRUITS mixing model (Figure 5 & Table 4) also support this conclusion, suggesting that the contribution of C4 plants was largest among the TCC individuals. For ANS122, dated to the Regional Developments period, C4 plants may have represented up to 50 per cent of the calories in their diet. Among the FR individuals dated to the Hispanic-Indigenous period, the C4 contribution is smaller (30 per cent) but uniform among the six samples.
Collagen δ13C and δ15N values from the Cerro del Coypar tombs (TCC) and the Familia Reales site (FR) (figure by V.A. Killian Galván).

Descriptive statistics of energy-contribution rates for each food group in the Cerro del Coypar and Familia Reales individuals.

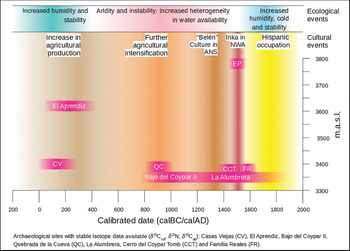
These results, showing that maize contributed less than 50 per cent of the diet, are consistent with those previously obtained from nine other individuals from the Antofagasta de la Sierra region (Figure 6; Killian Galván Reference Killian Galván2018); the only exception within that dataset is the individual recovered from El Aprendiz, a site located in one of the high ravines and dated to an earlier period (1828±57 years BP; Figure 7). This individual stands out because approximately 60 per cent of their diet was made up of C4 plants—much higher than in the ANS122 individual. Thus, there is no observable change in the pattern of consumption that would suggest a greater intake of maize following the Inka expansion among the individuals analysed in the present study. Moreover, the individuals that demonstrate a greater proportion of C4 plants in their diet come from TCC, where unequivocal evidence for Inka material culture is absent. It therefore seems that individuals at FR associated with imperial objects were consuming local resources. This could suggest that: a) they were a group of non-local individuals whose eating habits were adapted to local consumption patterns; or b) they were a local group whose adoption of foreign cultural goods was not accompanied by a change in diet to consume more maize. A third option is that they were individuals relocated by the Empire moving from isotopically indistinguishable ecological environments. This would not be the case for the populations that formerly occupied the mesothermal valleys, however, as here the important dietary role of C4 plants has previously been recorded (Williams & de Hoyos Reference Williams and Hoyos2001; Williams et al. Reference Williams, Villegas, Gheggi and Chaparro2005; Gordillo & Killian Galván Reference Gordillo and Killian Galván2017).
Model estimates of calorie intake for the Cerro del Coypar and Familia Reales individuals. Boxes represent a 68 per cent credible interval (16th–84th percentiles) and whiskers represent a 95 per cent credible interval (2.5th–97.5th percentiles). The solid horizontal line represents the estimated mean and the dashed line represents the estimated median (figure by V.A. Killian Galván).

Timeline of the archaeological sites at Antofagasta de la Sierra. Ecological events proposed by Grana et al. (Reference Grana, Tchilinguirian, Olivera, Laprida and Maidana2016) (figure by V.A. Killian Galván).

In turn, the FRUITS results are less conclusive regarding the relative contributions of camelids and C3 plants to the individuals’ diets. This uncertainty is probably due to δ 15N values derived from cultivated plants, which were inputs to the FRUITS model. These are affected by the region's extreme aridity and the use of camelid dung as crop fertiliser. This causes δ 15N values from plants and camelids to overlap, making it difficult to separate the contributions of these two food groups to the overall diet. Further isotopic ecology analyses, especially for plants, are necessary to strengthen the applied analytical model.
Discussion
Several studies have proposed that food-consumption patterns in the Argentine Northwest could have been disrupted by changes resulting from Inka expansion, including intensification of agricultural production, new storage practices and the exchange of specific goods in the context of patronage between the Empire and local leaders (Williams et al. Reference Williams, Villegas, Gheggi and Chaparro2005; Raffino Reference Raffino2007). The present study explores two phases of imperial occupation in Antofagasta de la Sierra—a strategic node in the Inka expansion across the southern Puna. The first phase, represented by site TCC, corresponds to the onset of imperial occupation, and the second, FR, to its end. TCC suggests a scenario in which the Empire's influence had not yet affected cultural practices relating to grave goods—if indeed the Empire exerted any degree of local control at this point in time. This situation contrasts with known changes in grave goods influenced by the Inka in lower-altitude eco-regions (Williams Reference Williams2000). Nonetheless, maize, a foodstuff believed to be closely associated with Inka influence, seems to have been a significant contributor to the diet of the TCC individuals. Although this is not unprecedented in Antofagasta de la Sierra—there is at least one previously published pre-Inka individual for whom maize formed a significant proportion of their diet)—our TCC results are inconsistent with contemporaneous data from the wider Puna region, where maize was a less important food staple (Killian Galván Reference Killian Galván2018).
The four individuals buried close to the extensive agricultural fields of the Bajo del Coypar complex had reliable access to food produced by the sophisticated irrigation techniques characteristic of the Regional Developments period. This technology enabled high crop yields even under the contemporaneous hyper-arid conditions (Tchilinguirian & Olivera Reference Tchilinguirian, Olivera, Korstanje and Quesada2010). The use of a ridge-farming system protected the fields from excessive salinisation, optimising soil use and creating a favourable micro-climate for agricultural production. This system also enhanced maize production, which previously had been limited by the hostile environmental conditions.
The positioning of TCC and other tombs along the hillside of Cerro de Coypar suggests that these graves played a role as territorial markers, both making visible and reinforcing the bond between the extensive farm lands and the social groups that lived in La Alumbrera's ‘conglomerate’ site—one of the largest settlements of its kind in the southern Puna and occupied contemporaneously with TCC (Olivera & Vigliani Reference Olivera and Vigliani2000–2002). The Inkas must have noted the strategic and symbolic significance of Cerro de Coypar when they arrived in the area, encouraging them to erect the Coyparcito Fortress on its summit in order to gain control over the Rio Punilla Valley and its inhabitants.
The relatively small contribution (~30 per cent) of maize to the diet of the six FR individuals is striking given the importance of maize in the Inka culinary repertoire. It is possible that the technological investment associated with state works, such as sophisticated irrigation systems and maintenance of soil quality, was not intended to focus on increasing maize yields. Other resources, such as camelids and high-altitude plants (e.g. potatoes, quinoa), may have guaranteed a balanced diet—at least for the individuals analysed in this study. Although the use of grave goods associated with the Inka in the FR burials suggests some degree of cultural change, this practice may have been restricted to certain important events, such as funerals, while mundane eating practices remained largely free from imperial influence. In this scenario, maize would have been consumed only sporadically, and associated with special rituals in the form of chicha.
Future specific studies of human mobility in the form of, for example, analysis of oxygen, hydrogen and strontium isotopes in different skeletal tissues, are necessary to explore the geographic origins of the individuals found at the FR site. Ongoing research by the authors aims to compare values obtained from teeth and bones in order to establish the origins of the FR individuals. This will address the hypothesis of Olivera and Vigliani (Reference Olivera and Vigliani2000–2002) that mitimaes were brought from the lower mesothermal valleys.
Conclusions
The study of food-consumption patterns to explore the effects of annexation on local communities by the Inka Empire has been a popular research focus in Andean archaeology. These studies underscore the diversity of imperial strategies regarding the management and control of annexed territories and peoples. In some cases, such as the Mantaro Valley in the Central Andes, agricultural production was entirely re-oriented towards new goals, while in other cases, the Inka did not alter extant political and economic systems (Hastorf Reference Hastorf1985, Reference Hastorf2017; Williams et al. Reference Williams, Villegas, Gheggi and Chaparro2005; Raffino Reference Raffino2007). In this article, we have explored changes in dietary patterns among individuals associated with Inka contexts in Antofagasta de la Sierra, an area distant from the centre of Inka political power and generally considered to be linked to imperial mining interests (González Reference González1980).
Given the economic, political and symbolic values that the Inka placed on maize, we have focused on exploring the importance of this resource in an area where its large-scale production poses several challenges, even with the application of effective agricultural techniques. Our results show that the quantity of maize consumed by humans in the analysed sample was not much higher than in earlier, pre-Hispanic periods in the Antofagasta de la Sierra microregion. Indeed, the individuals that demonstrate the greatest consumption of maize in their diets were not those more closely associated with Inka influence, for example, through associated grave goods. This evidence allows us to consider the degree of coercion involved in Inka governance strategies, which, as has been pointed out by D'Altroy et al. (Reference D'Altroy, Lorandi, Williams, Calderari, Hastorf, DeMarrais and Hagstrum2000), depended greatly upon the types of resources available in each of the annexed territories, as well as on the response of local groups towards imperial control. Thus, the reconstruction of local lifestyles on the imperial peripheries provides insight into the nature of the power and organisation of the expansive imperial states in the past.
Acknowledgements
We wish to thank the Reales family for permitting the excavation of their property. Special thanks go to A. Elías, L. Grana, P. Miranda, N. Santinelli and L. Gasparotti for their assistance during fieldwork; Cecilia Gentile for making the maps shown in Figures 1–2; and Malena Pirola for her help in editing the final version of the manuscript. We dedicate this article to the memory of Pedro Salminci and Patricia ‘Pato’ Escola.
Funding statement
This research was supported by UBA, SECYT-UNCa, CONICET, Agencia Mexicana de Cooperación Internacional para el Desarrollo (AMEXCID), Laboratorio de Isótopos Estables, LANGEM, Instituto de Geología, and UNAM y Agencia Nacional de Promoción Científica y Técnológica (Préstamo BID, UBA, PICT 2016-3075).