


Introduction
The Amery Ice Shelf and its tributaries drain ice from the Lambert Glacier basin, East Antarctica. The shelf is elongated in shape and located at 60–75˚ E. The southern limit of the grounding zone (Fig. 1) is located about 550 km inland from the ice-shelf front at the confluence of the large Lambert, Mellor and Fisher Glaciers (Reference FrickerFricker and others, in press). Lambert and Mellor Glaciers carry most of the flow from the interior of the basin. Fisher Glacier contributes a smaller fraction of the flow from the west of the basin.
RADARSAT SAR image of the Amery Ice Shelf showing the locations of key features. Distances are given from the southern limit of the grounding zone (GZ) in the direction of ice flow. Key geographic features mentioned in the text are: ME, Mawson Escarpment (–30 to +100 km); CM, Clemence Massif; GI, Gillock Island; JP, Jetty Peninsula (220–330 km); LG, Lambert Glacier; MG,Mellor Glacier; FG, Fisher Glacier. CG indicates where Scylla and Charybdis Glaciers enter from north ofJetty Peninsula. Also shown are streamlines (red) which delineate major flow-bands, and the longitudinal profile (blue) along the Mellor Glacier flow-band (Fig. 4), together with the locations (black squares) of the 1968–70 survey stations (Budd and others, 1982; Reference KingKing, 2001). Location of the image strip (red) in Antarctica is shown in the inset map and by the latitude–longitude graticule. RADARSATSAR data are # Canadian Space Agency, 1997.

Early measurements of the velocity and strain-rate distributions on the Amery Ice Shelf were obtained from surveys using electronic distance-measuring equipment and theodolite in 1968 and 1970 (Budd and others, 1982). The survey net comprised a 260 km long profile aligned approximately along the average flow direction, and two transverse profiles, one across the shelf near the front, the other near the southern end of the longitudinal profile (Fig. 1). Measurements of the flow on tributary glaciers were made at 11points in the early 1970s (Reference AllisonAllison, 1979). Thiswork provided velocity values on the upper reaches of these glaciers. Between 1995 and 2000, further measurements of velocity on the Amery Ice Shelf were made using global positioning system (GPS) technology. A re-analysis of the earlier terrestrial and GPS data has provided an integrated analysis for the horizontal velocity. Additionally, a time series of the vertical motion of the ice shelf in response to tides has been made (Reference King, Nguyen, Coleman and MorganKing and others, 2000; Reference KingKing, 2001).
These field surveys provided accurate velocities but only at a number of discrete points sparsely distributed over the ice shelf and glacier streams. Analysis of pairs of images acquired by satellite-borne optical or synthetic aperture radar (SAR) instruments can produce a dense set of velocity observations over much of the ice surface. One technique tracks the displacement of surface features that move with the ice over the time interval, typically 1year or more, between acquisitions of a pair of images acquired with either optical or radar instruments (e.g. Reference Scambos, Dutkiewicz, Wilson and BindschadlerScambos and others, 1992). Recent work using feature tracking on Landsat-4 Thematic Mapper (TM) images has produced a large set of velocity observations on the Amery Ice Shelf, Lambert Glacier and other tributaries, and is the subject of a separate paper. However, the distribution and density of observations is very dependent on the quality and distribution of features suitable for tracking. The greatest density of observations was obtained where the surface is heavily crevassed, particularly in the region of the confluence, and few observations were obtained over significant fractions of the ice shelf further north where features are indistinct.
Other techniques, which are based on interferometric analysis of pairs of coherent SAR images, depend on different characteristics, and properties of snow at micro-wavelengths. These techniques use data acquired over relatively short intervals of days to weeks. Here we present a dense set of velocity estimates for much of the surface area of the Amery Ice Shelf and adjoining grounded ice, derived from analysis of two sets of RADARSAT SAR data acquired with a 24 day separation. The velocity estimates were obtained using techniques involved in the co-registration of complex-valueddata from coherent images. This approach complements the feature tracking in TM images, in that where values could not be obtained with one technique, they often could with the other. From this dense velocity set we derive the horizontal components of strain rate, and then use the velocity and transverse shear strain-rate distributions to describe key features of the flow regime of the ice shelf and infer related deformation properties.
Velocity Estimation By Interferometric Analysis Of Radarsat Sar Data
We derived estimates of the movement of the ice surface using maximum coherence as the measure of matching small samples taken from pairs of complex SAR images corresponding to the same part of the surface (Reference Derauw and Saway-LacosteDerauw, 1999). Maximum-coherence tracking is comparable to speckle tracking (Reference Gray, Mattar, Vachon and SteinGray and others, 1998) but uses the phase information in the complex-valued SAR data rather than the speckle information in the real-valued amplitude images. Each procedure searches for the best match or correlation between two samples of data taken from two images.
The SAR data were acquired using RADARSAT during the Antarctic Mapping Mission (AMM) in September– October 1997. Two sets of seven consecutive frames of SAR data were used that were acquired on two orbits separated by 24 days (day 267 (24 September 1997) and day 291 (18 October 1997)). They were acquired with a nominal incidence angle of 27°. The raw SAR data were first processed to single-look-complex (SLC) images. In maximum-coherence tracking, we experimented with different sizes for the sample window, from 24 by 24 pixels up to 96 by 96 pixels. Larger window sizes generally produced more and stronger matches, but required greater spacing between adjacent velocity nodes in order that those velocity estimates were uncorrelated. We chose an optimum window size of 64 by 64 pixels in the SLC image. This gave the densest coverage of observations (i.e. successful match) and best quality for the displacement statistics obtained from the SAR data acquired on these two orbits, and gave good spatial resolution of the flow characteristics under investigation. A 64 by 64 pixel sample in the slant-range coordinate system (pixel size of 5.34 m in the along-track direction of the satellite and 8.12 m across-track) of the SLC image corresponds to about 0.34 km along-track and 1.14 km across-track on the surface (ground-range). In the work presented here, we sampled the SLC images at a regular interval such that the analysis produced displacements and thus velocities on a regularmesh at a node spacing of 1kmon the ground.
Successful matches were achieved in the interferometric analysis over 85 % of the glacier and rock surface. A criterion used in the matching process is a measure of how well the local peak in coherence is defined (signal/noise ratio). Where the peak is poorly defined, the match is weak, and this tended to occur where coherence was weak. Setting a level for this criterion results in a trade-off between maximizing the number of matches and minimizing the number of erroneous matches. There were several narrow strips where no match was achieved. These occurred along parts of the margins of the ice streams, typically within areas where we found very high values of shear strain rate. There was a sharp demarcation between a dense set of matches and no match in the narrow strip. There were also several large patches in the images with no match, and a rather diffuse or ragged boundary, where the density of matches decreased over a finite distance. Two of these occurred on the Amery Ice Shelf towards the front, and the others on the grounded ice. The largest of these was on Lambert Glacier upstream of the southern confluence.
The displacements were derived at each velocity node by first projecting the coordinates of the window centres from the slant-range system in the SLC images to a geo-coded ground-range reference system. The process uses the satellite ephemeris information for both orbits and the known geometry of the SAR imaging system. However, this process just gives a relative displacement between image features, which includes contributions from errors in the orbit ephemeris data. To obtain values of actual displacement, we apply a correction to adjust the values to zero displacement on known fixed points such as rock outcrops or centres of flow on domes or ridges. The velocity was then derived from the adjusted displacement between the ground coordinates over the 24 day time interval.
The precision of the match using maximum coherence is around 0.1 pixel. This translates to a precision in velocity of about 8 ma–1 along-track and 26ma–1 across-track, which represents the random component of the error budget for each velocity estimate. In addition to the error associated with the matching, there are two other sources of error in the velocity estimates: one is from errors in the orbit ephemeris data; the other is for floating ice and is caused by the vertical motion in response to tides. Errors in the velocity values from these sources will appear as biases that exhibit a smooth and systematic spatial variation. The zero-velocity adjustment to the displacements corrects for gross errors in the ephemeris for the two orbits. Small residual errors in the orbit ephemeris could still introduce an error in the displacement. This is accounted for by using multiple control points distributed through the region of interest. There are several fixed features spread along most of the ice shelf, but none for the northernmost 200 km. The effect of orbit and other errors is described in detail by Reference Gray, Short, Mattar and JezekGray and others (2001).
The vertical displacement associated with tidal motion translates to an apparent across-track displacement. For the times of the two orbits we estimated the relative tide difference as 0.78 m, using a tidal model for the Amery Ice Shelf, which matches tides observed at a nearby site (Reference Fricker, Hyland, Coleman and YoungFricker and others, 2000; personal communication from M. King, 2001). The actual tidal displacement can differ from this if there is a significant relative difference in atmospheric pressure at those times. Measurements of atmospheric pressure at automatic weather stations on the plateau to the east and west of the ice shelf indicate that there was negligible difference in atmospheric pressure between the two acquisition times, and therefore negligible contribution to the tide difference from the inverse barometer effect. We applied a uniform tide difference over the shelf that introduced a bias in velocity of about 23 ma–1 across-track to the west for the floating ice compared to grounded ice and rock features. To check for any effect of tidal amplification or phase differences on the relative displacement, we also generated a set of tidal displacements on a regular grid over the shelf using the Circum Antarctic Data Assimilation (CADA) tide model (Reference Padman, Fricker, Coleman, Howard and ErofeevaPadman and others, 2002). Those values showed that the relative displacement could vary by up to 0.1 m along the shelf, with similar variations across the front of the shelf. This would contribute an error in the form of a bias of up to 2–3ma–1 to the resultant across-track component of velocity. In addition, motion along a sloping surface leads to a change in elevation for any particular piece of ice and so can also contribute to the errors, where the magnitude is proportional to the slope. The effect would be significant on the steeper parts of the grounded ice sheet. On the ice shelf, however, the effect is negligible, and on the ice streams the error is quite small where the slope is small.
Reference KingKing (2001) assessed the accuracy of the derived velocity estimates by comparing them with results from the GPS observations and a readjustment of the terrestrial surveys of 1968 and 1970. In preliminary work, he found that the satellite-derived velocities generally matched well with the terrestrial results spread over a 260 km section of the shelf. The differences in magnitude appeared to vary systematically with location over the shelf, suggesting that there is a bias in the velocities of up to 10–15ma–1. He also found from an analysis of terrestrial observations collected over a 25 year interval that there had been no apparent change in velocity over this same section of the shelf. Hence, we attribute the differences to unresolved errors from the above sources. A rigorous assessment is required to resolve these matters. Thus an estimate of the external accuracy of the velocity values is given by the precision from the matching process of 8 ma–1 along-track and 26 ma–1across-track together with a possible bias of about 15ma–1.
Velocity And Strain-Rate Analysis
From the velocity field, we generate the horizontal components of strain rate with respect to the rectilinear coordinate system of the geo-coded SAR images. The velocity estimates obtained from the interferometric analysis are observations with inherent errors. In the calculation of the strain rates we adopted a procedure that combines multiple velocity estimates to generate a best-estimate velocity value with smaller variance as well as the strain rates. The procedure is comparable to that proposed by Reference MacAyealMacAyeal (1985), except we use a regular grid in place of his irregular arrays. The calculation at each point is carried out using all available velocity estimates contained within a small window centred on a velocity node. It provides a systematic way of analyzing the data essentially independent of how valid and missing values are distributed in the window.
The variation of velocity within the window is described in terms of a velocity at the centroid of the window, a rotation and the horizontal strain-rate components, which are assumed to be uniform within the window (linear approximation). The centroid velocity, rotation and strain-rate components are derived from a least-squares solution of an over-constrained set of linear equations. The resultant velocity field is a smoothed version of the original estimates, with the smoothing scale determined by the size of the window. Reference MacAyealMacAyeal (1985) refers to the rotation term as the vertical vorticity component. It is involved in the formulation of the equations but has no further relevance to the discussion. In the results presented here we used a 9 by 9 window, which is equivalent to taking an average over a distance scale of 8 km. To ensure the set of equations is always over-constrained, only those solutions for which there are more than a specified minimum number of velocity estimates within the window are accepted. The process acts as an interpolator/extrapolator for those nodes where there was no match in the tracking process. Extrapolation was restricted to no more than a quarter-window distance from a valid velocity estimate.
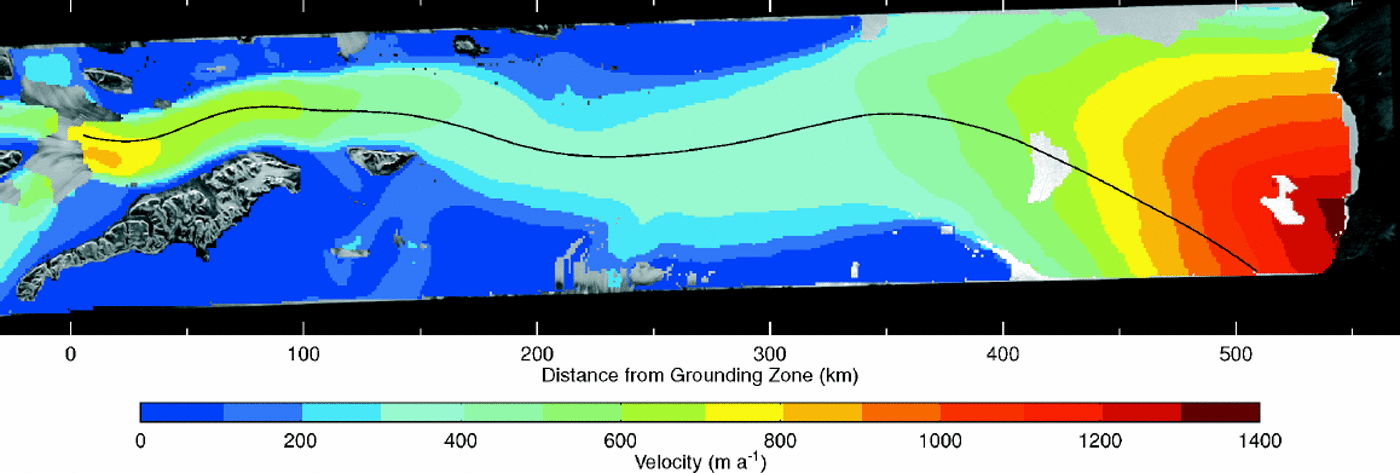
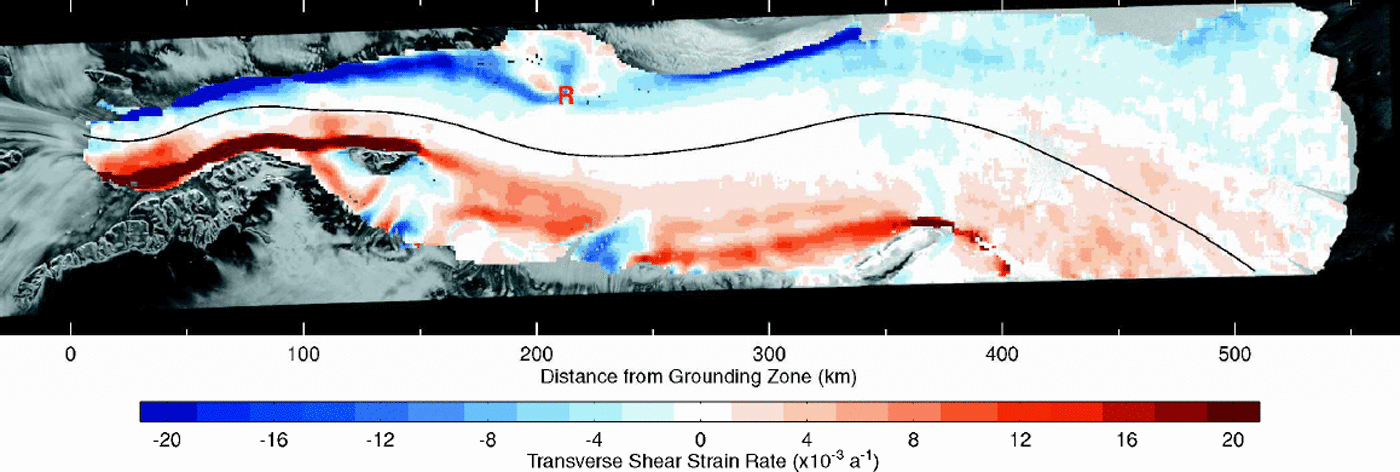
The strain-rate components from the rectilinear system are then resolved with respect to the direction of the mean velocity at each node to produce the horizontal components of longitudinal and transverse strain rates, and the transverse shear strain rate. The value of the transverse shear strain rate is positive where velocity increases to the left looking downstream. This typically means that it is positive on the right margin of a stream decreasing in magnitude towards the centre of the stream. Where the ice is freely floating, it effectively moves as a block. Thus, over the ice shelf, the surface strain field is representative of the strain field through the entire ice thickness. The transverse shear strain rate refers to the vertical plane aligned in the flow direction. The smooth velocity field derived from the strain-rate solution is presented in Figure 2. The transverse shear strain-rate results are presented in Figure 3. The colour scale used in this figure was chosen to display the detail in the distribution of strain rates with smaller magnitude, and the increments in colour were set to resolve differences larger than the estimated errors.
Spatial distribution of smoothed ice velocity over the Amery Ice Shelf and adjacent grounded ice, produced as part of the analysis for strain rate (see text), from velocity estimates derived using maximum-coherence tracking in pairs of SAR images. The solid colour of the image obscures the underlying SAR image of Figure 1, except where there are rock outcrops or islands (e.g.ME, CM, GI), or no solution for the ice velocity was obtained. High velocities occur close to the southern end of the shelf, and at the front, with a long section of low velocity in between.
Spatial distribution of transverse shear strain rate over the Amery Ice Shelf, that has been resolved with respect to the local flow direction. The colour scale is constructed to show the detail at low strain-rate values, with increments selected to give a resolution well above the error estimate. The disturbance to the strain-rate pattern caused by a major rumple is indicated at R (215 km).
The precision of the strain-rate components is obtained by a propagation of variances through the solution process used above. The random component of the velocity error term is the primary contribution to the variance in the strain rates. Any contribution from the spatial variation of the systematic bias in the velocities is insignificant, as it will be an order of magnitude or more smaller. For a fully populated window of 81 values, and an along-track velocity precision of 8 ma–1, the along-track strain rate has a precision of 0.3610–3 a–1. For an across-track velocity precision of 27 ma–1 the across-track strain rate has a precision of 1610–3 a–1.The precision of the longitudinal and transverse strain-rate components varies between these two values depending on the orientation of the mean velocity. The precision of the transverse shear strain rate is the same as that of the longitudinal strain rate. Where only one-third of the nodes in a window have valid velocity values, the along-track and across-track precisions degrade to about 0.6 and 2610–3 a–1, respectively, or worse if the values are poorly distributed within the window. Since the Amery Ice Shelf is oriented primarily in the along-track direction, and the main flow is in that direction, this implies that precisions for the longitudinal and transverse shear strain-rate components are better than 1610–3 a–1, and that the precision of the transverse strain rate is generally1–2×10⁻³ a–1.
The precision of the velocity values from the strain-rate solution is improved by a factor of up to 9, but the bias component is unchanged. The smooth velocity field was also used to generate a set of streamlines connecting tributary glaciers with the front of the shelf. We found that these streamlines closely followed linear flow features visible on the surface of the shelf, that were identified by Reference Hambrey and DowdeswellHambrey and Dowdes well (1994) as delineating individual flow units. Provided that the velocity field has been stationary in time, this close match suggests that the smooth velocity field derived in this work is a good representation of the actual flow field. Thus the best estimate of the external accuracy of values in the smoothed velocity field, based on the ties to the stable sites and comparison with terrestrial velocities, is given by the precisions of 1ma–1 along-track and 3 ma–1 across-track together with a possible bias of up to about 15ma–1.
Flowregime And Geometry Of The Ice Shelf
The distributions of velocity (Fig. 2) and transverse shear strain rate (Fig. 3) are now used to characterize key features of the flow regime and their relation to the structure and geometry of the ice shelf. Discussion of the features is referenced with respect to distance along the shelf, with the origin at the southern end of floating ice, defined by the grounding zone of Reference FrickerFricker and others (in press).
The overall width of the shelf increases from about 40 km at the southern end to about 200 km at the front. Much of the increase in width occurs in several discrete steps spread along the 550 km length of the shelf. Each step-like increase is associated with a significant inflow of ice from a tributary glacier which adds a band of ice to the side of the shelf. The major inflows come from Lambert, Mellor and Fisher Glaciers at the southern end. Significant increases in width occur with inflows from Scylla and Charybdis Glaciers in the northwest (320–350km), and from two sources on the eastern side. The first (100–160 km) comprises a broad band of relatively slow ice from the east and north of Mawson Escarpment which merges with a narrow band that split from the Lambert Glacier flow-band at Clemence Massif. The second significant source on the east is a distinct stream located between 220 and 250 km.
The flow-bands can be identified within the shelf and traced from their sources by linear structures, crevasse patterns and other features visible in satellite images (Reference Hambrey and DowdeswellHambrey and Dowdeswell, 1994), or through their expression in the surface topography (Reference Fricker, Hyland, Coleman and YoungFricker and others, 2000). At the front of the shelf, flow-bands originating from Lambert, Mellor and Fisher Glaciers, that comprise the full width of the southern end of the shelf, represent only about 30% of the frontal cross-section. The entire western half of the shelf at the front originates from Scylla and Charybdis Glaciers and additional inflows across the western margin between there and the front. Other inflows comprising the rest of the width come from northeast of Gillock Island and across the margin south of Jetty Peninsula.
Velocity Distribution
Figure 2 shows the spatial distribution of the velocity magnitude. Velocity increases from the interior to a maximum at the southern confluence, some 550 km inland from the front. On Mellor Glacier the greatest velocity is about 800ma–1. The overall maximum value in the confluence is found further east on Lambert Glacier, with a value of about 930 ma–1 derived from feature tracking in Landsat TM images. East of Lambert Glacier and the ice shelf, there is a long band of ice with low velocity, separating the fast-flowing ice from the edge of Mawson Escarpment. South of the grounding zone this band is about 22 km wide, and to the north it is about 5–7 km wide. The flow conditions and surface characteristics visible in satellite images suggest that this slow band may be a relatively thinner apron of ice partly grounded on a subglacial rock sill.
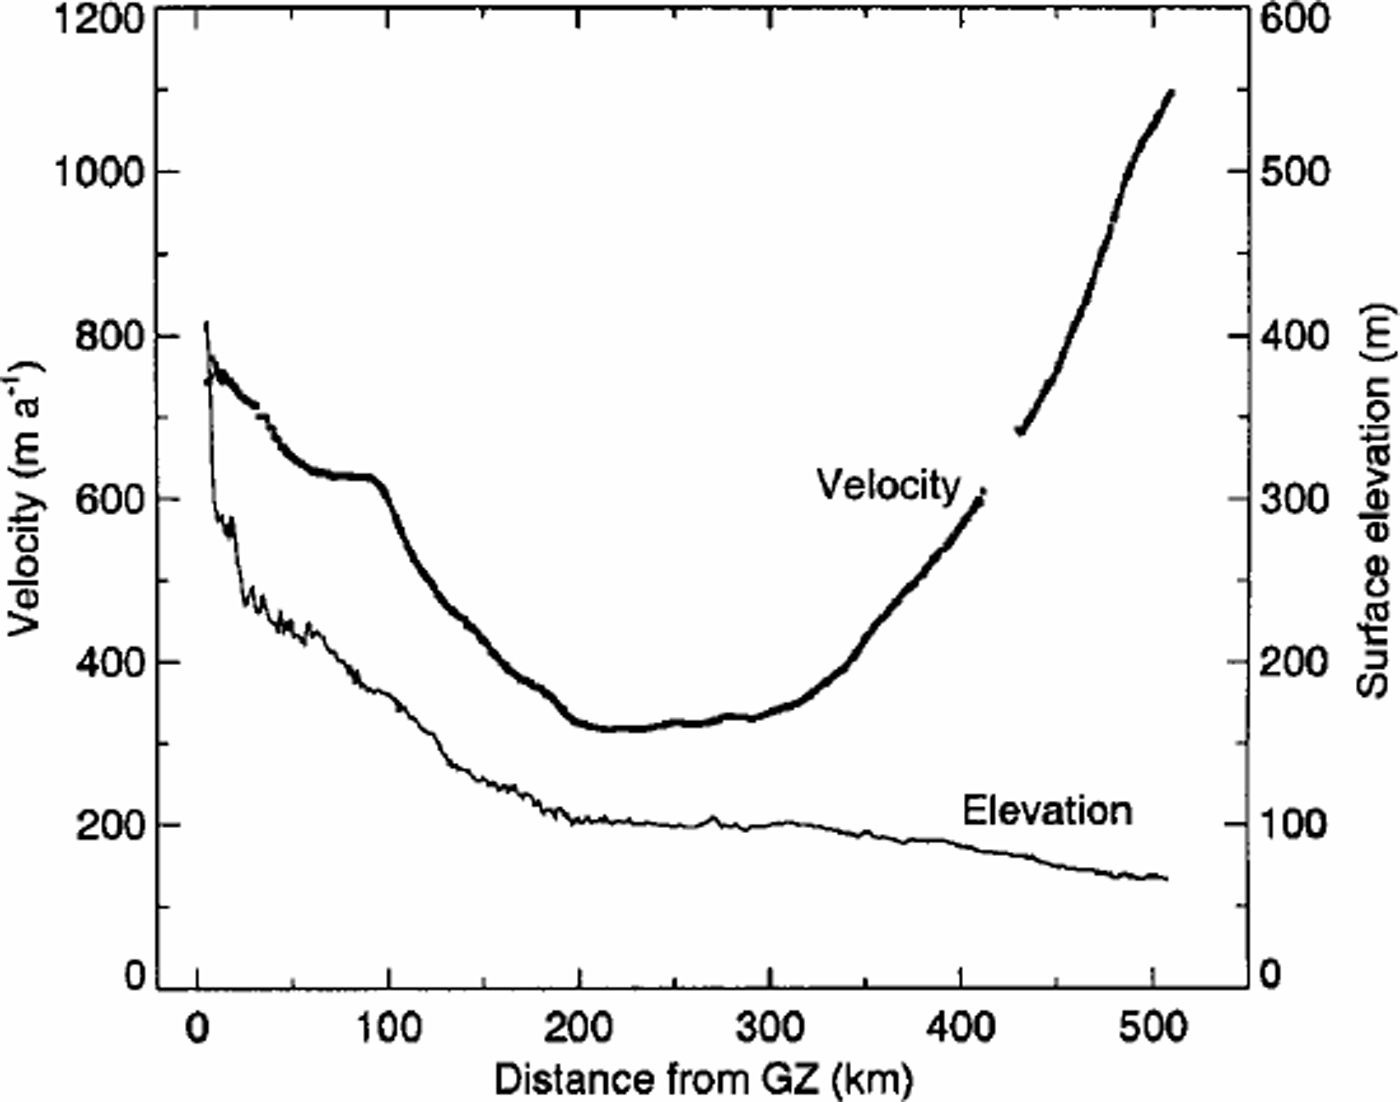
Figure 4 shows the smoothed velocity values along the centre-line profile for the Mellor Glacier flow-band, together with the surface elevation profile extracted from a digital elevation model (DEM) of the surface derived from satellite radar altimeter measurements (Reference Fricker, Hyland, Coleman and YoungFricker and others, 2000). It illustrates the general trend in velocity in the main streams along the shelf. From the southern end of the shelf, the velocity decreases downstream as far as a low-velocity section from 200 to 350 km where the values remain between 300 and 350 ma–1, then increases to a maximum at the front. Velocity varies considerably across the front from lower values, in the range 300–500ma–1, at each side to a maximum of 1300–1350ma–1 in the central section. This section of the front corresponds to a flow-band formed from ice that flows across the southwest margin of the ice shelf south of Jetty Peninsula, and from Fisher Glacier. Figure 4 shows that the velocity varies smoothly along the Mellor Glacier band, with departures from the general trend where the main stream flows north of Mawson Escarpment (100 km), and east of the large rumple in the neighbouring Fisher Glacier band (210 km; R in Fig. 3). Maximumvelocity on the Mellor Glacier band at the front is 1100–1200ma–1 (interpolated from Figure 2 and confirmed by feature tracking in Landsat TM and European Remote-sensing Satellite (ERS) SAR images). The variation of velocity along the longitudinal profile (Fig. 4) from the grounding zone to the shelf front gives a transit time of 1100 years.
Longitudinal profiles of velocity and surface elevation along the centre line of the Mellor Glacier flow-band (Fig. 1). The surface elevation is taken from the 1km DEM of the Lambert Glacier–Amery Ice Shelf system generated from radar altimeter data (Reference Fricker, Hyland, Coleman and YoungFricker and others, 2000). The velocity values are sampled from the distribution in Figure 2.
Strain-Rate Distributions
The spatial distribution of the transverse shear strain rate (Fig. 3) together with a summary of the general features of the longitudinal and transverse strain-rate pattern are now used to characterize the flow pattern in the ice shelf and to infer some of its deformation properties. The discussion focuses on the body of the ice shelf and excludes areas about the confluence of a tributary with the shelf where the strain-rate pattern can be quite complex.
The transverse shear strain rate exhibits greatest variability across the flow direction, and tends to vary slowly and smoothly along the flow direction of the shelf. Themagnitude increases from near zero around the mid-line to large values in the shear margins close to the outer edges. Values are largest in the shear margins in the southern section of the shelf (0–150 km), where they sometimes exceed 100610–3 a–1 along the east margin. Farther north, values in the shear margins are generally smaller, sometimes exceeding 25610–3 a–1. The strongest values occur on the west besideJetty Peninsula, and on the east in a narrowb and passing the north end of Gillock Island.
The high values of strain rate in the shear margins have significant implications for the internal properties of the ice shelf. The very high values in the southern section imply considerable dissipation of energy as strain heating distributed through the thickness of the shelf. This heating within the shear margins raises the temperature of the core of the shear margins, and results in significant horizontal temperature gradients out of the margins (e.g. Reference Harrison, Echelmeyer and LarsenHarrison and others, 1998). In addition, ice within the shear margins accumulates very large strains as it is carried downstream with the movement. The strain accumulated for a given distance travelled depends on the strain rate and the velocity. In general terms, about 20% strain would be accumulated within 2–10 km, and 80% within 10–30km. This is more than sufficient strain to establish a very strong crystal-orientation fabric consistent with simple shear in a vertical plane along the margin (Reference Budd and JackaBudd and Jacka, 1989). Any of the shear margins are continuous over distances of many tens of kilometres, and often 4100 km, so that total accumulated strain in simple shear will be many times the values given above. Ice with this preferred crystal orientation is advected downstreamwith the motion. When a flow-bandfroma tributary glacier is added to the side of the shelf, ice that was in the outer shear margin upstream of the confluence becomes contained within the body of the shelf downstream of the confluence. In this way bands of ice with shear deformation properties that are enhanced compared to adjacent ice become incorporated into the body of the shelf well away from the outer margins.
The effect of ice with enhanced shear deformation properties on the strain-rate distribution can be observed in Figure 3. In the middle section of the shelf (150–350km), the strain distribution exhibits a distinct longitudinal pattern. There is a core, about 30 km wide, with very small strain rates (typically 50.5610–3 a–1 in magnitude), aligned along the mid-line. To the east of the core there is a broad band of generally low but significant strain rates, and within this band there are narrower, more subtle longitudinal bands. Downstream of the tributary at 240 km, there is the outer shear margin with strain-rate values in the range 7–12610–3 a–1, which continues past Gillock Island. About 12 km inside of this there is a more subtle band with values of 3–6610–3 a–1. The inner part of the broad band, with values of 1–3610–3 a–1, is a continuation of a band coming from the shear margin that ends at Clemence Massif (150km). Similar but weaker banding can also be found on most of the west side of the shelf.
The transverse shear strain rate exhibits a distinctly different pattern in the northern section of the shelf (350–550 km) compared to the middle section. Here, the magnitude over most of the section is 1–3610–3 a–1, larger at the edges. Even where the magnitude is 51610–3 a–1 in Figure 3, most are close to 1610–3 a–1.There is only a narrow core where the magnitude is close to zero, compared to the wide core in the middle section. The occurrence of significant shear strain rates where the shear stress is expected to be small is attributed to the effect of significant longitudinal or transverse stresses on the shear deformation through their contribution to the octahedral stress (Reference Budd and JackaBudd and Jacka, 1989). The presence of these significant stresses is implied by the longitudinal and transverse strain rates.
The longitudinal strain rate is around zero between 200 and 300 km, then averages about +5610–3 a–1 to the front (Fig. 4). Within that trend, it exhibits a maximum of about +8610–3 a–1 in a band across the shelf some 80 km from the front, and decreases to small values at the front. This behaviour is consistent with results obtained by Reference KingKing (2001) from his re-analysis of terrestrial surveys, and contrasts with the results of Budd and others (1982) who reported the longitudinal strain rate increasing at the front. The transverse strain rate is small for most of the ice shelf, and the magnitude rarely exceeds 1610–3 a–1. The transverse strain rate becomes significant within the front 75 km of the ice shelf where there is considerable lateral spreading, and the value increases to between +3 and +8 £10–3 a–1. Significant transverse strain at the front contributes to fracturing, and development of longitudinal rifts. A central longitudinal rift that is a probable site of future iceberg calving (Reference Fricker, Hyland, Coleman and YoungFricker and others, 2002) has a lateral spreading of +40610–3 a–1.
Thus the longitudinal strain rate is significant in the northern section (350–550km), and larger than the transverse shear strain rate except at the edges. Where the longitudinal strain starts to decrease towards the front, the transverse strain rate becomes significant and increases to the front. Therefore, either the longitudinal or transverse strain-rate components, or both, are larger than the shear strain rate, which indicates comparable or stronger corresponding stress components, and hence significant enhancement of the deformation through the octahedral shear stress term. This is consistent with the gradient in velocity along the northern transverse profile (Fig. 1) away from the central velocity maximum to smaller values at the edges reported by Budd and others (1982), and confirmed by our velocity estimates. This behaviour contrasts with the situation in the middle section of the shelf (150–350km).There the magnitudes of all strain-rate components are near zero in the central core of the shelf. In addition, there has been considerable longitudinal strain upstream of there. If there is a preferred crystal-orientation fabric in the ice within the core, it is likely to counter rather than enhance any shear deformation. The core is moving like a stiff plug of ice. This is consistent with the almost constant velocity across the southern transverse profile (Budd and others, 1982).
Conclusion
We have derived a dense set of velocity estimates over the Amery Ice Shelf and adjacent grounded ice sheet, and, from these, values of the horizontal components of strain rate and a smoothed velocity field with higher precision. Velocity varies considerably along the shelf from a maximum around 800ma–1 at the southern end, decreasing to a low-velocity middle section with values of 300–350ma–1, then increasing to a maximum of 1350 ma–1 at the centre of the front. Velocities generated in this work generally match well with velocities from terrestrial surveys, to within the precisions and biases mentioned above. The spatial distribution of the transverse shear strain rate clearly shows the location and longitudinal extent of shear margins along major ice streams. Extreme values exceeding 100610–3 a–1 occur with-in the southern section of the shelf, while elsewhere values in the margins are lower.
The spatial patterns in the distribution of transverse shear strain rate offer evidence that two different modes of shear strain enhancement operate within the body of the shelf. One mode is related to the presence of ice with a strong preferred crystal-orientation fabric consistent with simple shear parallel to the flow direction. It is exhibited as narrow longitudinal bands with relatively higher strain rate contained within a broad band of lower strain rate. Ice within the narrow bands has been advected downstream with the movement of the shelf from its origin in she armargins upstream where it developed the strong fabric. The other mode is related to the influence of significant values of other stress components on shear deformation in the northern section of the shelf. Here the transverse shear strain rates in the central core of the shelf have low but significant magnitudes, where near-zero values would be expected. In this section of the shelf, the longitudinal and transverse strain rates are significant and larger than the shear strain rate, indicating significant values of the longitudinal and transverse stresses. These stress components lead to anenhancement of the transverse shear strain rate above what would be expected through their effect on the octahedral shear stress term.
Acknowledgements
RADARSAT SAR data were provided under contract USAP-0000-0053 for NASA Research Announcement NRA 98-OES-03 (principal investigator N. Young). RADARSAT SAR data are © Canadian Space Agency 1997. Processing of the SAR data and interferometric analysis was carried out with software. This statement does not constitute an endorsement of the software package, but we do wish to acknowledge the helpful comments and advice that we received from U. Wegmuller and C. Werner. We also wish to thank an anonymous reviewer and R. Coleman for their constructive comments.
Budd, W. F., M. J. Corry and T.H. Jacka. 1982. Results from the Amery Ice Shelf Project. Ann. Glaciol., 3, 36–41.



