1 Introduction
Laminar flow technology is recognized as a potential breakthrough for economically viable and environmentally friendly supersonic aircraft. Benefits of extended laminar flow include: reduced skin friction drag, i.e. lower fuel burn, increased range, reduced aircraft weight and reduced emissions and ozone impact, especially in the high altitude regime of supersonic flight. Additionally, the lower weight implies both a weaker sonic boom signature at the ground level and reduced acoustic emissions during take-off and landing. Reduced skin friction of the laminar flow also translates into reduced aerodynamic heating of wing and empennage surfaces. Therefore, the prediction and control of transition onset in high-speed flows is a key issue for optimizing the performance of next generation supersonic vehicles.
At low levels of background disturbances, transition is initiated by the exponential amplification of linearly unstable eigenmodes, i.e. modal instabilities of the laminar boundary layer. In two-dimensional boundary layers, different instability mechanisms dominate the exponential growth phase depending on the flight speed. Planar, i.e. two-dimensional, Tollmien–Schlichting (TS) waves are the most unstable in the incompressible regime, whereas oblique first-mode instabilities correspond to the most amplified disturbances in supersonic boundary layers. The hypersonic regime is again dominated by the growth of planar acoustic waves of the second mode, i.e. Mack-mode type (Mack Reference Mack1984). Focusing on the supersonic regime, Fasel, Thumm & Bestek (Reference Fasel, Thumm, Bestek, Kral and Zang1993) conducted a direct numerical simulation of the early transition stages for a Mach 1.6 boundary layer and showed that a pair of oblique modes with equal but opposite wave angle interact nonlinearly and lead to transition. Subsequently, this oblique breakdown mechanism was studied by means of the nonlinear form of the parabolized stability equations (PSE) by Chang & Malik (Reference Chang and Malik1994) and high Reynolds number asymptotic theory by Leib & Lee (Reference Leib and Lee1995). Chang & Malik (Reference Chang and Malik1994) confirmed that the primary breakdown mechanism in supersonic boundary layers constitutes a wave–vortex triad formed by the two oblique modes and a stationary streamwise vortex mode. The linear amplification of oblique waves leads to nonlinear interactions that result in a vortex mode with one half of the spanwise wavelength corresponding to the oblique waves. The stationary vortex mode is converted into stationary streamwise streaks via a transient growth mechanism as described by Laible & Fasel (Reference Laible and Fasel2016). The laminar–turbulent transition onset begins when higher harmonics are also generated by nonlinear interactions, which grow rapidly to reach amplitudes of the order of the amplitude of primary oblique waves. The theoretical analysis by Leib & Lee (Reference Leib and Lee1995) confirmed that the explosive growth of oblique instability waves is a generic feature of instability development in both insulated- and cooled-wall supersonic boundary layers. More recent numerical studies (e.g. Mayer, Laible & Fasel Reference Mayer, Laible and Fasel2011a ; Mayer, Von Terzi & Fasel Reference Mayer, Von Terzi and Fasel2011b ; Mayer et al. Reference Mayer, Fasel, Choudhari and Chang2014) have confirmed that in a supersonic boundary layer, the oblique-mode transition scenario requires lower initial amplitudes than other transition mechanisms, as fundamental or subharmonic secondary instability mechanisms initiated by the linear growth of the two-dimensional mode. Therefore, oblique breakdown is the most likely scenario for natural transition in low-disturbance environments.
In the presence of sufficiently strong external disturbances in the form of either free-stream turbulence (FST) or three-dimensional wall roughness, streamwise streaks involving alternately low and high streamwise velocity have been observed to appear in incompressible boundary layers (Klebanoff Reference Klebanoff1971). Further research in the incompressible regime has shown that high-amplitude streaks can become unstable to shear layer instabilities that lead to a form of ‘bypass transition’ (Andersson et al. Reference Andersson, Brandt, Bottaro and Henningson2001). When the streak amplitudes are low enough to avoid these instabilities, i.e. when the background disturbance level is moderate, the streaks can actually reduce the growth of the TS waves as documented in both experimental and theoretical studies (Boiko et al. Reference Boiko, Westin, Klingmann, Kozlov and Alfredsson1994; Cossu & Brandt Reference Cossu and Brandt2002; Bagheri & Hanifi Reference Bagheri and Hanifi2007). The stabilizing effect of stationary streaks in low-speed boundary layers has been used in passive flow control strategies to demonstrate delayed onset of transition by using micro vortex generators (MVGs) along the body surface (Fransson et al. Reference Fransson, Talamelli, Brandt and Cossu2006; Shahinfar et al. Reference Shahinfar, Sattarzadeh, Fransson and Talamelli2012).
Among the limited experimental research focusing on the tripping of high-speed boundary-layer flows by using three-dimensional roughness elements is the investigation of Holloway & Sterrett (Reference Holloway and Sterrett1964), who used a single row of spherical roughness elements partially recessed within a flat-plate model in the NASA Langley 20-Inch Mach 6 tunnel, which has a conventional free-stream turbulence level. Data for multiple boundary-layer-edge Mach numbers were obtained by varying the plate mounting angle. They found that, for cases with the smallest roughness diameters, transition was delayed for Mach numbers larger than 3.7, which approximately corresponds to the lower bound for planar second mode dominance over oblique first-mode instabilities in a flat-plate boundary layer at typical wind tunnel conditions. Therefore, their results suggest that roughness-induced streaks have a stabilizing influence on Mack-mode waves, but not on oblique first-mode instabilities at supersonic boundary-layer-edge conditions. As the roughness height was further increased, the transition onset location moved upstream closer to the roughness elements. Recent work (Choudhari, Li & Edwards Reference Choudhari, Li and Edwards2009; Paredes, Choudhari & Li Reference Paredes, Choudhari and Li2016a ,Reference Paredes, Choudhari and Li c ) indicates that the earlier onset of transition can be attributed to the onset of high-frequency instabilities in the streaky boundary layer.
The development of roughness-induced streaks is strongly dependent on the details of the roughness element shape, height and spanwise or azimuthal spacing. The optimal growth theory provides a conceptually simple model that can characterize the transient algebraic growth and subsequent slow decay of boundary-layer streaks due to arbitrary initial disturbances, as well as providing an upper bound on the energy amplification ratio; see Schmid (Reference Schmid2007) for a review. The transient growth arises as a result of the non-normality of disturbance equations, and the optimal growth theory seeks to maximize the disturbance growth between a selected pair of streamwise locations. Regardless of the flow Mach number, the disturbances experiencing the highest magnitude of transient growth have been found to be stationary streaks that arise from initial perturbations that correspond to streamwise vortices. The secondary instability of optimal streaks with moderate-to-high finite initial amplitudes in supersonic and hypersonic boundary layers has been addressed in recent works by the present authors (Paredes et al. Reference Paredes, Choudhari and Li2016a ,Reference Paredes, Choudhari and Li c ). They found that the mode shapes associated with secondary instabilities were similar to those found in low-speed boundary layers (Andersson et al. Reference Andersson, Brandt, Bottaro and Henningson2001). However, while secondary instability modes of both fundamental and subharmonic spanwise wavelengths exhibit comparable amplification factors in low-speed flows, the secondary instability with subharmonic spanwise wavelengths controls the onset of transition in supersonic flows for moderate streak amplitudes. The rather unique behaviour of subharmonic mode amplification is shown to be related to the destabilizing influence of small-amplitude streaks on oblique first-mode disturbances, which tend to have longer spanwise wavelengths than those of the optimal stationary disturbances. The destabilization of long wavelength first-mode disturbances was also observed in the direct numerical simulation (DNS) results of Choudhari et al. (Reference Choudhari, Li, Chang, Norris and Edwards2013) behind isolated roughness elements. These computational results may explain the experimental findings of Holloway & Sterrett (Reference Holloway and Sterrett1964) at supersonic boundary-layer-edge conditions, because they found an upstream movement of the transition front with any roughness height at a supersonic edge Mach number of 4.8.
The introduction of streaks in a supersonic boundary layer, in which the transition onset is driven by oblique first-mode instabilities, is expected to have a destabilizing influence and promote transition because of the following reasons: (i) the nonlinear interaction of oblique first-mode wave pairs form stationary streamwise streaks; (ii) optimal growth streamwise streaks have been found to destabilize subharmonic first-mode waves (Paredes et al. Reference Paredes, Choudhari and Li2016c ); (iii) the wake of discrete roughness elements have been experimentally observed to promote transition by Holloway & Sterrett (Reference Holloway and Sterrett1964). However, the effect of lower streak amplitudes, i.e. stable or at most weakly unstable streaks, on the growth of the entire family of oblique first-mode instabilities has not been studied previously. The present work focuses on this problem with the goal of developing a more thorough knowledge base for transition prediction in the presence of stationary streaks and potentially expand the range of available techniques for transition control at supersonic edge Mach numbers.
To that end, we study the effect of a periodic array of finite-amplitude streaks on the dominant instability waves in two-dimensional boundary layers at supersonic Mach numbers, i.e. the oblique first-mode waves. Similar to Paredes et al. (Reference Paredes, Choudhari and Li2016c
,Reference Paredes, Choudhari, Li and Chang
d
), the basic state used for the present study corresponds to an adiabatic flat plate at zero angle of incidence in a supersonic free-stream flow of Mach number 3 and unit Reynolds number
 $Re^{\prime }=10^{6}~\text{m}^{-1}$
. The analysis presented herein is based on boundary-layer streaks resulting from the transient growth of an optimal initial perturbation excited near the leading edge. The perturbed three-dimensional boundary layer is used as basic state for the subsequent modal instability analysis by means of the plane-marching PSE.
The paper is organized as follows. Section 2 provides a summary of the plane-marching PSE theory. The results are presented in § 3. First, the perturbed three-dimensional boundary layers composed of the two-dimensional boundary layer plus the finite-amplitude optimal perturbations are analysed. Subsequently, the instability characteristics of the oblique first-mode waves for such basic states are studied, as well as the overall effect of the streaks on the transition onset location. Finally, conclusions are presented in § 4.
2 Theory
This section introduces the methodologies used in this paper. The linear optimal growth theory based on the PSE and the application to the Mach 3 adiabatic flow plate boundary layer was presented by Paredes et al. (Reference Paredes, Choudhari, Li and Chang2016d ). Following the same methodology of Paredes et al. (Reference Paredes, Choudhari and Li2016c ), the linearly optimal perturbation that results in maximum energy gain at a specified downstream position is used as inflow condition for the parabolic integration of the stationary, nonlinear, plane-marching PSE (or, equivalently, perturbation form of the parabolic Navier–Stokes equations) to obtain a three-dimensional, spanwise-periodic perturbed boundary-layer flow. The modal instability characteristics of this perturbed flow are studied by using the linear form of the plane-marching PSE. The nonlinear evolution of moderate-to-high amplitude streaks and their instability characteristics is studied by Paredes et al. (Reference Paredes, Choudhari and Li2016c ). The present paper focuses on the interaction of stable and weakly unstable streaks with the first-mode boundary-layer instability.
2.1 Plane-marching PSE
 $$\begin{eqnarray}\tilde{\boldsymbol{q}}(x,y,z,t)=\mathop{\sum }_{n=-N}^{N}\hat{\boldsymbol{q}}_{n}(x,y,z)\exp \left[\text{i}\left(\int _{x_{0}}^{x}\unicode[STIX]{x1D6FC}_{n}(x^{\prime })\,\text{d}x^{\prime }-n\unicode[STIX]{x1D714}t\right)\right]+\text{c.c.}\end{eqnarray}$$
The suitably non-dimensionalized, Cartesian coordinate system
 $(x,y,z)$
denotes streamwise, wall-normal and spanwise coordinates and
 $(u,v,w)$
represent the corresponding velocity components. Density and temperature are denoted by
 $\unicode[STIX]{x1D70C}$
and
 $T$
. The vector of basic state fluid variables is
 $\bar{\boldsymbol{q}}(x,y,z)=(\bar{\unicode[STIX]{x1D70C}},\bar{u},\bar{v},\bar{w},\bar{T})^{\text{T}}$
, the vector of perturbation fluid variables is
 $\tilde{\boldsymbol{q}}(x,y,z,t)=(\tilde{\unicode[STIX]{x1D70C}},\tilde{u} ,\tilde{v},\tilde{w},\tilde{T})^{\text{T}}$
and the vector of amplitude functions is
 $\hat{\boldsymbol{q}}(\unicode[STIX]{x1D709},\unicode[STIX]{x1D702})=(\hat{\unicode[STIX]{x1D70C}},\hat{u} ,\hat{v},{\hat{w}},\hat{T})^{\text{T}}$
. The streamwise wavenumber is
 $\unicode[STIX]{x1D6FC}$
and
 $\unicode[STIX]{x1D714}$
is the angular frequency of the perturbation. In the present study, the spanwise direction is periodic, and the dimension of the spanwise domain is equal to the wavelength of the instability wave
 $\unicode[STIX]{x1D706}$
. The ratio
 $\unicode[STIX]{x1D706}/\unicode[STIX]{x1D706}_{ST}$
can be arbitrary in general; however, it has been assumed to be a suitable rational number to facilitate computations with periodic boundary conditions. The wave angle of the instability wave is defined by
 $\unicode[STIX]{x1D719}=\arctan (\unicode[STIX]{x1D6FD}/\text{Re}(\unicode[STIX]{x1D6FC}))$
, where
 $\unicode[STIX]{x1D6FD}=2\unicode[STIX]{x03C0}/\unicode[STIX]{x1D706}$
.
Substituting (2.1) into the Navier–Stokes (NS) equations, and neglecting the viscous streamwise derivatives of the slowly varying amplitude function
 $\hat{\boldsymbol{q}}$
, the plane-marching PSE can be written in a compact form as
 $$\begin{eqnarray}\left(\unicode[STIX]{x1D647}_{n}+\unicode[STIX]{x1D648}_{n}\frac{\unicode[STIX]{x2202}}{\unicode[STIX]{x2202}x}\right)\hat{\boldsymbol{q}}_{n}(x,y,z)=\boldsymbol{F}_{n}(x,y,z)\exp \left(-\text{i}\int _{x_{0}}^{x}\unicode[STIX]{x1D6FC}_{n}(x^{\prime })\,\text{d}x^{\prime }\right),\end{eqnarray}$$
where
 $\boldsymbol{F}_{n}$
is the Fourier component of the total forcing
 $\boldsymbol{F}$
that contains the nonlinear terms. The entries of the coefficient matrices for
 $\unicode[STIX]{x1D647}_{n}$
and
 $\unicode[STIX]{x1D648}_{n}$
and vector
 $\boldsymbol{F}$
are found in appendix A. A more detailed description of the method is given by Paredes (Reference Paredes2014) and Paredes et al. (Reference Paredes, Hanifi, Theofilis and Henningson2015).
Similarly to the classical, line-marching PSE, the system of equations of the plane-marching PSE (2.2) is not fully parabolic due to the term
 $\unicode[STIX]{x2202}\hat{p}/\unicode[STIX]{x2202}x$
in the streamwise momentum equation (Haj-Hariri Reference Haj-Hariri1994; Li & Malik Reference Li, Malik and Kobayashi1994, Reference Li and Malik1996, Reference Li and Malik1997; Andersson, Henningson & Hanifi Reference Andersson, Henningson and Hanifi1998; Broadhurst & Sherwin Reference Broadhurst and Sherwin2008). However, for the purely stationary disturbances of interest in this work,
 $\unicode[STIX]{x2202}\hat{p}/\unicode[STIX]{x2202}x$
can be dropped from the equations because it is of higher order and can be neglected without any loss of accuracy. For the traveling instability waves that are also of interest in this work, the streamwise resolution is set such that
 $\unicode[STIX]{x0394}x>1/|\unicode[STIX]{x1D6FC}|$
to allow well posed parabolic integration of the PSE (Li & Malik Reference Li and Malik1997).
To follow the development of finite-amplitude optimal disturbances (i.e. streaks), the nonlinear formulation of the plane-marching PSE is used (Paredes et al.
Reference Paredes, Hanifi, Theofilis and Henningson2015). For the stationary disturbances of interest in this paper,
 $N=0$
and
 $\unicode[STIX]{x1D6FC}_{0}=0$
. Because of this, a single mode is integrated by using an implicit formulation to facilitate the convergence of the solution for moderate streak amplitudes (Paredes et al.
Reference Paredes, Choudhari and Li2016a
; Paredes, Choudhari & Li Reference Paredes, Choudhari and Li2016b
; Paredes et al.
Reference Paredes, Choudhari and Li2016c
; Paredes, Choudhari & Li Reference Paredes, Choudhari and Li2017). Subsequently, the linear form of the plane-marching PSE, which are recovered from (2.2) by setting
 $\boldsymbol{F}=0$
, is used herein to study the linear, non-parallel stability characteristics of the modified basic state corresponding to the sum of the flat-plate boundary layer and the finite-amplitude optimal disturbance. The advantage of using the plane-marching PSE with respect to the partial-differential-equation (PDE) based two-dimensional eigenvalue problem (EVP) is that the plane-marching PSE account for the non-parallel development of the basic state. The quasiparallel assumption can lead to wavenumber and growth rate predictions with a relative error of approximately 10 % when compared to plane-marching PSE or full NS results, as shown in similar problems, such as the wake behind an isolated roughness element in a supersonic boundary layer (De Tullio et al.
Reference De Tullio, Paredes, Sandham and Theofilis2013). Nevertheless, the solution of the PDE-based EVP provides a convenient means to obtain the shape function, wavenumber and damping/growth rate required as initial conditions for the plane-marching PSE integration.
The onset of laminar–turbulent transition is estimated using the logarithmic amplification ratio, the so-called
 $N$
-factor, based on the Mack’s energy norm
 $E$
(Mack Reference Mack1969) and relative to the lower bound location
 $x_{lb}$
where the disturbance first becomes unstable,
 $$\begin{eqnarray}N=-\int _{x_{lb}}^{x}\unicode[STIX]{x1D6FC}_{i}(x^{\prime })\,\text{d}x^{\prime }+1/2\ln [\hat{E}(x)/\hat{E}(x_{lb})],\end{eqnarray}$$
where
 $$\begin{eqnarray}E(x)=\int _{z}\int _{y}\tilde{\boldsymbol{q}}^{H}\unicode[STIX]{x1D648}_{E}\tilde{\boldsymbol{q}}\,\text{d}y\,\text{d}z,\end{eqnarray}$$
and
 $$\begin{eqnarray}\unicode[STIX]{x1D648}_{E}=\text{diag}\left[\frac{\bar{T}(\unicode[STIX]{x1D709},\unicode[STIX]{x1D702})}{\unicode[STIX]{x1D6FE}\bar{\unicode[STIX]{x1D70C}}(\unicode[STIX]{x1D709},\unicode[STIX]{x1D702})M^{2}},\bar{\unicode[STIX]{x1D70C}}(\unicode[STIX]{x1D709},\unicode[STIX]{x1D702}),\bar{\unicode[STIX]{x1D70C}}(\unicode[STIX]{x1D709},\unicode[STIX]{x1D702}),\bar{\unicode[STIX]{x1D70C}}(\unicode[STIX]{x1D709},\unicode[STIX]{x1D702}),\frac{\bar{\unicode[STIX]{x1D70C}}(\unicode[STIX]{x1D709},\unicode[STIX]{x1D702})}{\unicode[STIX]{x1D6FE}(\unicode[STIX]{x1D6FE}-1)\bar{T}(\unicode[STIX]{x1D709},\unicode[STIX]{x1D702})M^{2}}\right].\end{eqnarray}$$
The transition onset is assumed to occur when the peak
 $N$
-factor reaches a specified value. Due to the lack of relevant experimental data, transition
 $N$
-factor thresholds are assumed to be identical for the unperturbed and perturbed boundary-layer flows. The receptivity characteristics are assumed to be equivalent for both cases because the optimal perturbations are introduced with very low initial amplitude that lead to an extended linear-like behaviour (as shown in the next section). Note that for the nonlinear cases, the energy measure
 $E(x)$
includes the contribution of the mean flow-distortion term.
To further understand the mechanism of instability modes, the production terms associated with the local kinetic energy transfer as a function of the streamwise location are calculated (Malik et al. Reference Malik, Li, Choudhari and Chang1999). The streamwise rate of change of the integrated kinetic energy at a given station is given by
 $$\begin{eqnarray}\frac{\unicode[STIX]{x2202}K}{\unicode[STIX]{x2202}x}(x)=P(x)-D(x),\end{eqnarray}$$
where
 $K$
is the kinetic energy of the disturbance, which is defined as
 $$\begin{eqnarray}K(x)=\int _{z}\int _{y}\bar{\unicode[STIX]{x1D70C}}(\tilde{u} \tilde{u} ^{c}+\tilde{v}\tilde{v}^{c}+\tilde{w}\tilde{w}^{c})\,\text{d}y\,\text{d}z,\end{eqnarray}$$
where the superscript
 $c$
denotes complex conjugate,
 $D$
is the viscous dissipation and
 $P$
is the production, which is given by
 $$\begin{eqnarray}P(x)=\int _{z}\int _{y}(Iu_{x}+Iu_{y}+Iu_{z}+Iv_{x}+Iv_{y}+Iv_{z}+Iw_{x}+Iw_{y}+Iw_{z})\,\text{d}y\,\text{d}z.\end{eqnarray}$$
The integrand terms are called production terms and can be written as
 $$\begin{eqnarray}\left(\begin{array}{@{}ccc@{}}Iu_{x} & Iu_{y} & Iu_{z}\\ Iv_{x} & Iv_{y} & Iv_{z}\\ Iw_{x} & Iw_{y} & Iw_{z}\end{array}\right)=\left(\begin{array}{@{}ccc@{}}-\text{Re}(\hat{u} \hat{u} ^{c})\bar{\unicode[STIX]{x1D70C}}\bar{u}_{x} & -\text{Re}(\hat{u} \hat{v}^{c})\bar{\unicode[STIX]{x1D70C}}\bar{u}_{y} & -\text{Re}(\hat{u} {\hat{w}}^{c})\bar{\unicode[STIX]{x1D70C}}\bar{u}_{z}\\ -\text{Re}(\hat{v}\hat{u} ^{c})\bar{\unicode[STIX]{x1D70C}}\bar{v}_{x} & -\text{Re}(\hat{v}\hat{v}^{c})\bar{\unicode[STIX]{x1D70C}}\bar{v}_{y} & -\text{Re}(\hat{v}{\hat{w}}^{c})\bar{\unicode[STIX]{x1D70C}}\bar{v}_{z}\\ -\text{Re}({\hat{w}}\hat{u} ^{c})\bar{\unicode[STIX]{x1D70C}}\bar{w}_{x} & -\text{Re}({\hat{w}}\hat{v}^{c})\bar{\unicode[STIX]{x1D70C}}\bar{w}_{y} & -\text{Re}({\hat{w}}{\hat{w}}^{c})\bar{\unicode[STIX]{x1D70C}}\bar{w}_{z}\end{array}\right).\end{eqnarray}$$
The sign of these terms indicates whether the local transfer of kinetic energy is stabilizing (negative) or destabilizing (positive). The viscous dissipation is not used because only the production terms are needed to judge the dominant nature of the instability mechanism associated with a given mode.
The plane-marching PSE are integrated along the streamwise coordinate by using second-order backward differentiation. A non-constant step along the streamwise direction is used. For the nonlinear computation of optimal disturbances, the streamwise grid consists of a distribution of points with constant increments of
 $\unicode[STIX]{x0394}R=10$
in the local Reynolds number based on the similarity scale, except for streamwise positions very close to the leading edge, i.e.
 $R<100$
, where the streamwise step had to be further reduced (Paredes et al.
Reference Paredes, Choudhari and Li2016c
). For the modal instability analysis, the streamwise grid is coarsened to study low-frequency modes to allow for the integration of the plane-marching PSE (Li & Malik Reference Li and Malik1997; Broadhurst & Sherwin Reference Broadhurst and Sherwin2008), although the resolution is checked for convergence in every case. Finite differences (Hermanns & Hernández Reference Hermanns and Hernández2008; Paredes et al.
Reference Paredes, Hermanns, Le Clainche and Theofilis2013) (FD-q) of sixth order are used for discretization of the wall-normal coordinate. The wall-normal direction is discretized using from
 $N_{y}=161$
to
 $N_{y}=241$
. The nodes are clustered toward the wall (Paredes et al.
Reference Paredes, Hermanns, Le Clainche and Theofilis2013). The clustering of points is dependent on the boundary-layer thickness, placing half of the grid points below
 $10\times \unicode[STIX]{x1D6FF}$
, where
 $\unicode[STIX]{x1D6FF}$
is the similarity scale. The far-field boundary coordinate is set at
 $y_{\infty }=150$
for the nonlinear computations, while it is set at
 $y_{\infty }=100\times \unicode[STIX]{x1D6FF}$
for the linear modal analysis. The spanwise direction is discretized with Fourier collocation points. Depending on the amplitude of the optimal growth perturbation, the number of spanwise points is varied from
 $N_{z}=16$
to
 $N_{z}=24$
per streak wavelength, which translates into a maximum of
 $N_{z}=288$
Fourier collocation points for the most demanding case. The same spanwise grids are used to compute the evolution of both stationary and non-stationary disturbances.
No-slip, isothermal boundary conditions are used at the wall, i.e.
 $\hat{u} =\hat{v}={\hat{w}}=\hat{T}=0$
. Notice that the isothermal boundary conditions may not be appropriate for all flow configurations. However, in the Mach
 $3$
case examined in this paper, the results were insensitive to the thermal boundary condition at the surface. The amplitude functions are forced to decay at the far-field boundary by imposing the Dirichlet conditions
 $\hat{\unicode[STIX]{x1D70C}}=\hat{u} ={\hat{w}}=\hat{T}=0$
. The disturbance mode shapes were monitored to ensure that the chosen far-field locations were satisfactory.
The number of discretization points in all three directions was varied to ensure that the relevant flow quantities were insensitive to further improvement in grid resolution. Verification of the present plane-marching PSE module against line-marching PSE and DNS results is shown in De Tullio et al. (Reference De Tullio, Paredes, Sandham and Theofilis2013) and Paredes et al. (Reference Paredes, Hanifi, Theofilis and Henningson2015).
3 Results
Transient growth results for a zero-pressure-gradient, adiabatic wall, flat-plate boundary layer at free-stream Mach number of
 $M=3$
were presented by Tumin & Reshotko (Reference Tumin and Reshotko2003) and Paredes et al. (Reference Paredes, Choudhari and Li2016c
,Reference Paredes, Choudhari, Li and Chang
d
). In the present work, the nonlinear evolution of the optimal growth disturbances is investigated for moderate streaks amplitudes over an extended streamwise domain. Given the focus on the interaction between modal instabilities and nonlinear transient growth disturbances, the outflow boundary of the extended domain is chosen to be at
 $Re_{x}=25\times 10^{6}$
, i.e. beyond the expected location of transition onset in a low-amplitude free-stream disturbance environment. The effect of the computed streaks on the oblique first-mode instabilities over a range of initial amplitudes of transient growth disturbance is investigated via linear, modal instability analysis of the perturbed, streaky boundary-layer flow.
Similar to Paredes et al. (Reference Paredes, Choudhari and Li2016c
,Reference Paredes, Choudhari, Li and Chang
d
), the mean flow solution used as the basic state is obtained from a numerical solution of the NS equations, which account for both the viscous–inviscid interaction near the leading edge and the weak shock wave emanating from that region. The NS mean flow was computed with the VULCAN-CFD code by using a low diffusion flux splitting scheme. A typical grid size was 1593 points in the streamwise direction and 513 points in the wall-normal direction. Previous computations (Li et al.
Reference Li, Choudhari, Chang, Kimmel, Adamczak and Smith2015; Paredes et al.
Reference Paredes, Choudhari, Li and Chang2016d
) have shown this grid size to be sufficient for accurate computation of the boundary-layer flow with this code and numerical scheme. The nose radius is set to
 $r_{n}=1~\unicode[STIX]{x03BC}\text{m}$
, and the free-stream unit Reynolds number is set to
 $Re^{\prime }=10^{6}~\text{m}^{-1}$
. The NS solution of a flat-plate boundary layer was obtained for
 $M=3$
,
 $T_{0}=333~\text{K}$
and adiabatic walls. The self-similar scale proportional to boundary-layer thickness is
 $\unicode[STIX]{x1D6FF}=\sqrt{x^{\ast }\unicode[STIX]{x1D708}_{r}^{\ast }/u_{r}^{\ast }}$
, where subscript
 $r$
denotes reference values and the superscript
 $\ast$
indicates dimensional values. The PSE are non-dimensionalized with
 $\unicode[STIX]{x1D6FF}_{1}$
, i.e. the value of
 $\unicode[STIX]{x1D6FF}$
at the final location corresponding to
 $x_{1}^{\ast }=L=1.0~\text{m}$
, where
 $L$
denotes the reference body length scale. Therefore, the Reynolds number introduced into the equations becomes
 $R_{1}=Re_{\unicode[STIX]{x1D6FF}_{1}}=\sqrt{Re_{L}}$
. In what follows,
 $\unicode[STIX]{x1D6FF}_{1}$
is used as reference length scale, although the streamwise location is written as
 $R=\sqrt{Re_{x}}=\sqrt{x^{\ast }u_{r}^{\ast }/\unicode[STIX]{x1D708}_{r}^{\ast }}$
.
3.1 Streak development
The nonlinear evolution of optimal disturbances is computed for several initial amplitudes by using the nonlinear plane-marching PSE. The initial disturbance profiles are obtained from the linear optimal growth analysis as described in Paredes et al. (Reference Paredes, Choudhari and Li2016c
). The initial and final locations of the optimization interval are
 $R_{0}=20$
(
 $x_{0}^{\ast }=0.0004~\text{m}$
) and
 $R_{1}=1000$
(
 $x_{1}^{\ast }=1.0~\text{m}$
). These values are chosen to obtain a streak amplitude evenly distributed along the streamwise domain. Also, this selection ensures the neutral points of first-mode instabilities to be downstream of the inlet location of the streak. The optimal spanwise wavenumber that corresponds to maximum energy gain over this interval is
 $\unicode[STIX]{x1D6FD}_{ST}=0.25$
, which corresponds to a spanwise wavelength of
 $\unicode[STIX]{x1D706}_{ST}=2\unicode[STIX]{x03C0}/\unicode[STIX]{x1D6FD}_{ST}=25.33$
or, equivalently,
 $\unicode[STIX]{x1D706}_{ST}=2.8\unicode[STIX]{x1D6FF}_{u,1}$
, where
 $\unicode[STIX]{x1D6FF}_{u,1}=9.04$
is the boundary-layer thickness based on
 $\bar{u}=0.995$
at
 $R_{1}=1000$
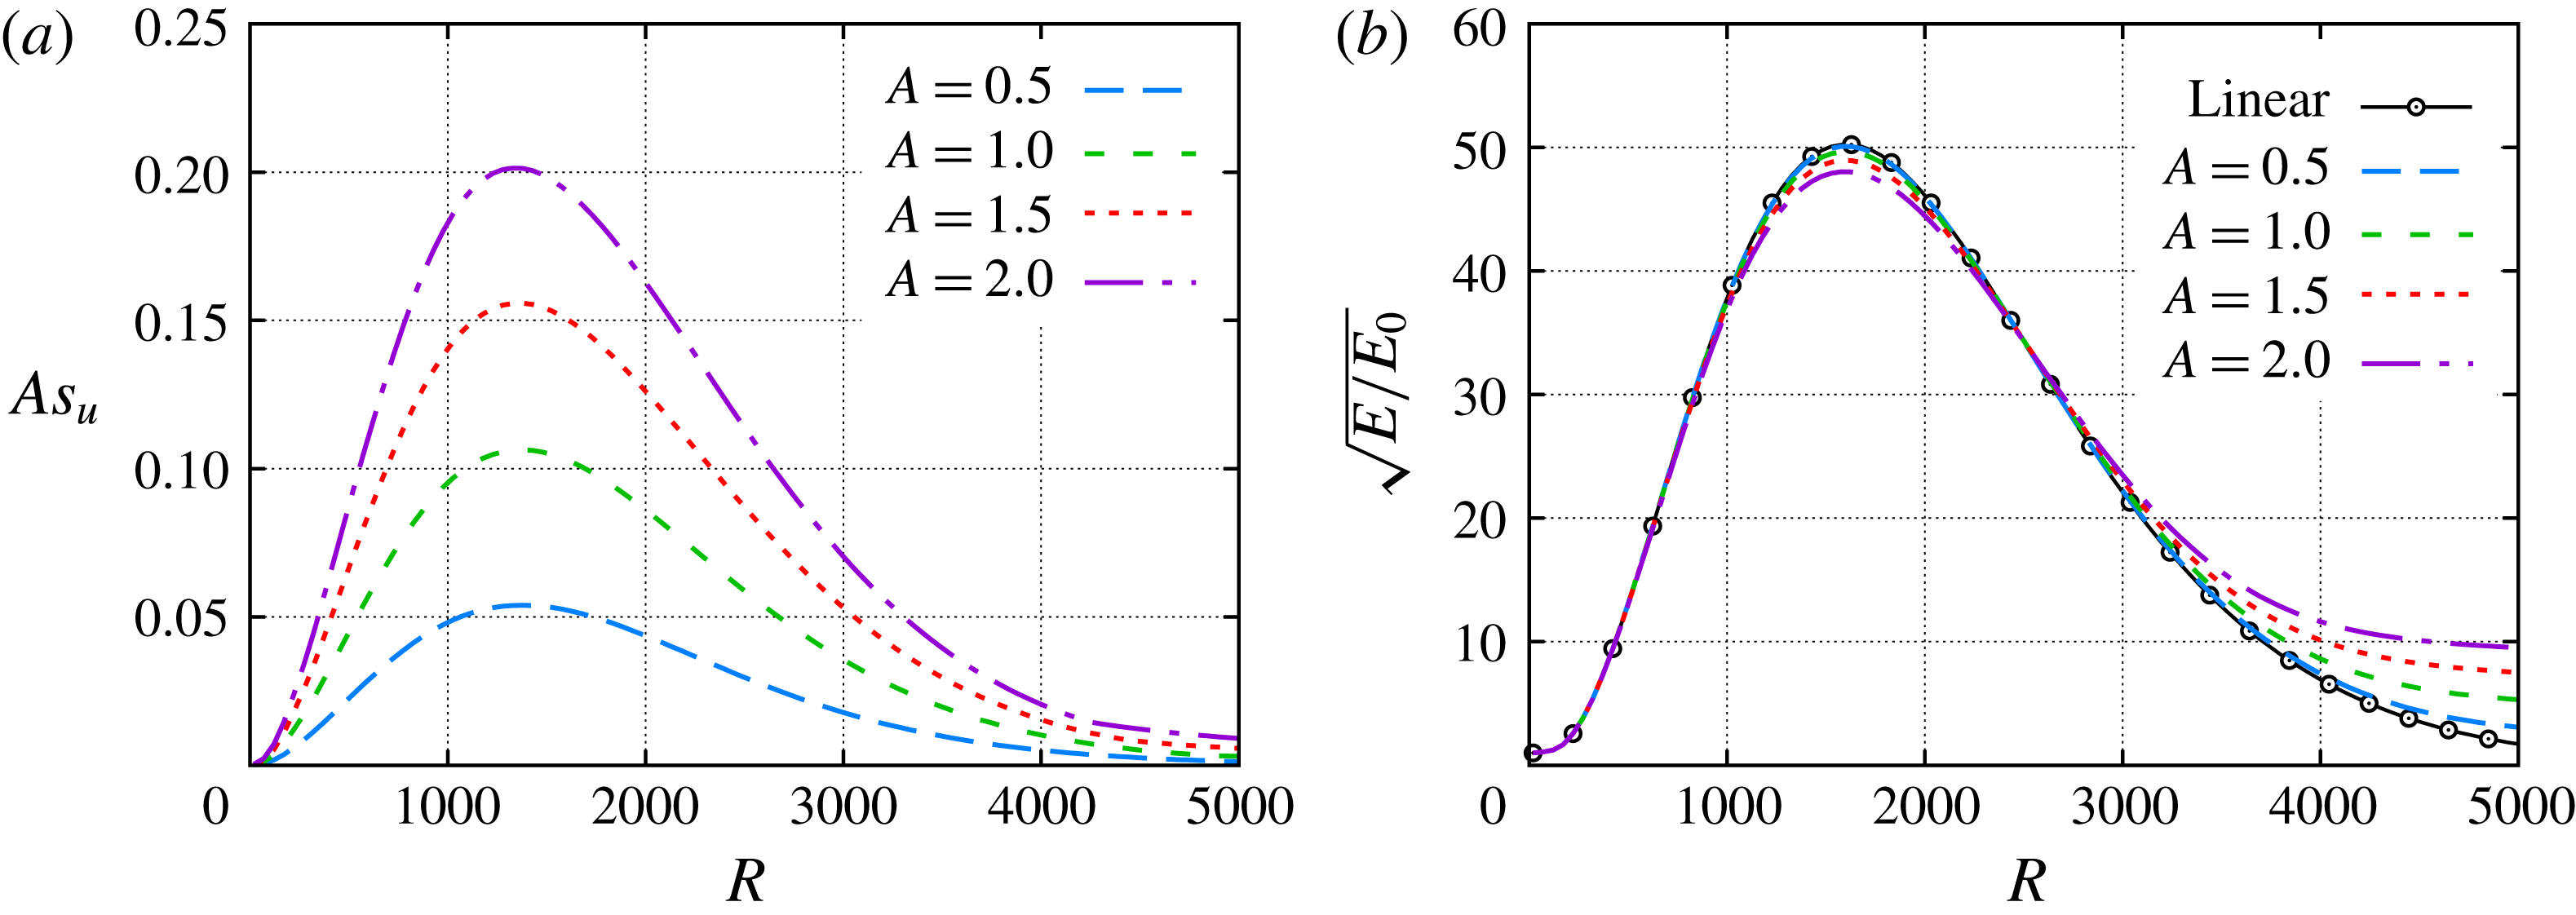
. Figure 1(a) shows the nonlinear evolution of streak amplitudes for the selected initial amplitudes. The local streak amplitude at a given streamwise location is defined by
 $As_{u}(x)=[\max _{y,z}(\tilde{u} )-\min _{y,z}(\tilde{u} )]/2$
. The effective initial amplitude parameter
 $A_{0}$
is defined in Paredes et al. (Reference Paredes, Choudhari and Li2016c
) as
 $$\begin{eqnarray}A_{0}=\sqrt{E_{0}}=A/\sqrt{G_{max}},\end{eqnarray}$$
where
 $G_{max}$
denotes the maximum gain achieved by a linear, i.e. small-amplitude, disturbance and is equal to
 $G_{max}=2398$
for the present case. The parameter
 $A$
corresponds to the square root of the perturbation energy,
 $A=\sqrt{E(x_{max,lin})}$
, where
 $x_{max,lin}$
denotes the location of maximum energy as predicted by linear transient growth theory. The nonlinear effects are rather small as seen figure 1(b), wherein the evolution of the energy gain for the nonlinear cases is compared with the linear case. The energy gain evolution of the streak with
 $A=0.5$
is nearly coincident with the linear curve, and as
 $A$
is increased, the peak energy gain continues to decrease by a slight magnitude. In addition, the energy gain curves diverge from the linear trend progressively earlier during the decaying portion of the curve. Overall, the evolution of the energy gain for the selected streak amplitude parameters is nearly coincident with the linear case over a long streamwise extent, at least up to
 $R\approx 1000$
even for the highest amplitude case
 $A=2.0$
. The streaks presented in figure 1(a,b) are a subset of the low-to-moderate amplitude streaks presented in Paredes et al. (Reference Paredes, Choudhari and Li2016c
). However, the streamwise domain is extended downstream to allow for the study of the interaction between the streaks and the oblique first modes. For the unperturbed boundary-layer flow, the
 $N$
-factors of 5 and 10 are achieved at
 $R=1596$
and
 $R=3226$
, respectively.
Evolution of (a) streak amplitudes based on
 $u$
,
 $As_{u}$
and (b) normalized energy,
 $\sqrt{E/E_{0}}$
, of finite-amplitude streaks initialized near the leading edge,
 $R_{0}=20$
, with
 $\unicode[STIX]{x1D6FD}=0.25$
.

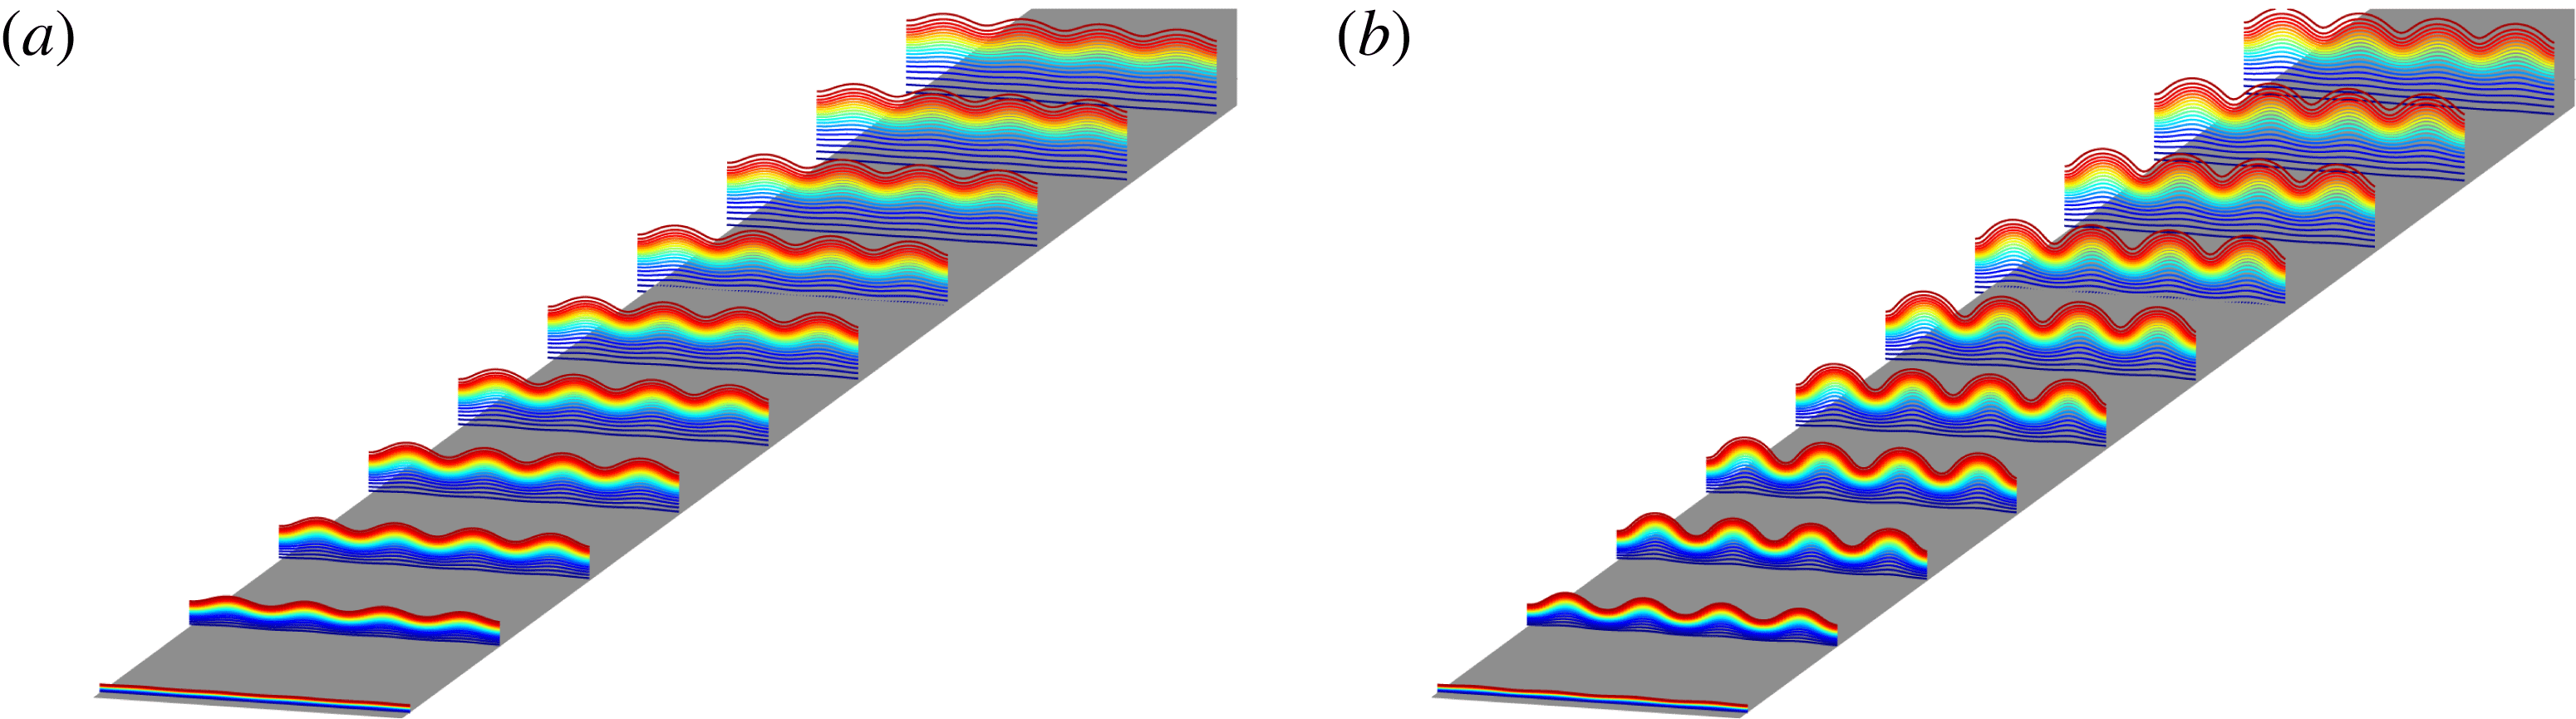
Figure 2(a,b) shows a three-dimensional view of the modified streaky boundary layers for
 $A=1.0$
and
 $A=2.0$
across four spanwise wavelengths (
 $\unicode[STIX]{x1D706}=4\unicode[STIX]{x1D706}_{ST}$
). Isolines of streamwise mass flux are plotted at ten streamwise locations from
 $R=300$
to
 $R=3000$
. These figures clearly show the sinusoidal spanwise modulation in form of streamwise aligned streaks produced by the finite-amplitude optimal inflow perturbation, which is composed of a pair of counter-rotating vortices (Paredes et al.
Reference Paredes, Choudhari and Li2016c
,Reference Paredes, Choudhari, Li and Chang
d
). At the symmetry plane,
 $z=L_{z}/2$
, the near-wall, low-momentum fluid is lifted upward by the counter-rotating vortices, resulting in a localized region of increased boundary-layer thickness. At the other symmetry plane,
 $z=0$
(and
 $z=L_{z}$
because of spanwise periodicity), the effect of the initial vortices is exactly the opposite, yielding a localized region of reduced boundary-layer thickness. As explained below, the spanwise wavenumber of the relevant first-mode waves is typically smaller than the spanwise wavenumber corresponding to the optimal perturbations. Therefore, the basic state used for the study of interactions between the streaks and important first-mode waves consists of multiple streak wavelengths as shown in figure 2 for
 $\unicode[STIX]{x1D706}=4\unicode[STIX]{x1D706}_{ST}$
.
Isolines of mass flux
 $\unicode[STIX]{x1D70C}u$
for (a)
 $A=1.0$
and (b)
 $A=2.0$
at cross-flow planes from
 $R=300$
(
 $x^{\ast }=0.09~\text{m}$
) to
 $R=3000$
(
 $x^{\ast }=9.0~\text{m}$
) with four streak spanwise wavelengths,
 $\unicode[STIX]{x1D706}=4\unicode[STIX]{x1D706}_{ST}$
. The colour map varies from
 $\unicode[STIX]{x1D70C}u=0.05$
(dark blue) to
 $\unicode[STIX]{x1D70C}u=0.95$
(dark red).
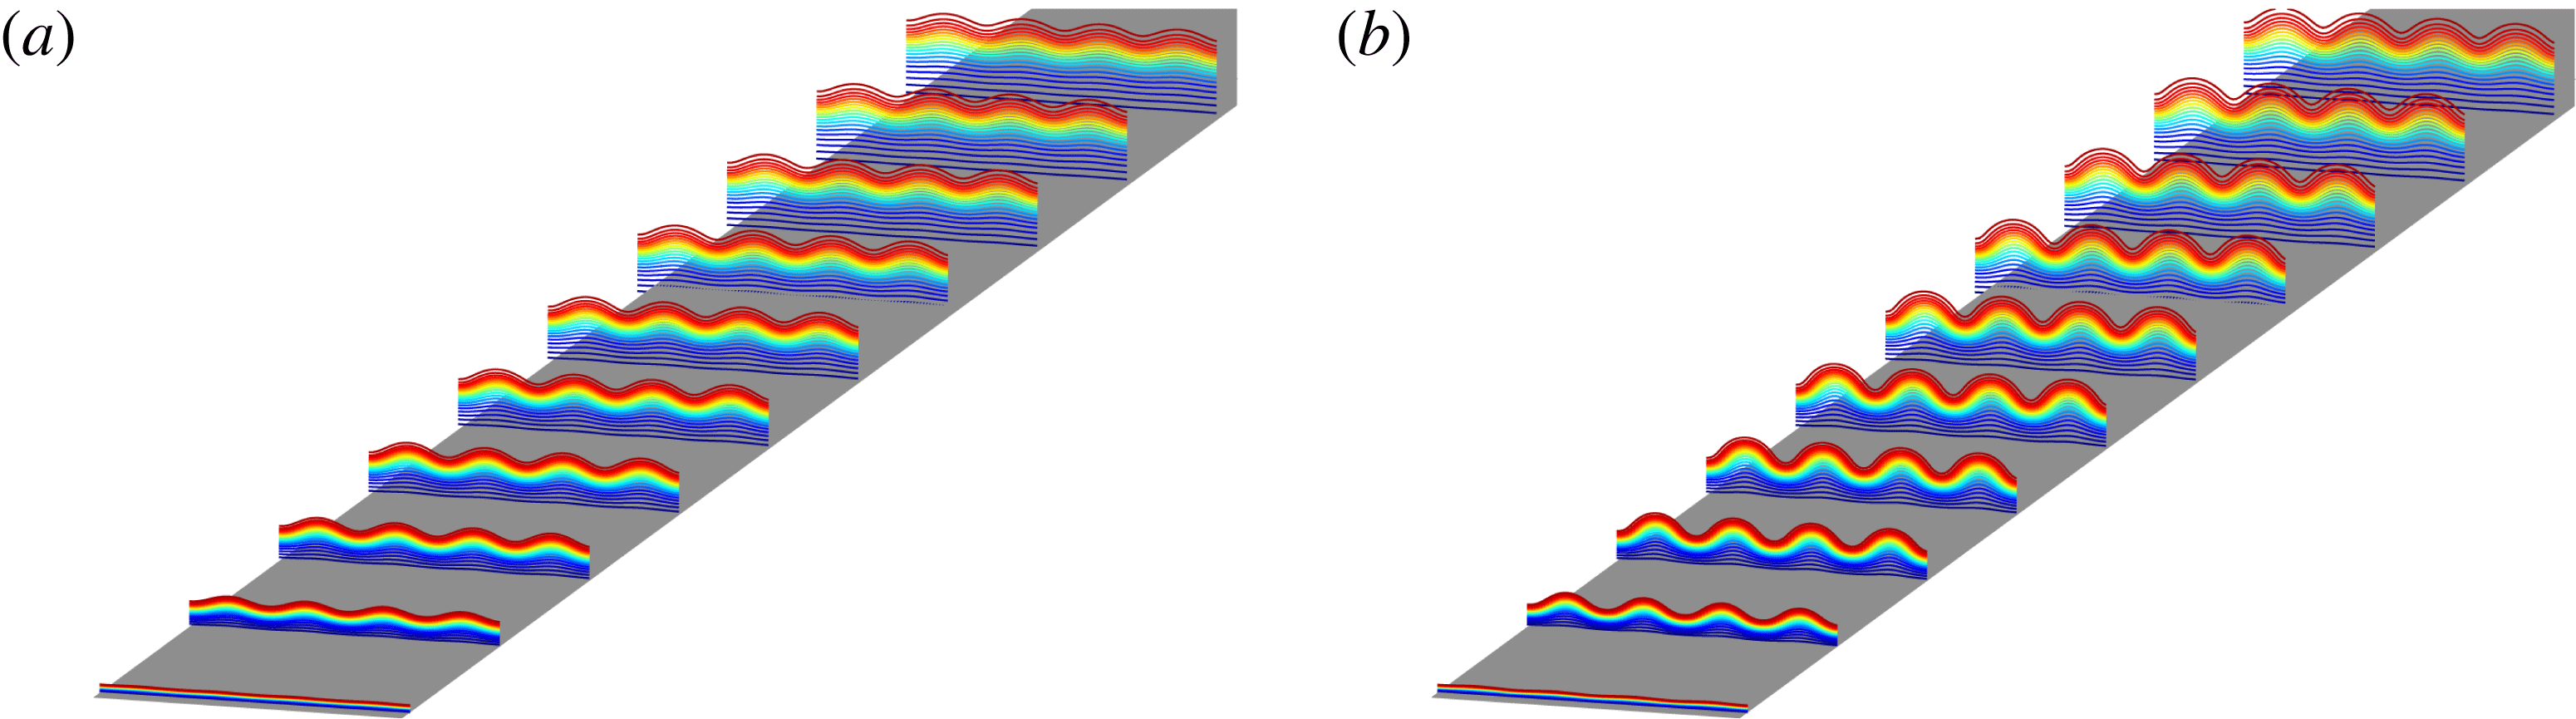
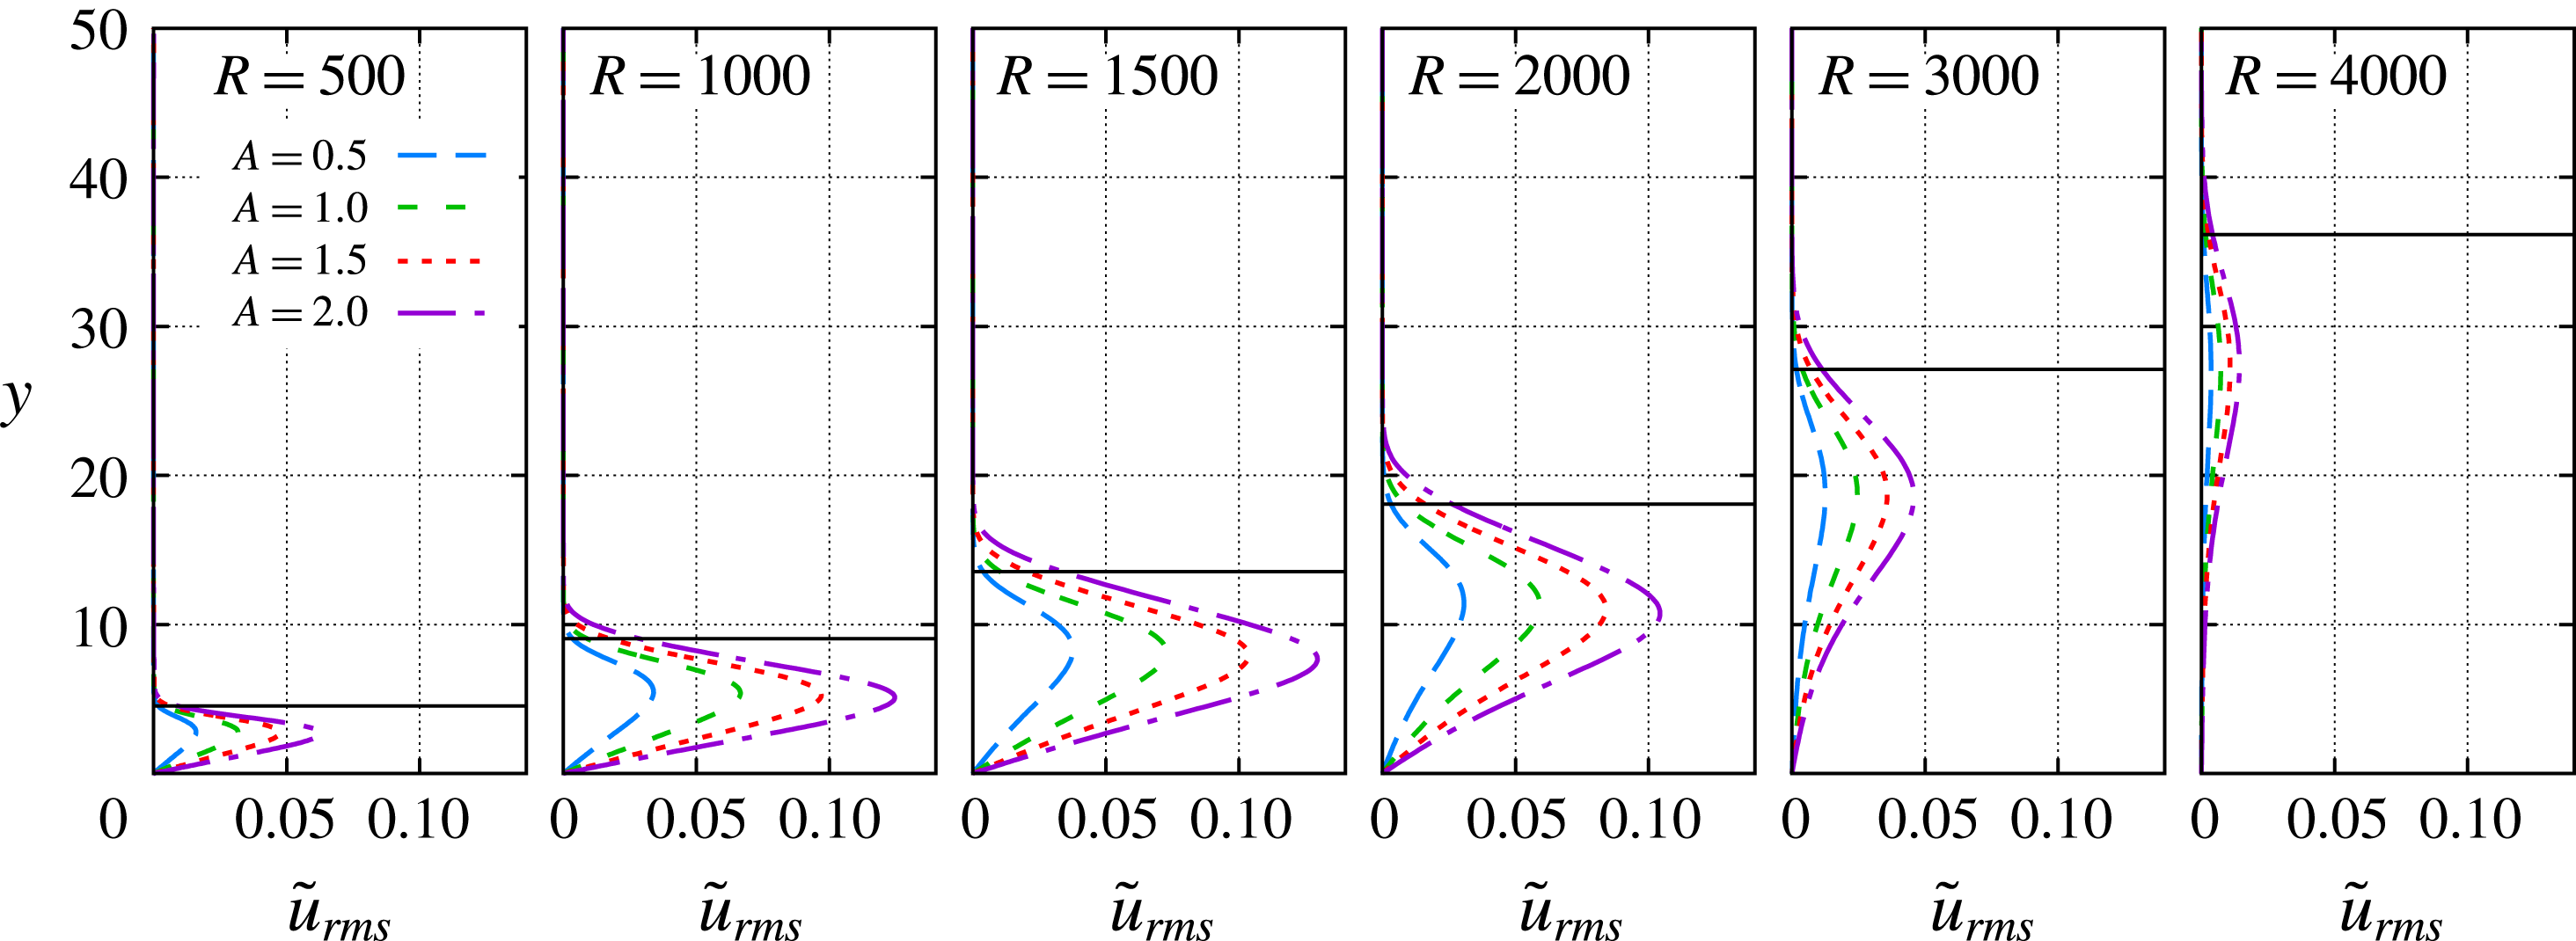
Figure 3 shows the root-mean-square streamwise velocity perturbation, which is defined as
 $$\begin{eqnarray}\tilde{u} _{rms}(x,y)=\frac{1}{\unicode[STIX]{x1D706}_{ST}}\int _{0}^{\unicode[STIX]{x1D706}_{ST}}\sqrt{u(x,y,z)^{2}-\langle u\rangle (x,y)^{2}}\,\text{d}z,\end{eqnarray}$$
where
 $$\begin{eqnarray}\langle u\rangle (x,y)=\frac{1}{\unicode[STIX]{x1D706}_{ST}}\int _{0}^{\unicode[STIX]{x1D706}_{ST}}u(x,y,z)\,\text{d}z,\end{eqnarray}$$
at streamwise locations of
 $R=500$
, 1000, 1500, 2000, 3000 and 4000. The highest level of perturbation occurs between
 $R=1000$
and
 $R=2000$
, which also corresponds to the region with the highest streak amplitudes as shown previously in figure 1(a). Although not shown here, the maximum value of
 $\tilde{u} _{rms}$
occurs just below the boundary-layer edge along the
 $z=0$
plane.
Evolution of the root-mean-square streamwise velocity,
 $\tilde{u} _{rms}$
for selected streak amplitude parameters, namely,
 $A=0.5$
, 1.0, 1.5 and 2.0. The horizontal, solid black lines represent the location of the boundary-layer edge based on
 $\bar{u}=0.995$
for the unperturbed case (
 $A=0.0$
).

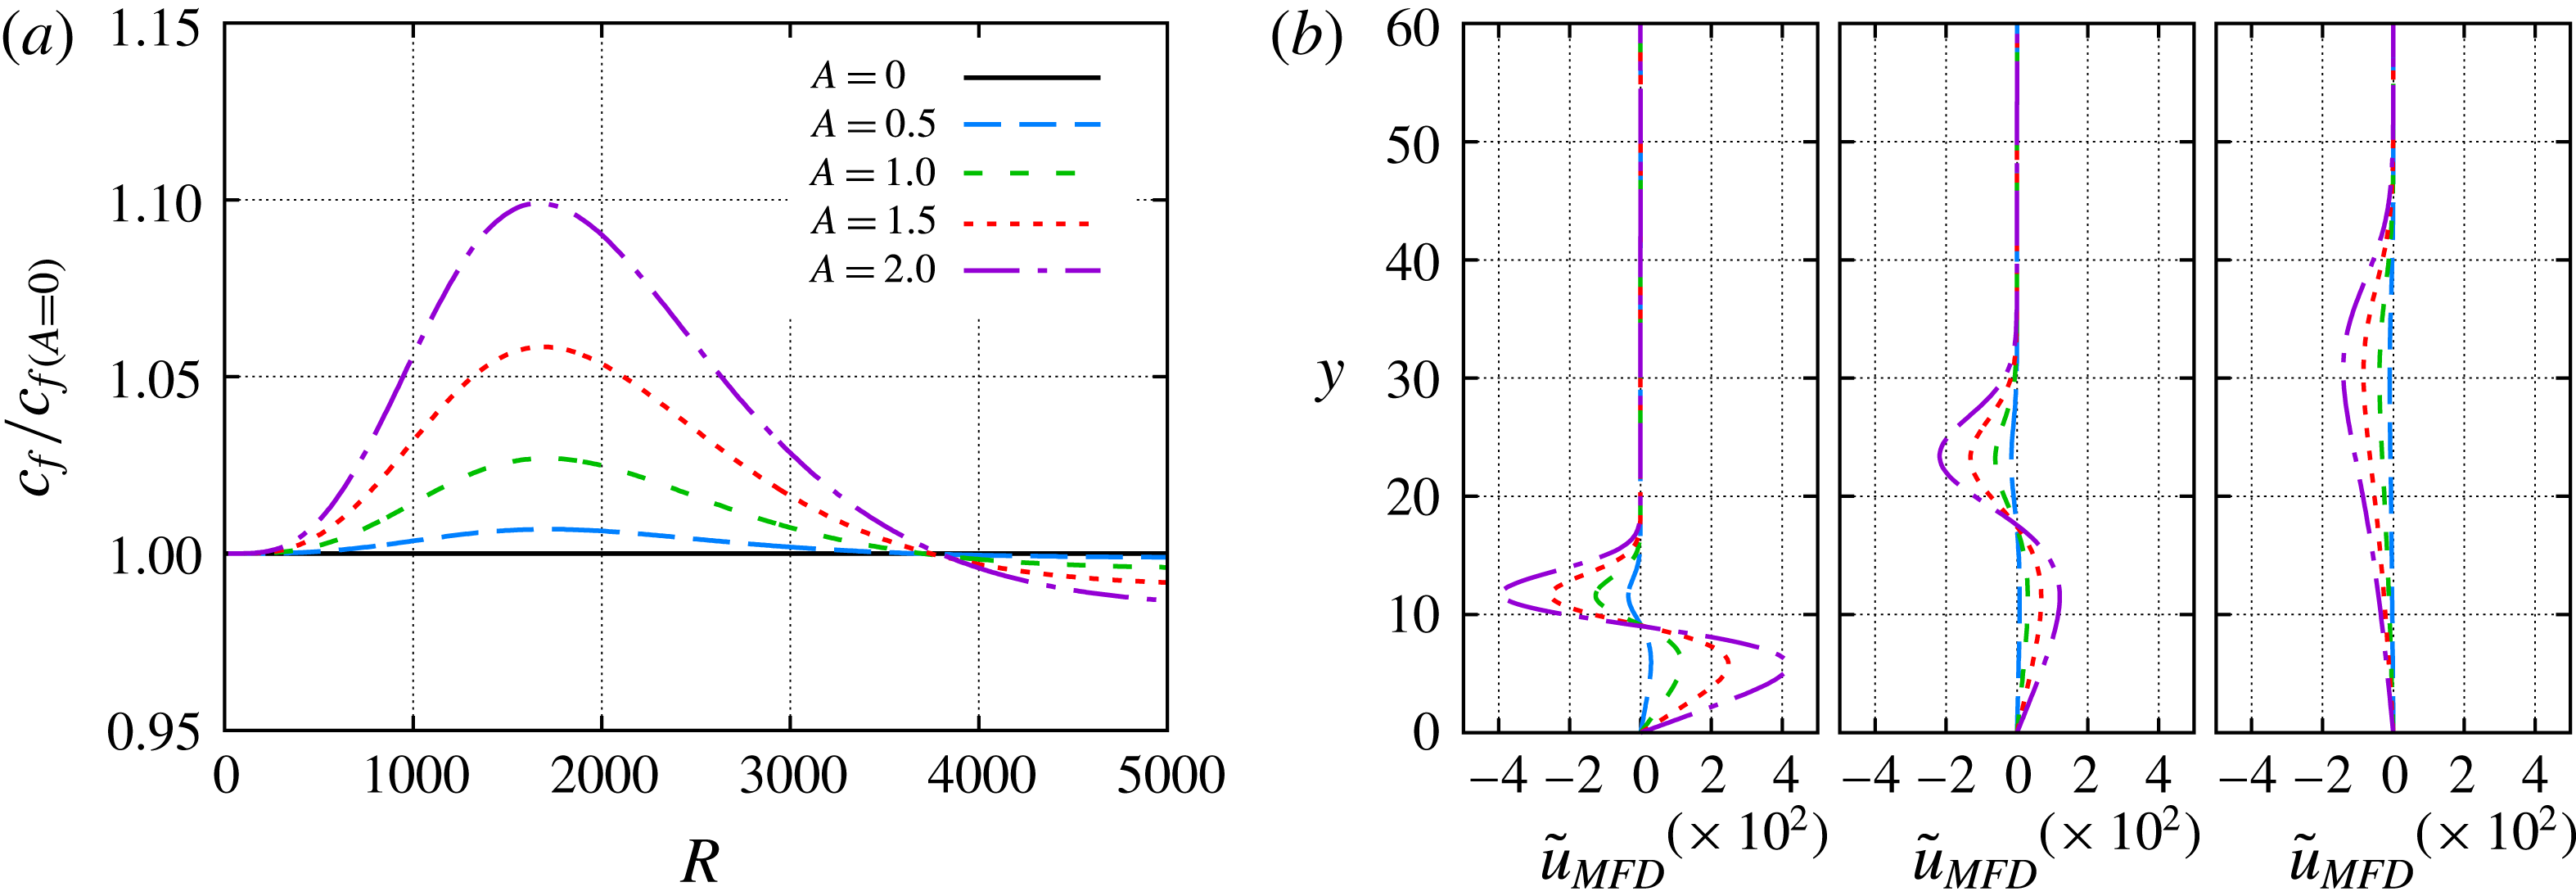
Finally, the effect of streaks on the skin friction coefficient is studied in figure 4. Figure 4(a) shows the ratio of the spanwise-averaged local skin friction coefficient with respect to that in the unperturbed case (
 $A=0$
). A peak skin friction increment of approximately 10 % is observed for the
 $A=2.0$
case. For
 $R>3800$
the skin friction corresponding to
 $A>0$
is lower than that of the unperturbed boundary-layer flow. This behaviour is explained by the evolution of the mean flow distortion (MFD) of the perturbation,
 $\tilde{\boldsymbol{q}}_{MFD}$
, in figure 4(b). The wall-normal gradient of the streamwise velocity component of the MFD,
 $\tilde{u} _{MFD}$
, is positive at the wall for
 $R=1500$
and
 $R=3000$
; but becomes negative at further downstream locations as seen from the MFD at
 $R=4500$
.
(a) Evolution of spanwise-averaged local skin friction coefficient ratio between those corresponding to perturbed and unperturbed flows,
 $c_{f}/c_{f(A=0)}$
. Also, (b) MFD streamwise velocity profiles at streamwise positions
 $R=1500$
, 3000 and 4500.

3.2 Effect of streaks on first-mode waves
The modal instability of the unperturbed, adiabatic, Mach 3 flat-plate boundary-layer flow was examined by Paredes et al. (Reference Paredes, Choudhari and Li2016c
). By using quasiparallel linear stability theory (LST) analysis, they showed that the most amplified instability waves at
 $R=1000$
correspond to first-mode waves with spanwise wavenumber
 $\unicode[STIX]{x1D6FD}\approx 0.075$
and disturbance frequency
 $\unicode[STIX]{x1D714}=0.02$
. This spanwise wave number is rather small compared with that corresponding to optimal disturbance initiated near the leading edge and for maximum transient growth at
 $R=1000$
; i.e.
 $\unicode[STIX]{x1D6FD}_{ST}=0.25$
. Following the same approach used here, Paredes et al. (Reference Paredes, Choudhari and Li2016c
) presented the spatial evolution of fixed frequency, oblique, first-mode instabilities in terms of the logarithmic amplification ratio based on the energy norm, the so-called
 $N$
-factor, as defined by (2.3). PSE calculations showed that
 $N=5$
is reached at
 $R=1596$
(i.e.
 $Re_{x}=2.55\times 10^{6}$
) and
 $N=10$
is achieved at
 $R=3226$
(
 $Re_{x}=1.04\times 10^{7}$
).
Herein, the modal instability characteristics of the boundary-layer flow perturbed by the finite-amplitude streaks are studied by means of the linear, plane-marching PSE. The three-dimensional basic state is composed of the baseline two-dimensional boundary layer plus the finite-amplitude, linearly optimal perturbation discussed previously. The pair of oblique first-mode waves with equal but opposite wave angle are modulated by the presence of the streaks. For disturbance wavelengths that correspond to
 $\unicode[STIX]{x1D706}=\unicode[STIX]{x1D706}_{ST}$
(fundamental wavelength) and
 $\unicode[STIX]{x1D706}=2\unicode[STIX]{x1D706}_{ST}$
(subharmonic wavelength), the symmetric and antisymmetric modes have different amplification rates. For all other wavelengths, the disturbance field can be decomposed into a pair of modes travelling in opposite directions along the spanwise direction. Both modes in this pair have the same amplification rate in
 $x$
and their mode shapes satisfy the condition
 $\hat{\boldsymbol{q}}^{-}(x,y,z)=\hat{\boldsymbol{q}}^{+}(x,y,-z)$
, where the superscripts
 $+$
and
 $-$
denote the signs of the spanwise components of phase velocities associated with the two modes constituting the pair. Because of this, the mode shape for just one of the two waves is presented for those wavelengths.
The results are divided into two groups: highly oblique waves, i.e. first-mode waves with spanwise wavelengths equal to or lower than two streak wavelengths (§ 3.2.1), and nearly planar waves, i.e. first-mode waves with spanwise wavelengths larger than two streak wavelengths (§ 3.2.2). Finally, the overall effect of streaks on the amplification of first-mode waves and the associated transition onset location is presented in § 3.2.3.
3.2.1 Destabilization of highly oblique waves,
 $\unicode[STIX]{x1D706}\leqslant 2\unicode[STIX]{x1D706}_{ST}$

The
 $N$
-factor envelope evolution for first-mode waves with fundamental spanwise wavelength (
 $\unicode[STIX]{x1D706}=\unicode[STIX]{x1D706}_{ST}$
) is plotted in 5(a) and 5(b) for the symmetric and antisymmetric modes, respectively. The symmetric or antisymmetric character is defined by the structure of the
 $\hat{u}$
mode shape with respect to the centreline of the streak (
 $\unicode[STIX]{x1D701}=L_{z}/2$
). The
 $N$
-factor envelopes of figure 5(a,b) are built upon
 $N$
-factor curves with disturbance frequencies
 $\unicode[STIX]{x1D714}=0.05$
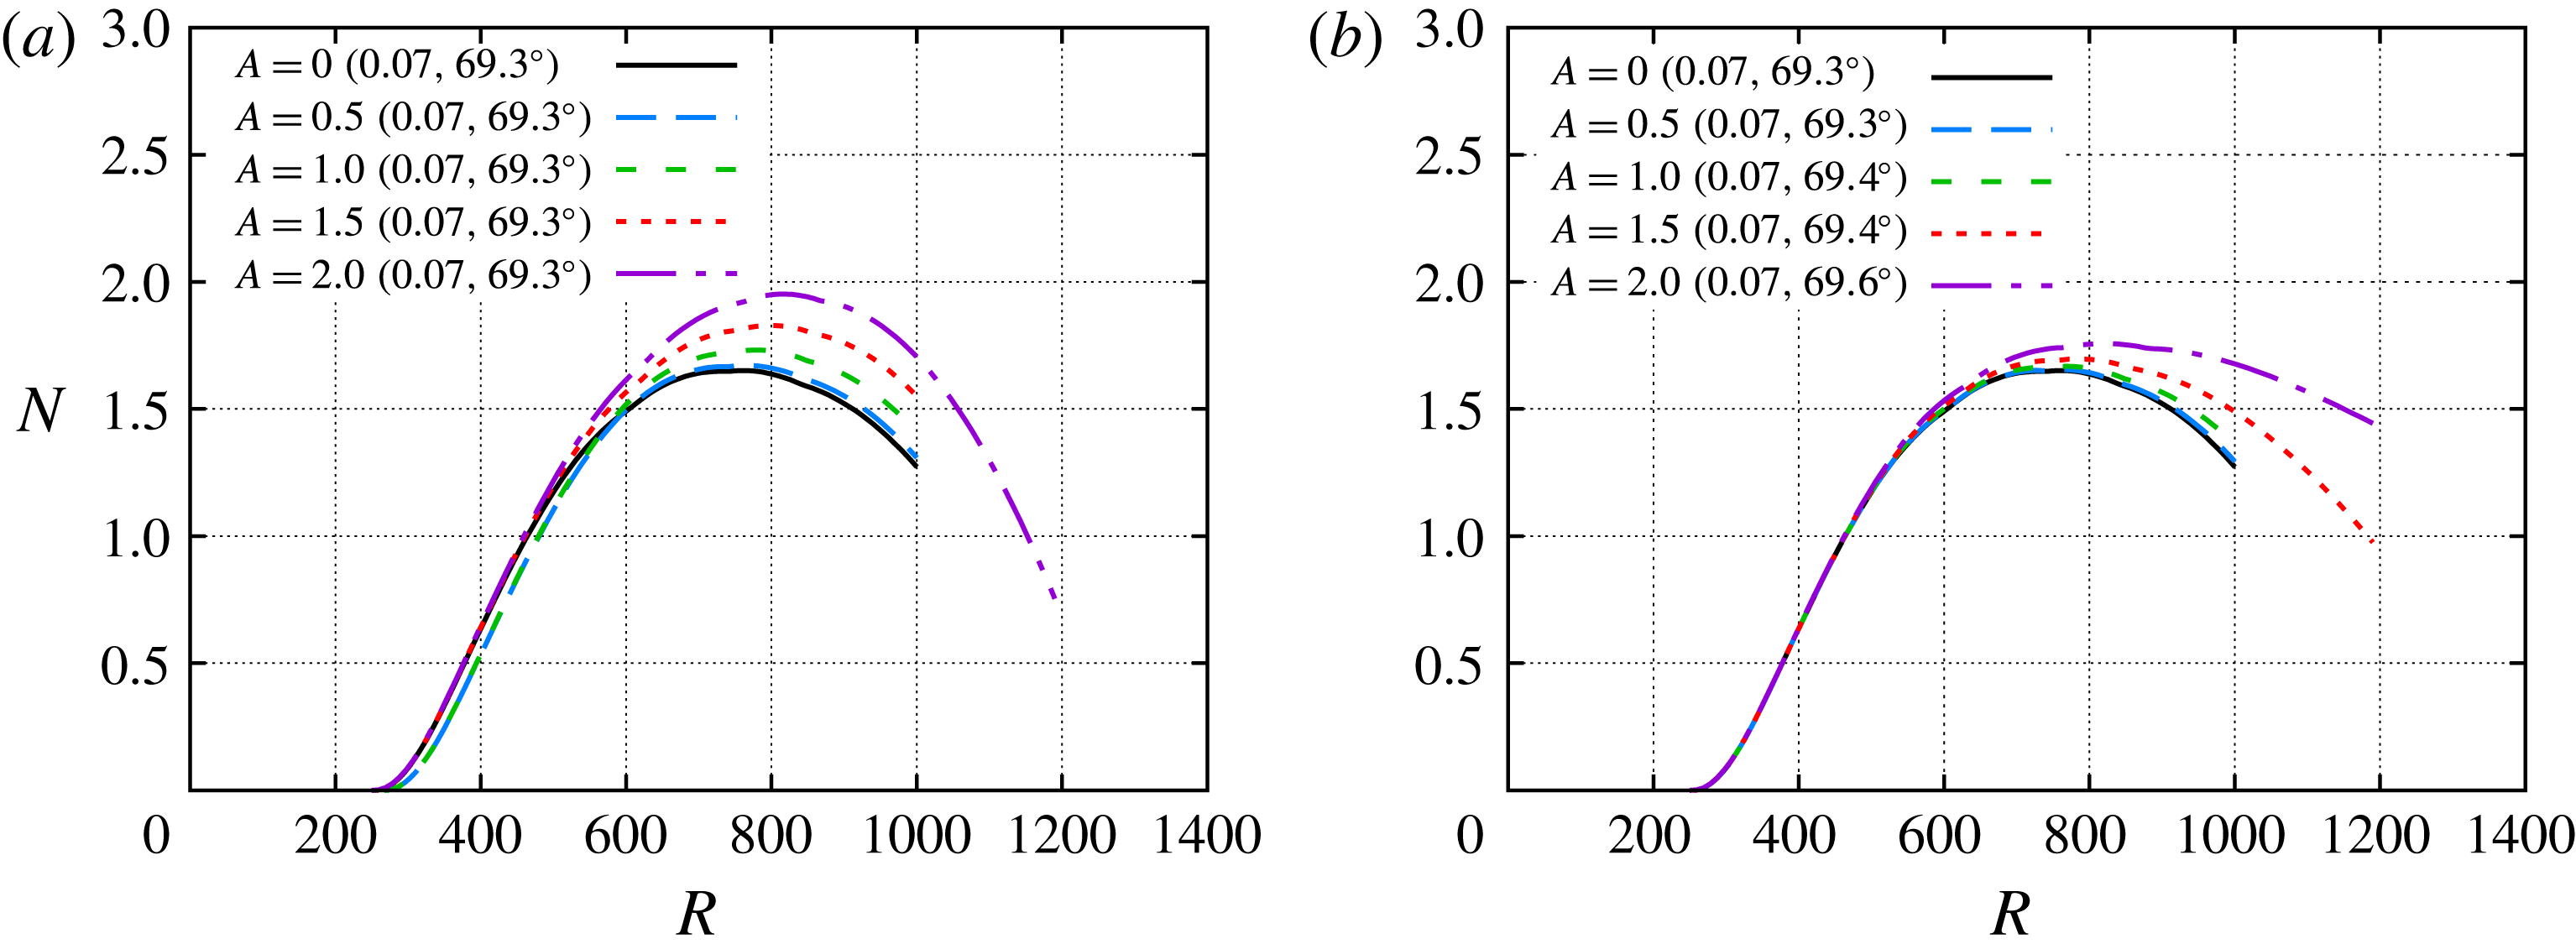
, 0.06, 0.07 and 0.08. The presence of the streaks leads to slight destabilization of both symmetric and antisymmetric first modes at the fundamental spanwise wavelength, but the modulated symmetric modes reach a higher peak
 $N$
-factor (
 $N\approx 2$
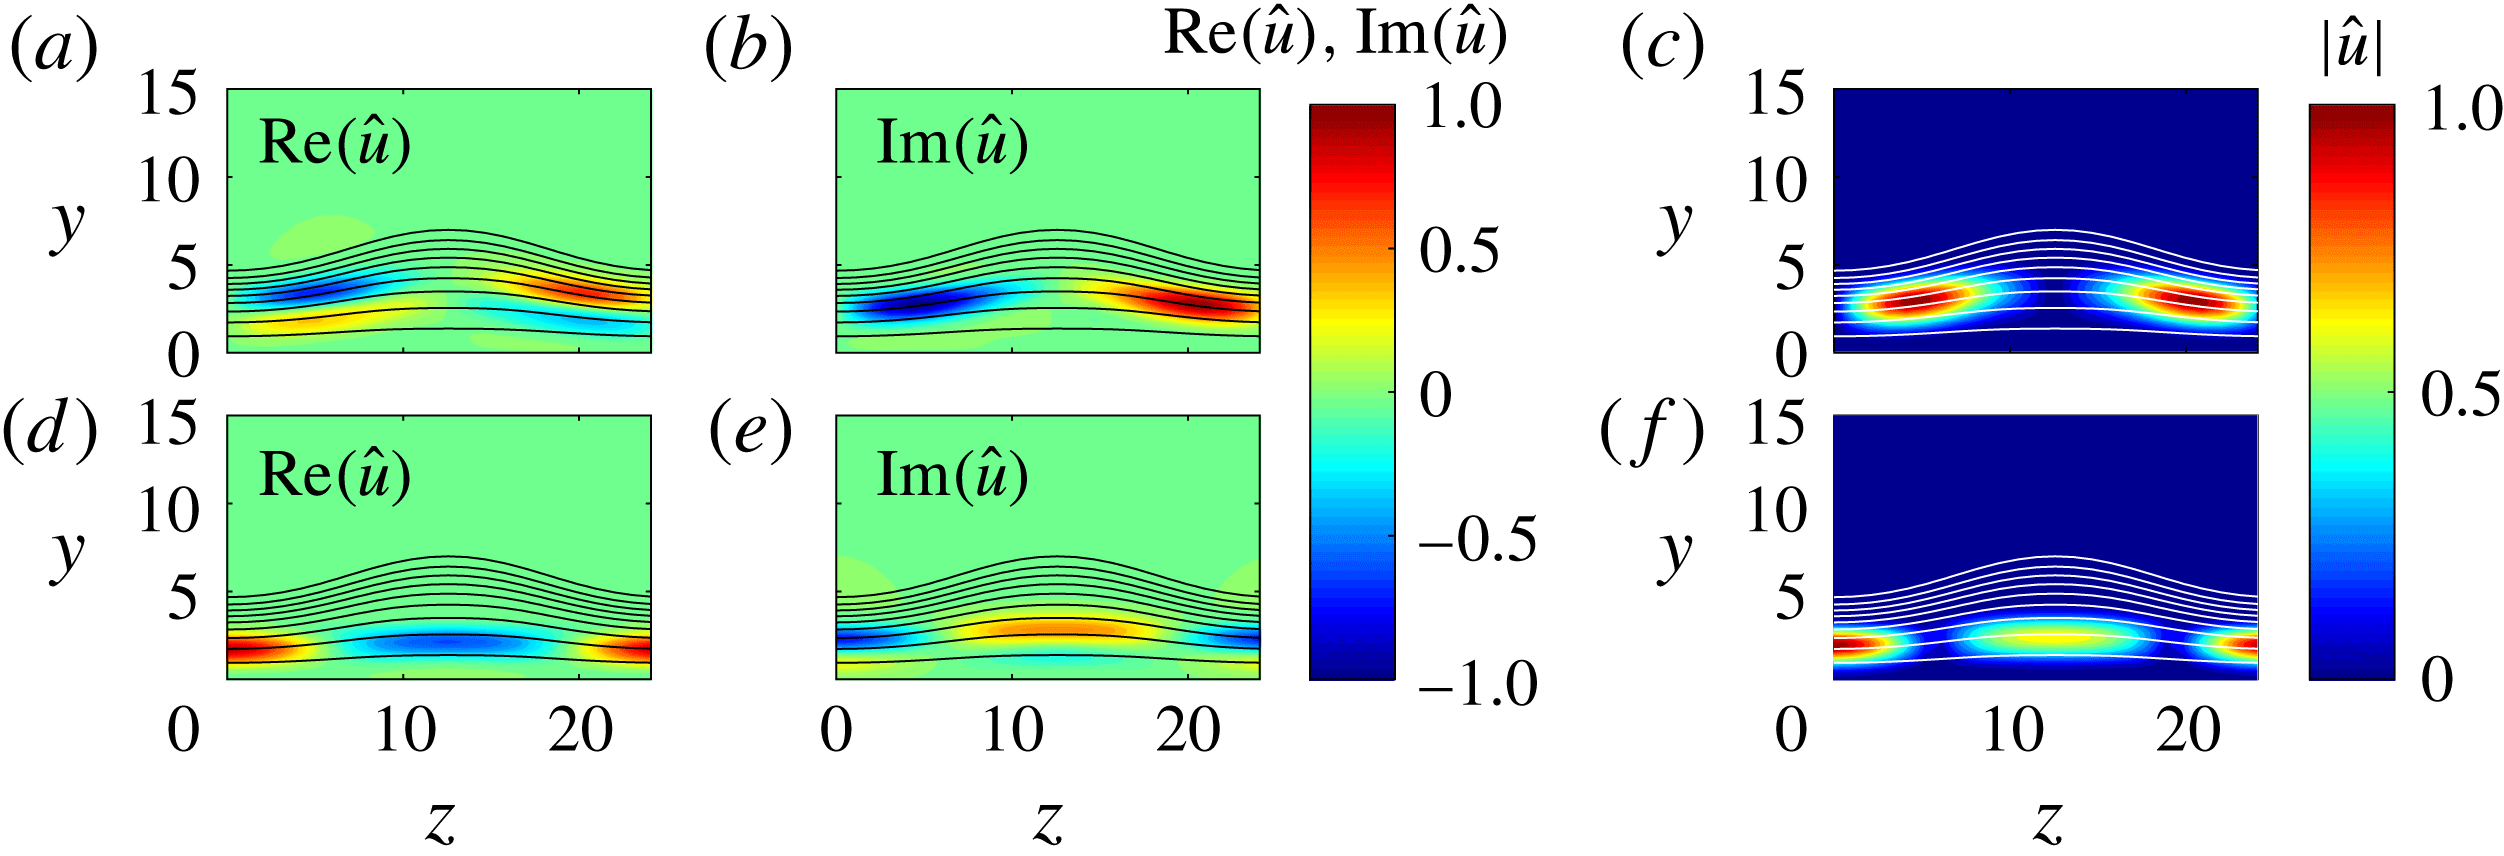
) than the antisymmetric modes. The mode shapes of both antisymmetric and symmetric first-mode waves with fundamental spanwise wavelength are plotted in figure 6 for
 $\unicode[STIX]{x1D714}=0.07$
,
 $R=700$
and
 $A=2.0$
. The real and imaginary parts and the modulus of the streamwise velocity fluctuation of the antisymmetric mode are plotted in figures 6(a), 6(b) and 6(c), respectively. The presence of the streak leads to a concentration of the fluctuation in between the two symmetry planes. Figure 6(d–f) shows analogous mode shapes for the symmetric mode. In this case, the presence of the streak leads to a concentration of the fluctuation over both of the symmetry planes, with the overall maximum along the symmetry plane corresponding to the lower boundary-layer thickness,
 $z=0$
.
 $N$
-factor envelopes of first-mode waves with fundamental spanwise wavelength,
 $\unicode[STIX]{x1D706}=\unicode[STIX]{x1D706}_{ST}$
, with (a) symmetric and (b) antisymmetric mode shapes. The selected disturbance frequencies are
 $\unicode[STIX]{x1D714}=0.06$
, 0.07, 0.08 and 0.09. Note that the most amplified disturbance frequency and its wave angle at the
 $N$
-factor peak location, i.e.
 $(\unicode[STIX]{x1D714},\unicode[STIX]{x1D719})$
, are specified within parentheses for each streak amplitude parameter.

Isocontours of the (a,d) real and (b,e) imaginary parts and (c,f) modulus of streamwise velocity fluctuations associated with the (a–c) antisymmetric and (d–f) symmetric first modes with fundamental wavelength
 $\unicode[STIX]{x1D706}=\unicode[STIX]{x1D706}_{ST}$
and frequency
 $\unicode[STIX]{x1D714}=0.07$
, at streamwise position
 $R=700$
and for streak amplitude parameter
 $A=2.0$
. The isolines of basic state mass flux
 $\bar{\unicode[STIX]{x1D70C}}\bar{u}=0.1:0.1:0.9$
are included.

 $N$
-factor envelopes of first-mode waves with subharmonic spanwise wavelength,
 $\unicode[STIX]{x1D706}=2\unicode[STIX]{x1D706}_{ST}$
, with (a) symmetric and (b) antisymmetric mode shapes. The selected disturbance frequencies are
 $\unicode[STIX]{x1D714}=0.020$
, 0.025, 0.030, 0.035, 0.040, 0.045 and 0.050. Note that the most amplified disturbance frequency and its wave angle at the
 $N$
-factor peak location, i.e.
 $(\unicode[STIX]{x1D714},\unicode[STIX]{x1D719})$
, are specified within parentheses for each streak amplitude parameter.

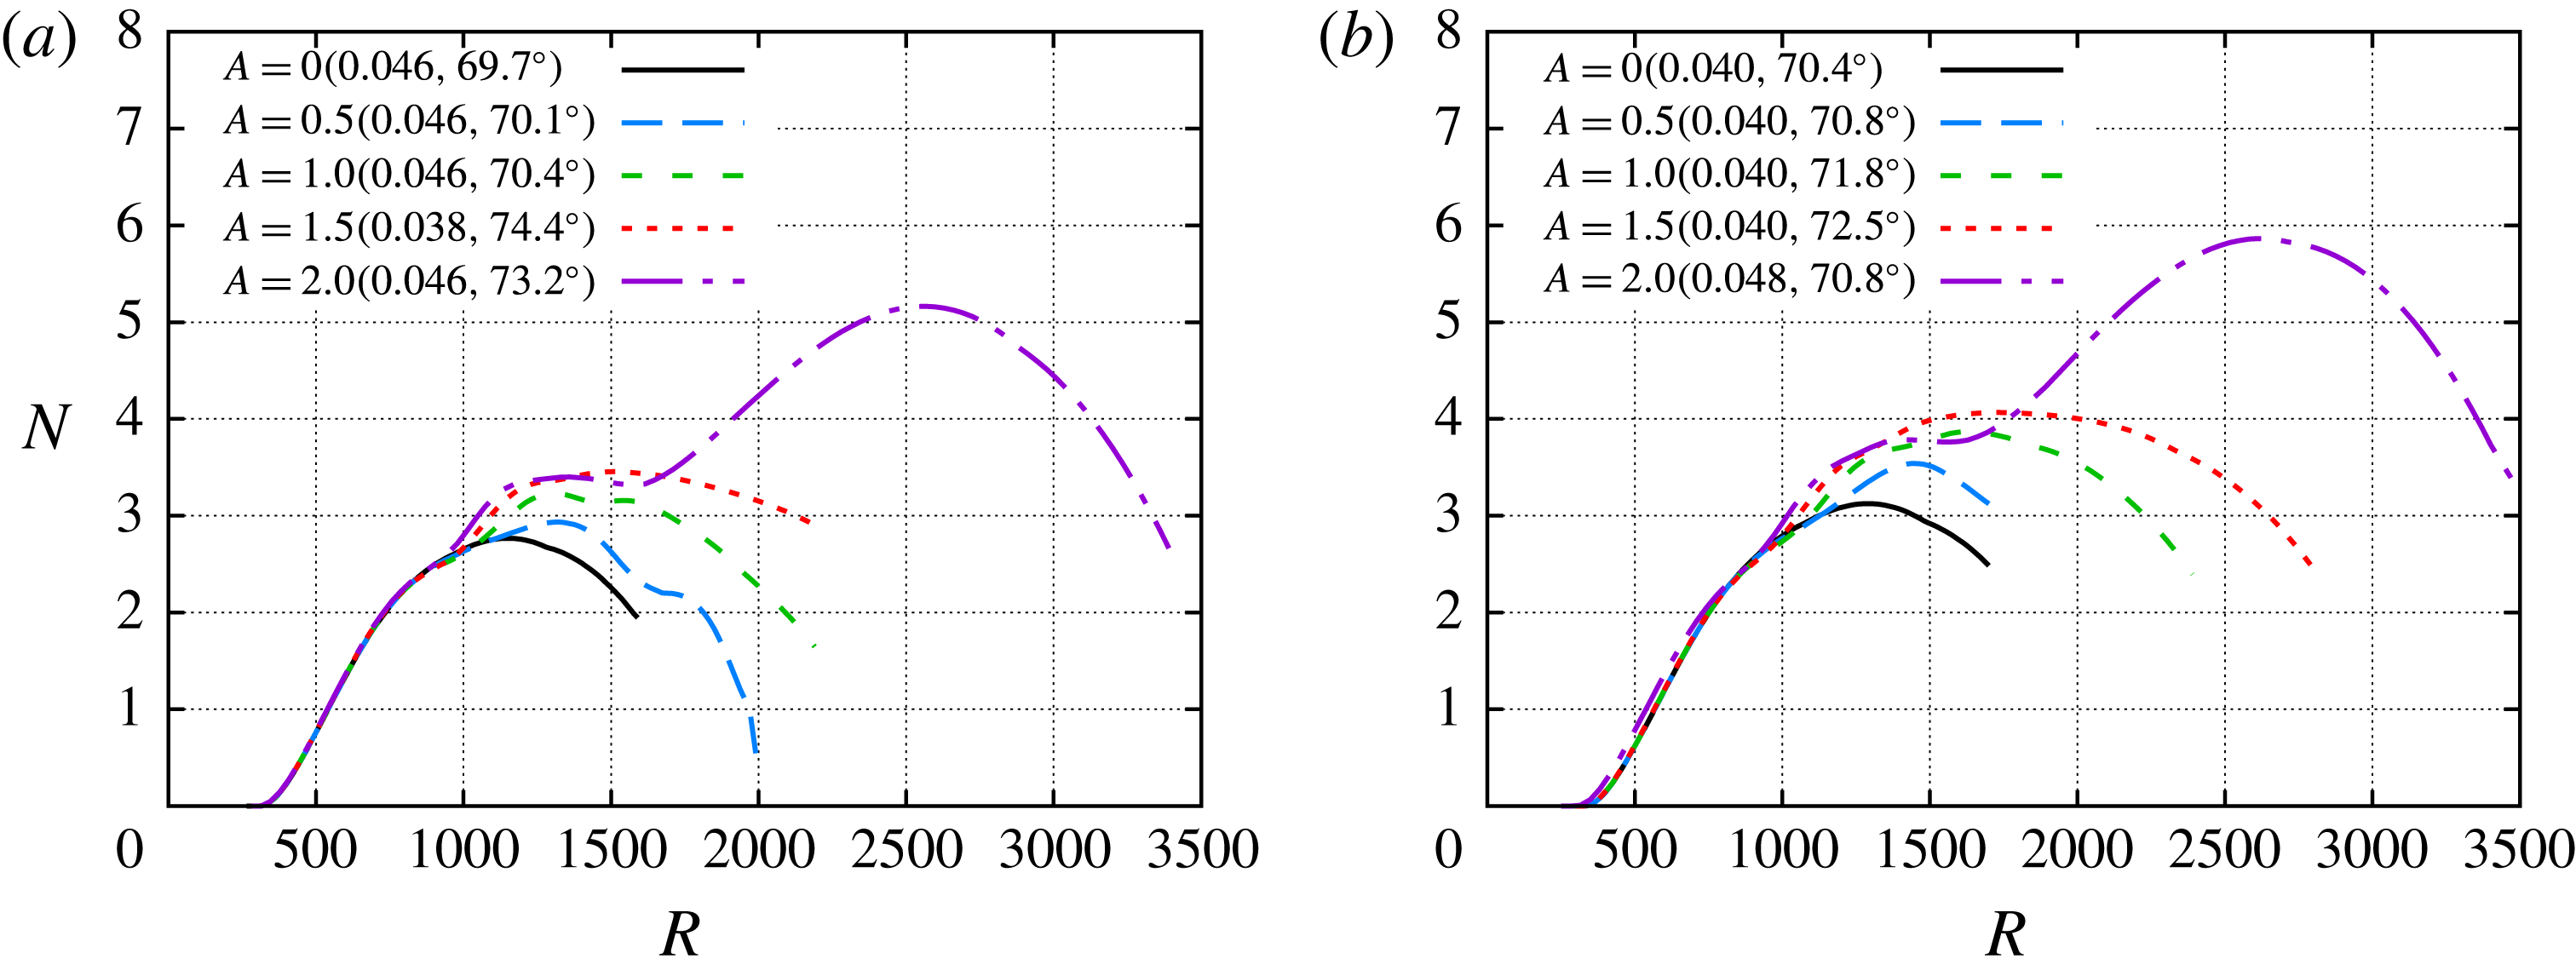
Next, the effect of the streaks on the first-mode waves with subharmonic wavelength (
 $\unicode[STIX]{x1D706}=2\unicode[STIX]{x1D706}_{ST}$
) is presented. Figures 7(a) and 7(b) show the
 $N$
-factor envelope curves for the symmetric and antisymmetric subharmonic modes, respectively. These
 $N$
-factor envelopes are built upon
 $N$
-factor curves with disturbance frequencies
 $\unicode[STIX]{x1D714}=0.035$
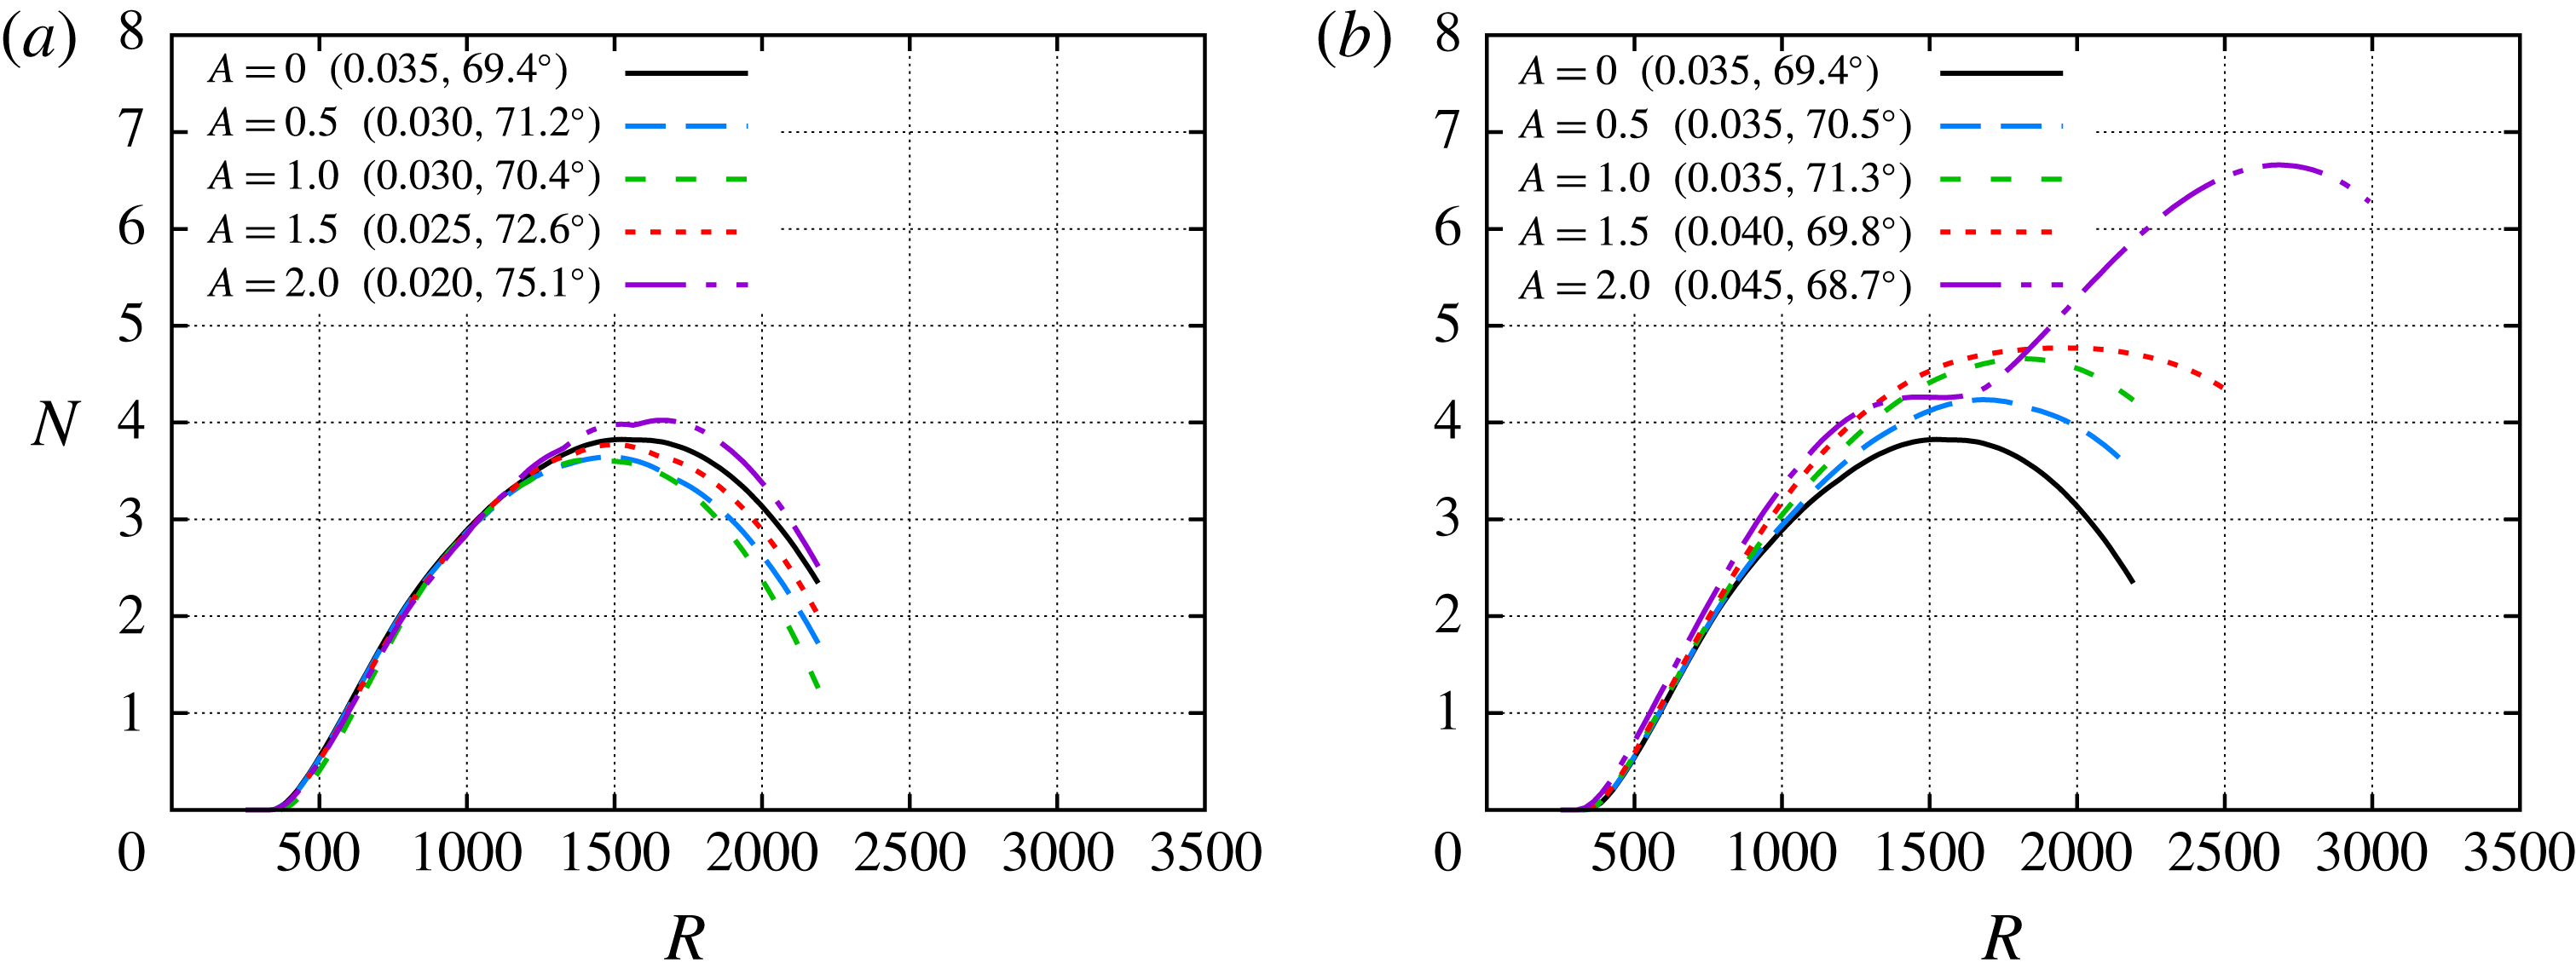
, 0.040, 0.045, 0.050 and 0.055. For the subharmonic wavelength, the effect of streaks on the symmetric mode is non-monotonic with respect to streak amplitude, because the maximum
 $N$
-factor decreases from
 $A=0.0$
until
 $A=1.0$
, but the
 $N$
-factor peak increases again for
 $A=1.5$
and
 $A=2.0$
. As shown in figure 7(a), the maximum
 $N$
-factor for the symmetric modes for
 $A=2.0$
is slightly larger than
 $N=4$
. Figure 7(b) shows that the streaks increase the maximum amplification ratio of the antisymmetric modes. The behaviour of the
 $N$
-factor envelope curve for the
 $A=2.0$
streak is different from that at lower streak amplitudes. Similar to
 $A<2.0$
, the
 $N$
-factor curve for the
 $A=2.0$
case nearly flattens in the vicinity of the upper branch neutral station corresponding to the unperturbed boundary layer. However, the amplification rate does not become negative, and in fact, the antisymmetric modes undergo a new spurt of growth, yielding a peak
 $N$
-factor value of
 $N\approx 6.7$
at
 $R\approx 2680$
, which is much larger than the
 $N$
-factor of
 $N\approx 4.8$
at
 $R=1960$
for
 $A=1.5$
. The sudden increase in peak
 $N$
-factor from
 $A=1.5$
to 2.0 represents an onset of streak instability. As shown in Paredes et al. (Reference Paredes, Choudhari and Li2016c
), at sufficiently large streak amplitudes, the original antisymmetric first mode with subharmonic spanwise wavelength becomes the subharmonic, sinuous (SS) mode of streak instability. By virtue of its high amplification ratios, the SS mode tends to accelerate transition at high streak amplitudes.
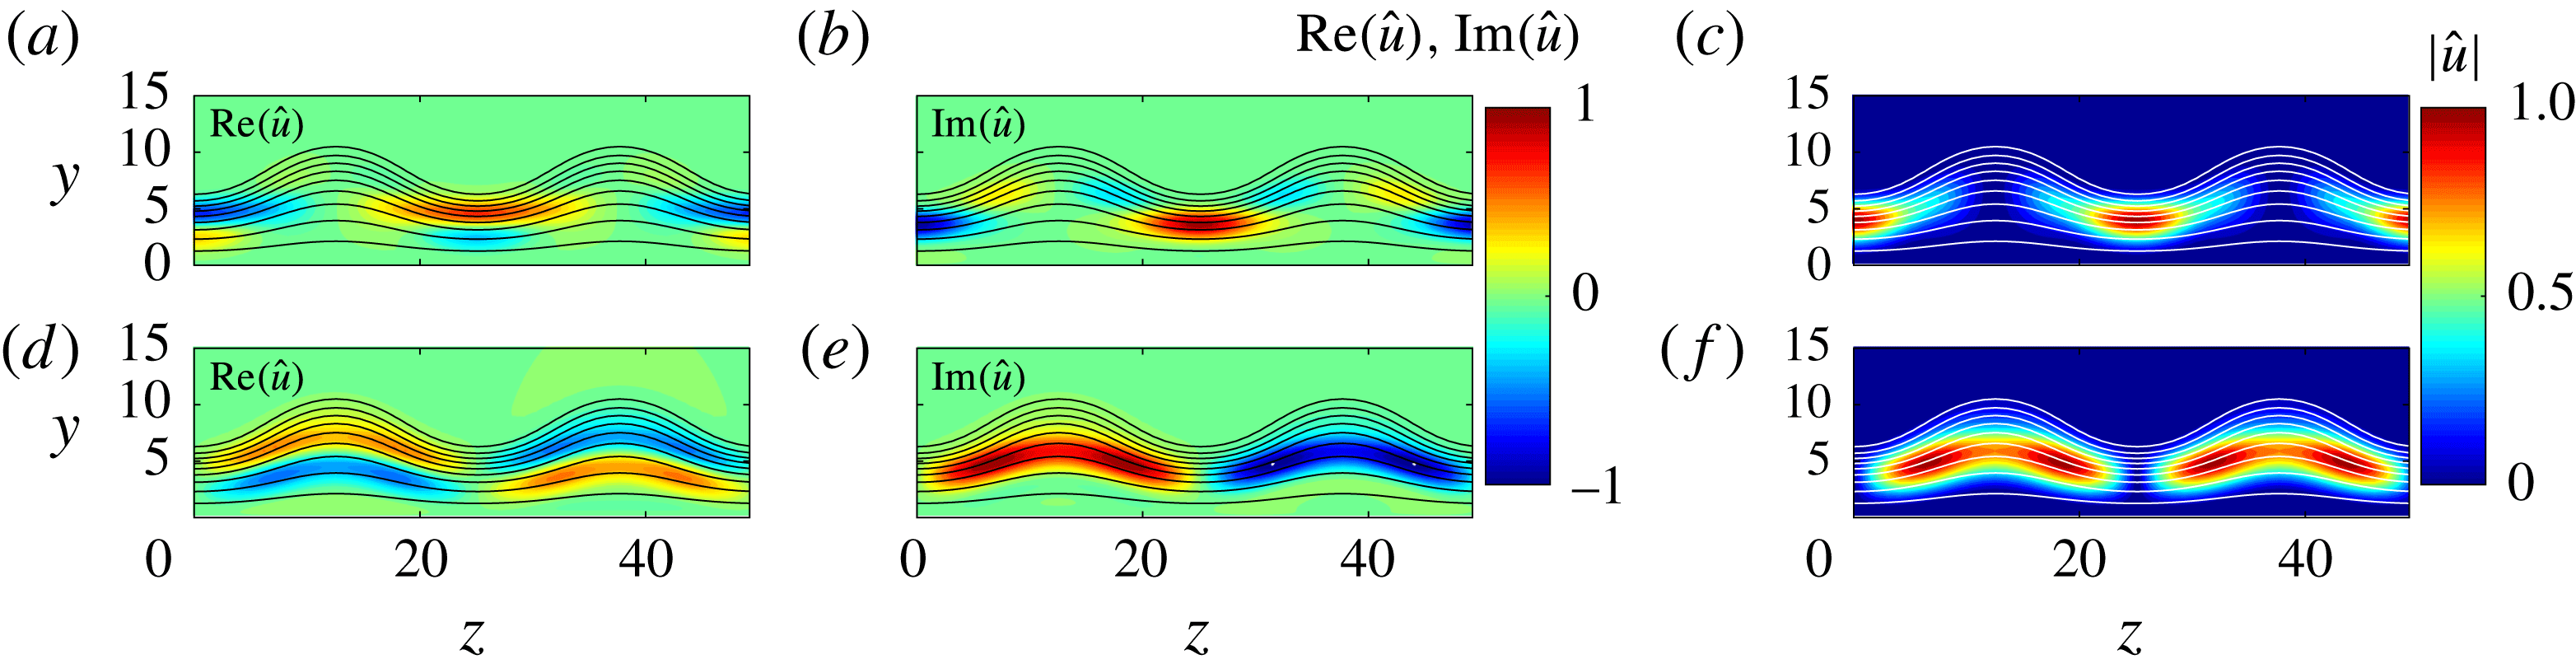
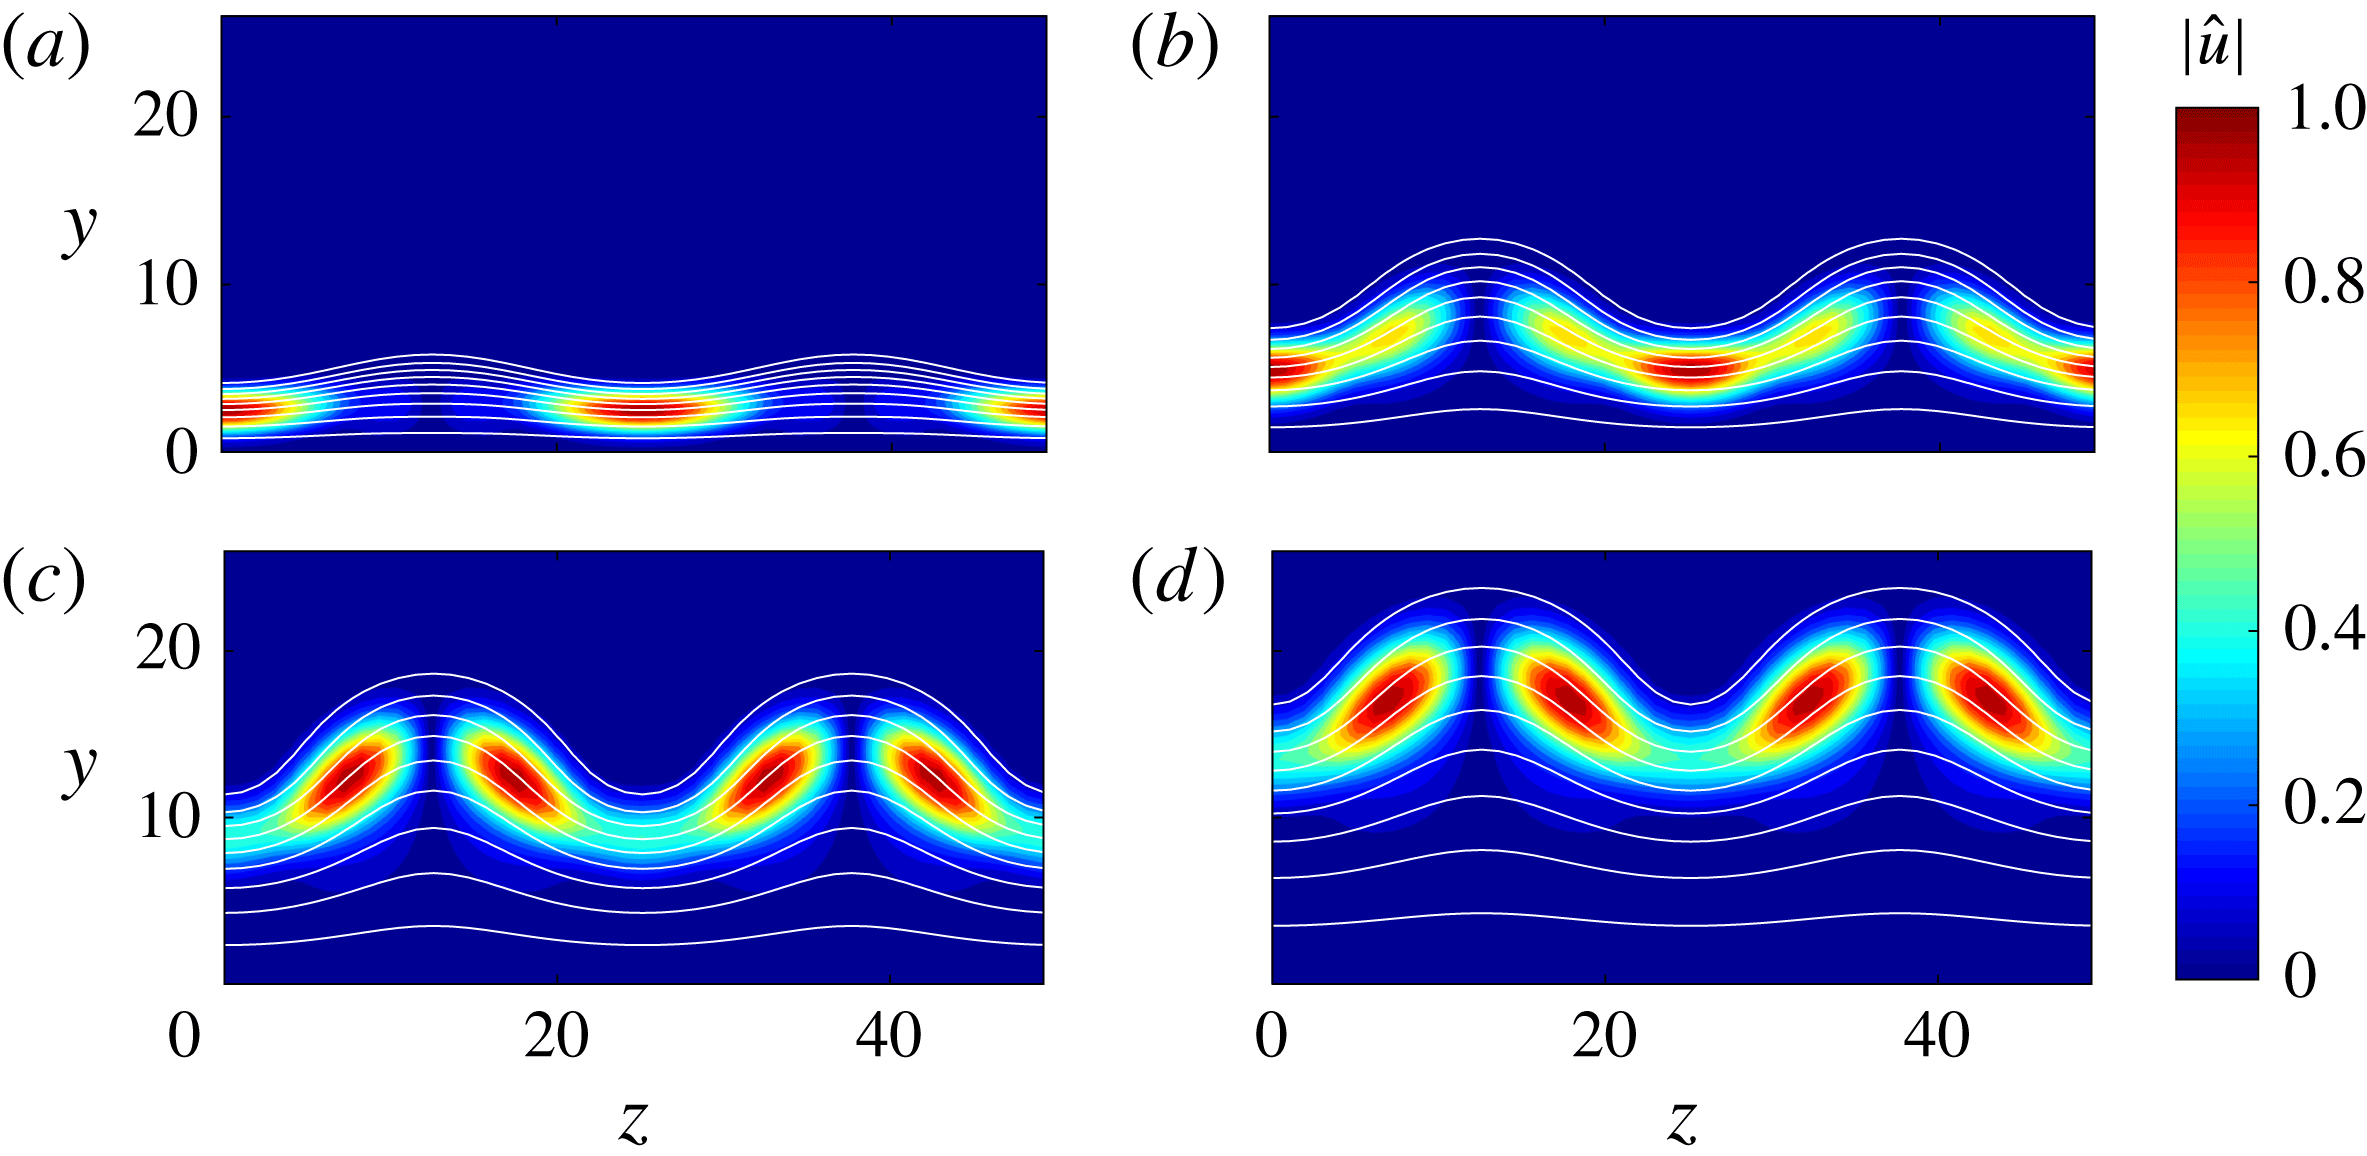
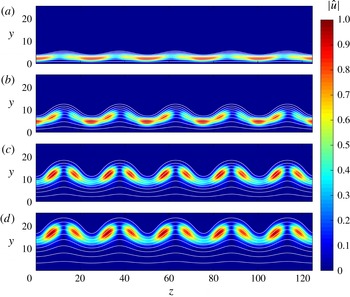
The mode shapes of the subharmonic symmetric and antisymmetric modes are compared in figure 8 for a disturbance frequency
 $\unicode[STIX]{x1D714}=0.035$
at the streamwise location
 $R=1000$
. The real and imaginary parts and the modulus of the streamwise velocity perturbation for the antisymmetric mode are plotted in figures 8(a), 8(b) and 8(c), respectively; and similar results for the symmetric subharmonic mode are displayed in figure 8(d–f). In the subharmonic case, the fluctuations are concentrated in the region of smaller boundary-layer thickness for the antisymmetric mode, and in the region of larger boundary-layer thickness for the symmetric mode.
Isocontours of the (a,d) real and (b,e) imaginary parts and (c,f) modulus of streamwise velocity fluctuations associated with the (a–c) antisymmetric and (d–f) symmetric first modes with subharmonic wavelength
 $\unicode[STIX]{x1D706}=2\unicode[STIX]{x1D706}_{ST}$
and frequency
 $\unicode[STIX]{x1D714}=0.035$
, at streamwise position
 $R=1000$
and for streak amplitude parameter
 $A=2.0$
. The isolines of basic state mass flux
 $\bar{\unicode[STIX]{x1D70C}}\bar{u}=0.1:0.1:0.9$
are included.

Analysis of antisymmetric first mode with subharmonic wavelength
 $\unicode[STIX]{x1D706}=2\unicode[STIX]{x1D706}_{ST}$
and frequency
 $\unicode[STIX]{x1D714}=0.045$
for streak amplitude parameter
 $A=2.0$
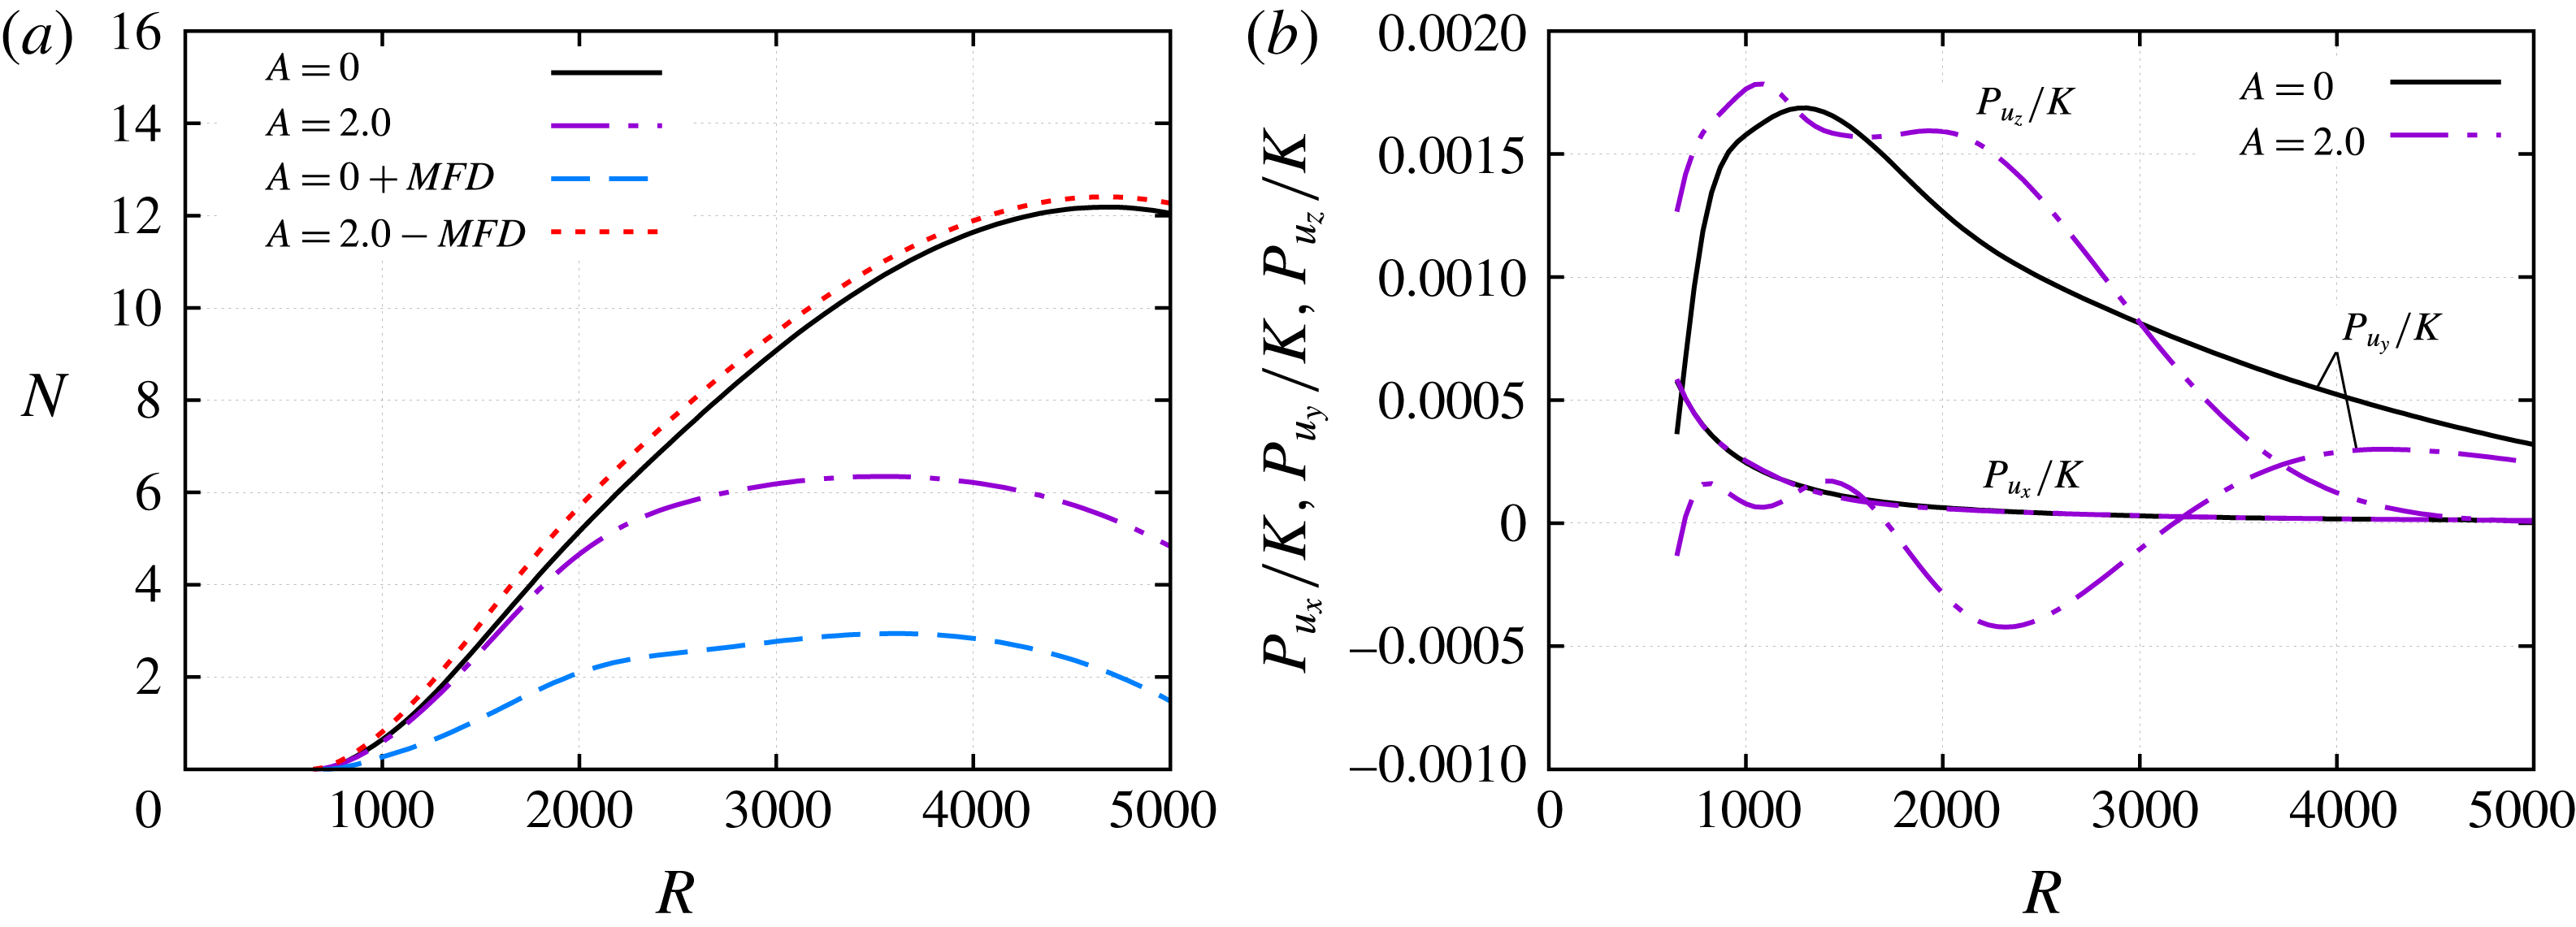
.(a) Evolution of
 $N$
-factors for the unperturbed boundary layer,
 $A=0.0$
, the streaky boundary layer with
 $A=2.0$
, and two ‘artificial’ basic states: a two-dimensional boundary layer composed of the unperturbed boundary layer, and the MFD of the
 $A=2.0$
case and a three-dimensional boundary layer composed of the boundary layer with
 $A=2.0$
without the MFD of the perturbation. (b) Evolution of the ratio between the cross-plane integrals of the production terms associated with the streamwise velocity gradients and the kinetic energy of the perturbation.

Isocontours of the modulus of streamwise velocity fluctuations associated with the antisymmetric first mode with subharmonic wavelength
 $\unicode[STIX]{x1D706}=2\unicode[STIX]{x1D706}_{ST}$
and frequency
 $\unicode[STIX]{x1D714}=0.045$
, at streamwise positions (a)
 $R=600$
, (b)
 $R=1200$
, (c)
 $R=1800$
and (d)
 $R=2400$
, and for streak amplitude parameter
 $A=2.0$
. The isolines of basic state mass flux
 $\bar{\unicode[STIX]{x1D70C}}\bar{u}=0.1:0.1:0.9$
are included.

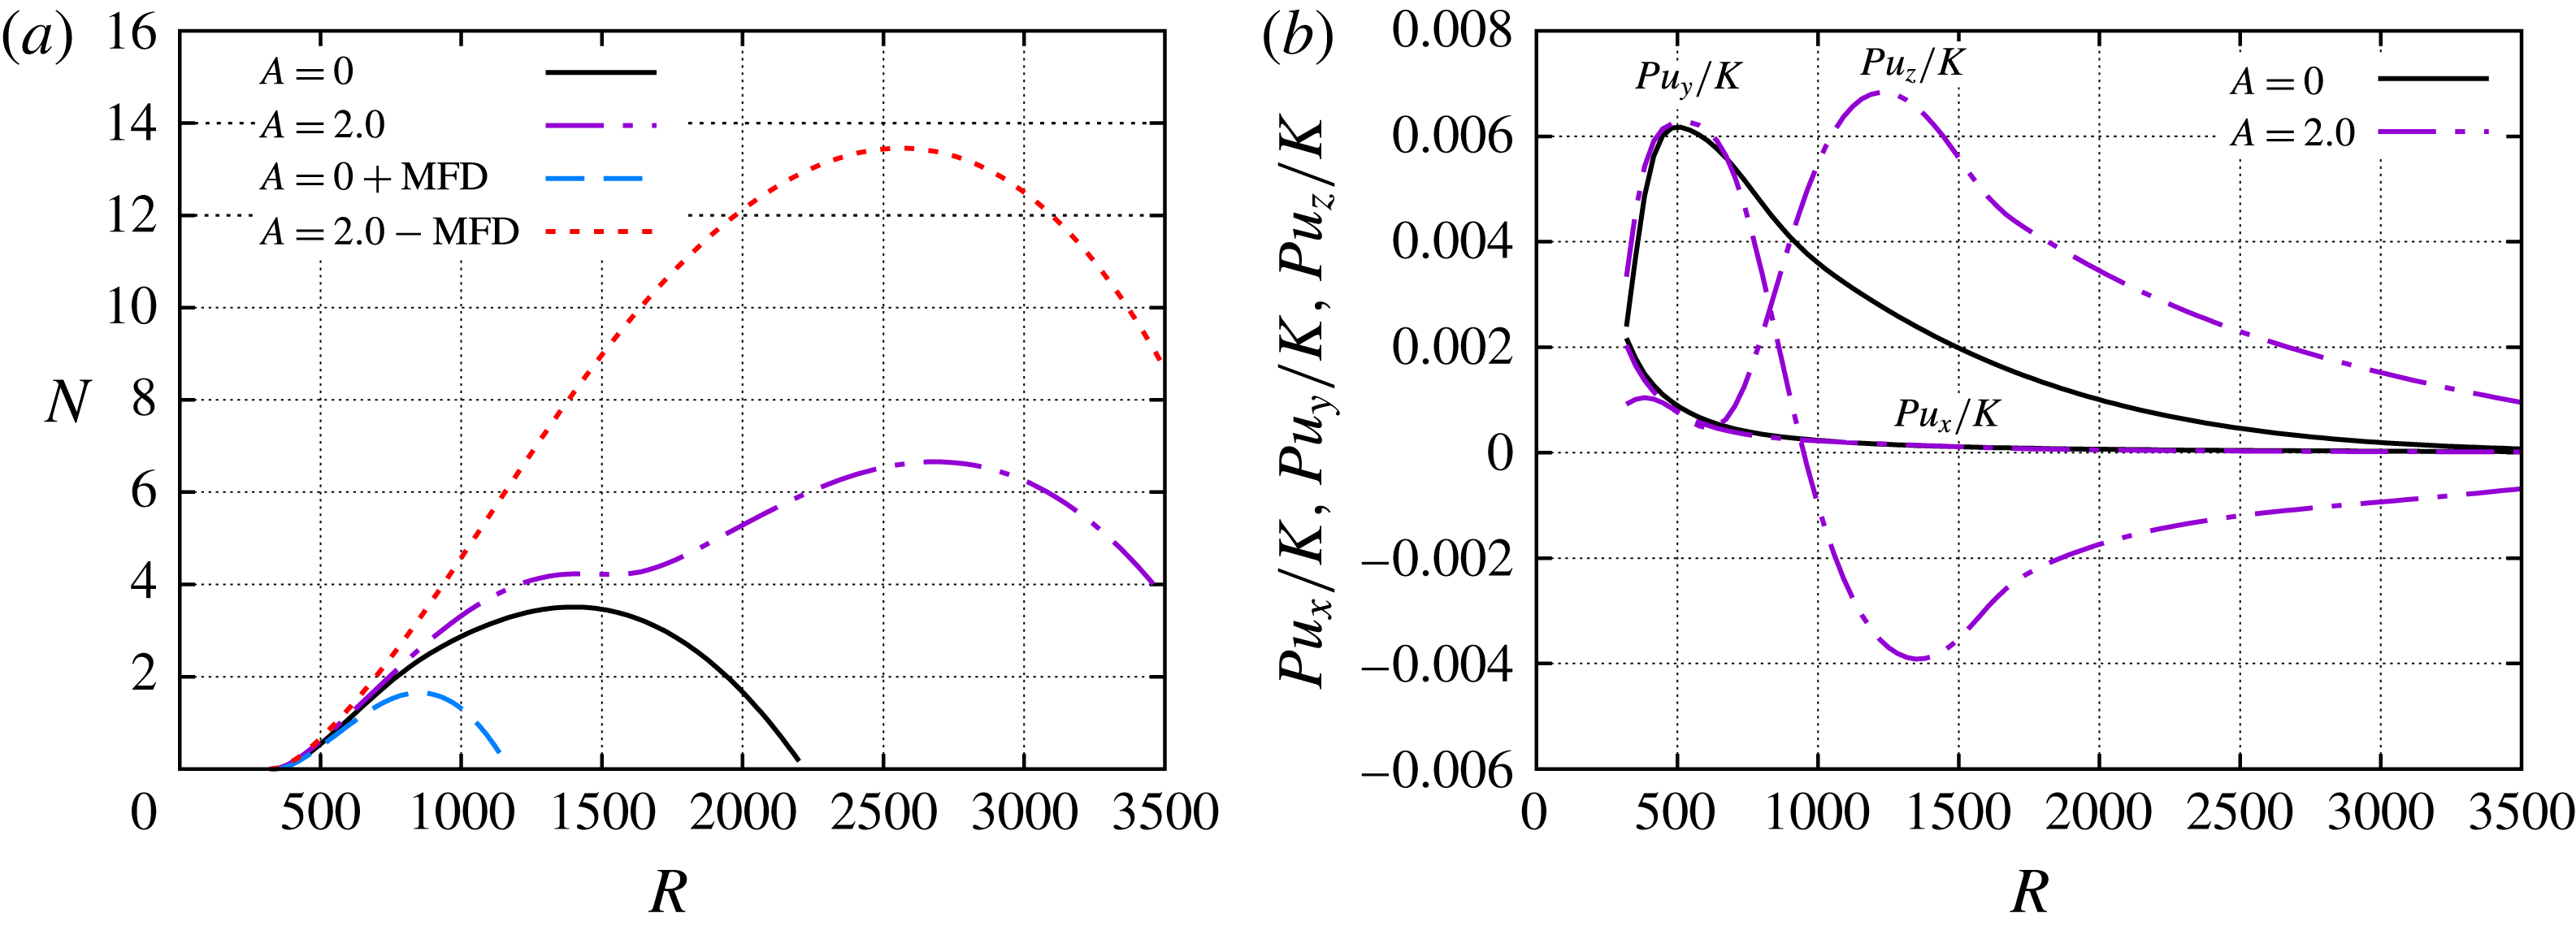
Further analysis of the most amplified instability wave from figure 7(b) is presented in figure 9(a), wherein the
 $N$
-factor evolution of the subharmonic antisymmetric mode with
 $\unicode[STIX]{x1D714}=0.045$
is compared between the
 $A=2.0$
and
 $A=0.0$
cases. In addition, figure 9(a) also includes the
 $N$
-factor evolution for two ‘artificial’ basic states: a two-dimensional basic state corresponding to the spanwise average of the
 $A=2.0$
flow, which corresponds to the unperturbed flow (
 $A=0.0$
) plus the mean flow distortion due to the streak, and the perturbed flow with
 $A=2.0$
minus the MFD of the perturbation. These extra cases are introduced to shed further light on the primary mechanism for the effect of the streak on the enhanced amplification of the first-mode instability. By comparing the
 $N$
-factor for the first extra case (
 $A=0.0+\text{MFD}$
) with that for the unperturbed flow (
 $A=0.0$
), we can see that the MFD has a strong stabilizing influence on the first mode. The
 $N$
-factor evolution for the second ‘artificial’ case (
 $A=2.0-\text{MFD}$
) indicates a larger region of amplification relative to the baseline case (
 $A=0.0$
), revealing that the previously discussed downstream shift in the
 $N$
-factor maximum at
 $A=2.0$
is the result of the spanwise gradients of the modified flow. Similar conclusions may be drawn from figure 9(b), which shows the evolution of the normalized production terms (2.9) associated with the streamwise velocity gradients, namely,
 $$\begin{eqnarray}Pu_{x}=\int _{z}\int _{y}Iu_{x}\,\text{d}y\,\text{d}z,\quad Pu_{y}=\int _{z}\int _{y}Iu_{y}\,\text{d}y\,\text{d}z,\quad Pu_{z}=\int _{z}\int _{y}Iu_{z}\,\text{d}y\,\text{d}z,\end{eqnarray}$$
for the subharmonic antisymmetric wave with
 $A=2.0$
and first-mode wave with
 $A=0.0$
and
 $\unicode[STIX]{x1D714}=0.045$
. The production terms are normalized with the disturbance kinetic energy defined by (2.7). The production terms for the unperturbed boundary layer and the
 $A=2.0$
case are almost coincident at the earlier streamwise stations because the streak amplitudes are small, i.e.
 $As_{u}<0.1$
for
 $R<500$
(figure 1
a). As the streak amplitude becomes relevant for
 $R>500$
, the wall-normal term
 $Pu_{y}/K$
deviate from the unperturbed case and becomes negative, which denotes a stabilization effect, and the spanwise term
 $Pu_{z}/K$
notably increases, which denotes a destabilization effect. For the same instability wave, figure 10(a–d) shows the isocontours of the streamwise velocity fluctuation at streamwise locations
 $R=600$
, 1200, 1800 and 2400. The concentration of the instability wave peaks on the symmetry plane with reduced boundary-layer thickness at the upstream station
 $R=600$
, and is successively displaced toward the sides of the centreline symmetry plane (
 $z=\unicode[STIX]{x1D706}/2$
), where the spanwise gradients are larger (Paredes et al.
Reference Paredes, Choudhari and Li2016c
), indicating a gradual morphing into streak instability. As previously mentioned, the original antisymmetric first mode with subharmonic spanwise wavelength becomes the subharmonic, sinuous mode of streak instability. A consequence of this change of the first-mode wave into a streak instability mode, the associated phase speed increases, as well as the amplified frequency range. As indicated by figure 7(b), the most amplified frequency of the antisymmetric subharmonic mode for the
 $A=2.0$
case is larger (
 $\unicode[STIX]{x1D714}=0.045$
) than for
 $A=1.5$
(
 $\unicode[STIX]{x1D714}=0.040$
).
 $N$
-factor envelopes of first-mode waves with spanwise wavelength equal to (a)
 $\unicode[STIX]{x1D706}=3/2\unicode[STIX]{x1D706}_{ST}$
and (b)
 $\unicode[STIX]{x1D706}=5/3\unicode[STIX]{x1D706}_{ST}$
. The selected disturbance frequencies to build the envelopes are (a)
 $\unicode[STIX]{x1D714}=0.030$
, 0.038, 0.046 and 0.054, and (b)
 $\unicode[STIX]{x1D714}=0.032$
, 0.040, 0.048 and 0.056. Note that the most amplified disturbance frequency and its wave angle at the
 $N$
-factor peak location, i.e.
 $(\unicode[STIX]{x1D714},\unicode[STIX]{x1D719})$
, are specified within parentheses for each streak amplitude parameter.

Analysis of first mode with spanwise wavelength
 $\unicode[STIX]{x1D706}=5/3\unicode[STIX]{x1D706}_{ST}$
and frequency
 $\unicode[STIX]{x1D714}=0.048$
for streak amplitude parameter
 $A=2.0$
. (a) Evolution of
 $N$
-factors for the unperturbed boundary layer,
 $A=0.0$
, the streaky boundary layer with
 $A=2.0$
, and two ‘artificial’ basic states: a two-dimensional boundary layer composed of the unperturbed boundary layer and the MFD of the
 $A=2.0$
case, and a three-dimensional boundary layer composed of the boundary layer with
 $A=2.0$
without the MFD of the perturbation. Also, isocontours of the real part of the streamwise velocity fluctuation at (b)
 $R=600$
, (c)
 $R=800$
, (d)
 $R=1000$
, (e)
 $R=1200$
and (f)
 $R=1400$
. The isolines of basic state mass flux
 $\bar{\unicode[STIX]{x1D70C}}\bar{u}=0.1:0.2:0.9$
are included.

Isocontours of the modulus of streamwise velocity fluctuations associated with the first mode with spanwise wavelength
 $\unicode[STIX]{x1D706}=5/3\unicode[STIX]{x1D706}_{ST}$
and frequency
 $\unicode[STIX]{x1D714}=0.048$
, at streamwise positions (a)
 $R=600$
, (b)
 $R=1200$
, (c)
 $R=1800$
and (d)
 $R=2400$
, and for streak amplitude parameter
 $A=2.0$
. The isolines of basic state mass flux
 $\bar{\unicode[STIX]{x1D70C}}\bar{u}=0.1:0.1:0.9$
are included.

Next, the effect of the streak on first-mode waves with spanwise wavelengths between
 $\unicode[STIX]{x1D706}=\unicode[STIX]{x1D706}_{ST}$
and
 $\unicode[STIX]{x1D706}=2\unicode[STIX]{x1D706}_{ST}$
is studied. Figures 11(a) and 11(b) show the
 $N$
-factor evolution for first-mode waves with
 $\unicode[STIX]{x1D706}=3/2\unicode[STIX]{x1D706}_{ST}$
and
 $\unicode[STIX]{x1D706}=5/3\unicode[STIX]{x1D706}_{ST}$
, respectively. For both cases, the effect is similar to the antisymmetric subharmonic case (
 $\unicode[STIX]{x1D706}=2\unicode[STIX]{x1D706}_{ST}$
) of figure 7, although the
 $N$
-factor values at every streamwise location remain below the value for the subharmonic case (
 $\unicode[STIX]{x1D706}=2\unicode[STIX]{x1D706}_{ST}$
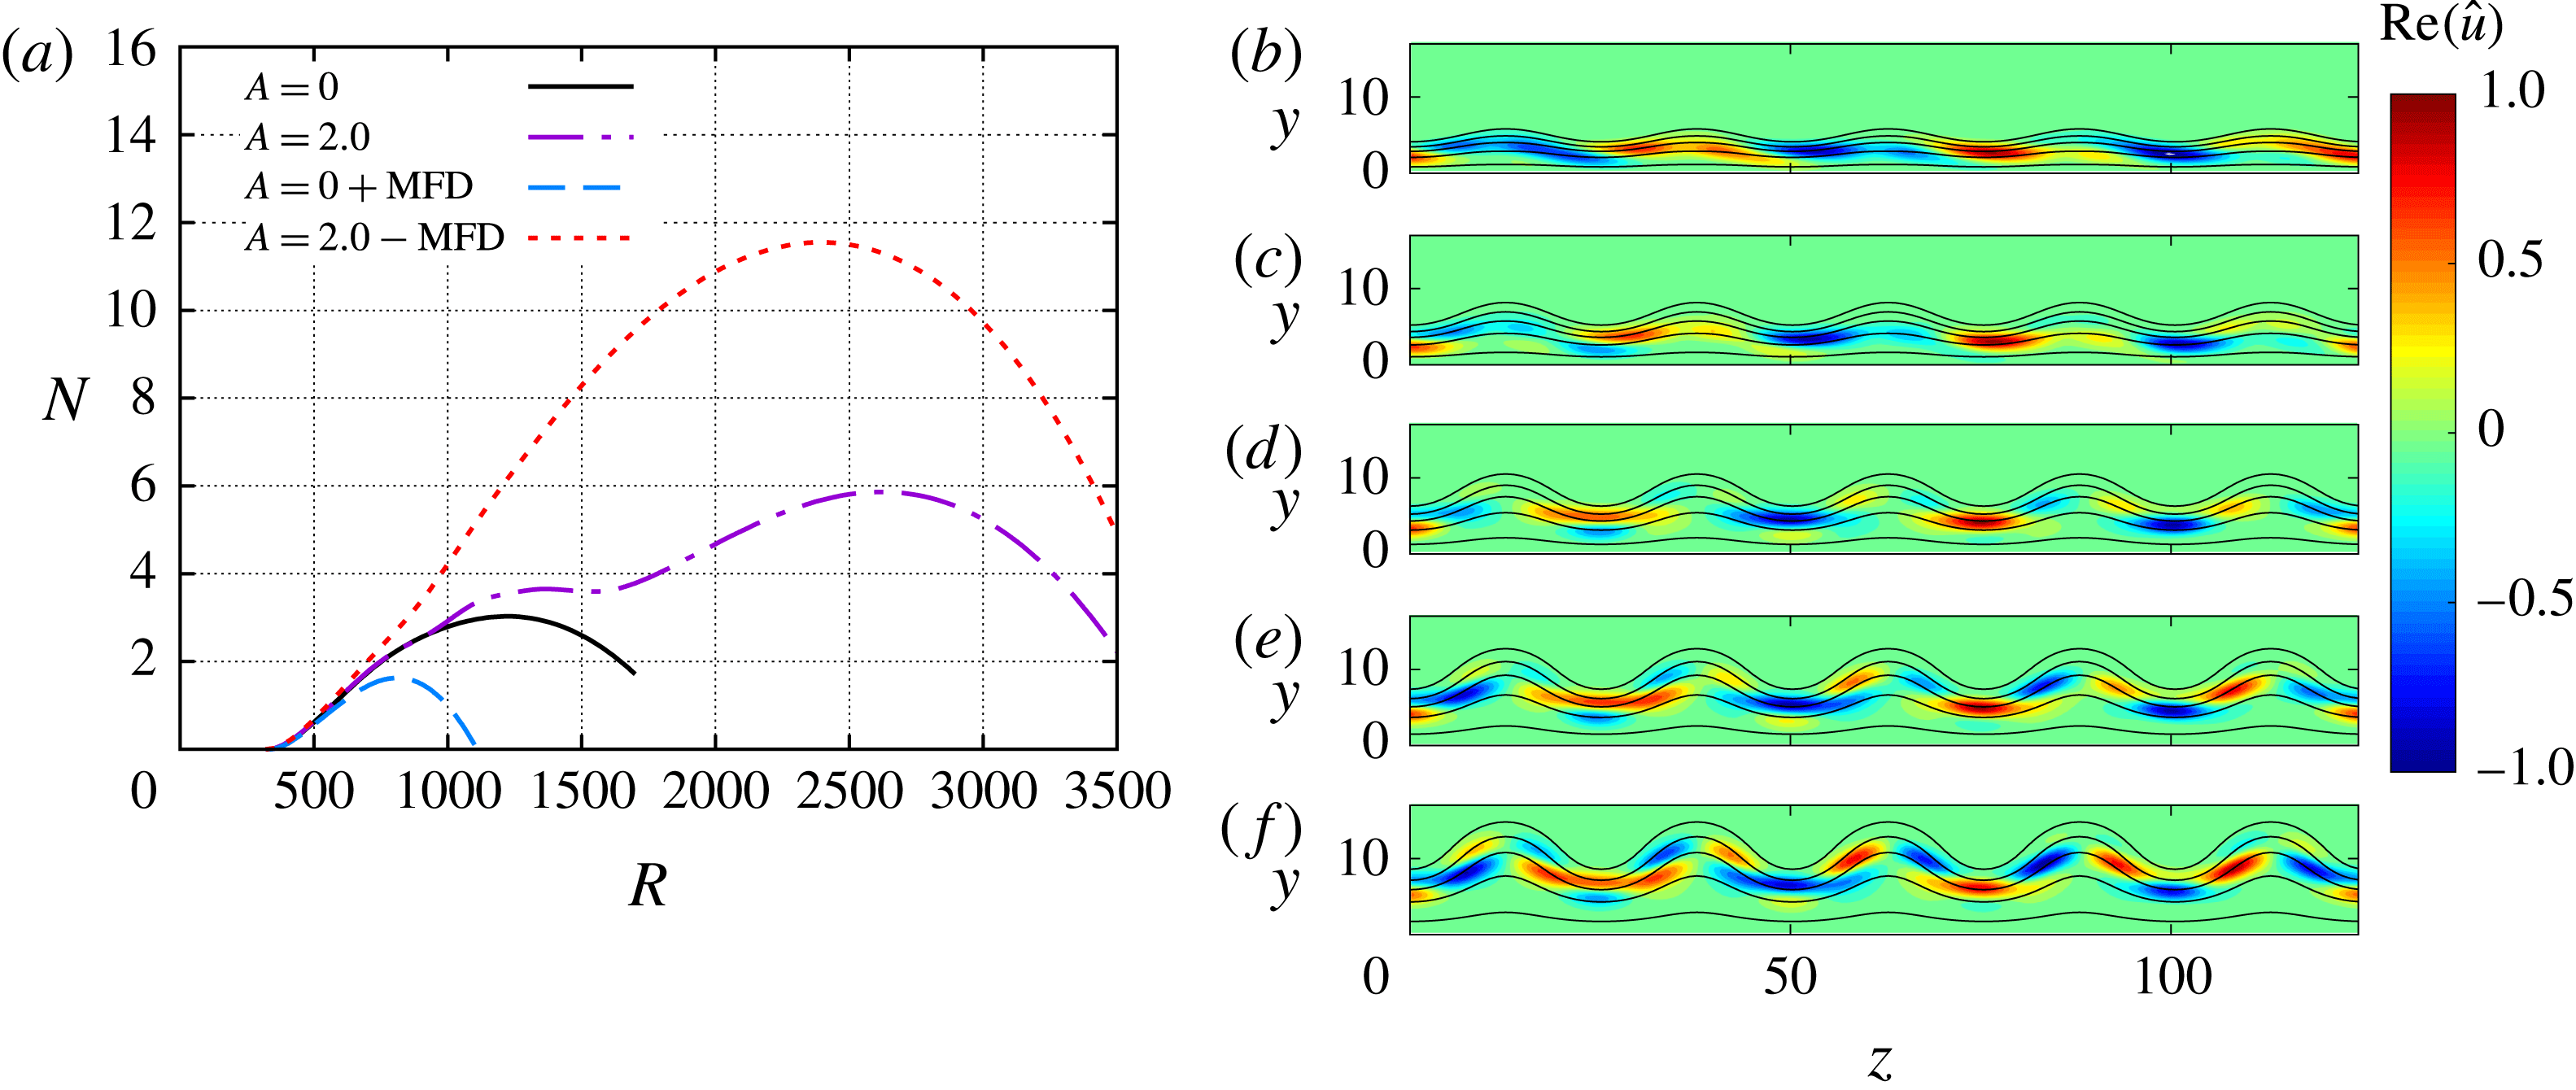
) discussed above. An analysis equivalent to figure figure 9 for the antisymmetric, subharmonic mode is shown for the
 $\unicode[STIX]{x1D706}=5/3\unicode[STIX]{x1D706}_{ST}$
case with
 $\unicode[STIX]{x1D714}=0.048$
in figure 12(a). Similar to the antisymmetric subharmonic case, the MFD is found to strongly stabilize the first mode, whereas the spanwise gradients destabilize the mode, with the net effect being significantly destabilizing (max
 $N$
-factor of
 $5.9$
relative to
 $N\approx 3.0$
for the baseline case with
 $A=0.0$
). Figure 12(b–f) illustrates the streamwise evolution of the real part of streamwise velocity fluctuation associated with the mode from figure 12(a). At
 $R=600$
(figure 12
b), when the streak amplitude is small the three wavelengths of the instability wave are clearly identified within the domain of five streak wavelengths included in the figure. Further downstream, the mode shape becomes more complex and the number of wavelengths becomes hard to identify. Figure 13 shows the evolution of the modulus of the streamwise velocity fluctuation for the same instability wave, i.e.
 $\unicode[STIX]{x1D706}=5/3\unicode[STIX]{x1D706}_{ST}$
and
 $\unicode[STIX]{x1D714}=0.048$
. Unlike figure 12(b), the three wavelengths of the disturbance cannot be distinguished in the modulus plot at the same location (figure 13
a). The fluctuation concentrates around the sides of the streak where the spanwise gradients of
 $\bar{u}$
are larger, as previously observed for the antisymmetric subharmonic case in figure 10. Note that, for
 $\unicode[STIX]{x1D706}=5/3\unicode[STIX]{x1D706}_{ST}$
, the modulus of the fluctuation is no longer symmetric with respect to the streak symmetry planes. As explained before, for the unperturbed flow there exist two first-mode waves with equal but opposite angles with respect to the free stream. Therefore, for
 $\unicode[STIX]{x1D706}\neq \unicode[STIX]{x1D706}_{ST}$
and
 $\unicode[STIX]{x1D706}\neq 2\unicode[STIX]{x1D706}_{ST}$
, there is a second first-mode wave modulated by the streak with an equivalent mode shape corresponding to
 $\hat{\boldsymbol{q}}^{-}(x,y,z)=\hat{\boldsymbol{q}}^{+}(x,y,-z)$
, where the superscripts
 $+$
and
 $-$
indicate the two waves from a pair.
3.2.2 Stabilization of nearly planar waves,
$\unicode[STIX]{x1D706}>2\unicode[STIX]{x1D706}_{ST}$

The effect of streaks on oblique first-mode waves with spanwise wavelengths larger than
 $\unicode[STIX]{x1D706}=2\unicode[STIX]{x1D706}_{ST}$
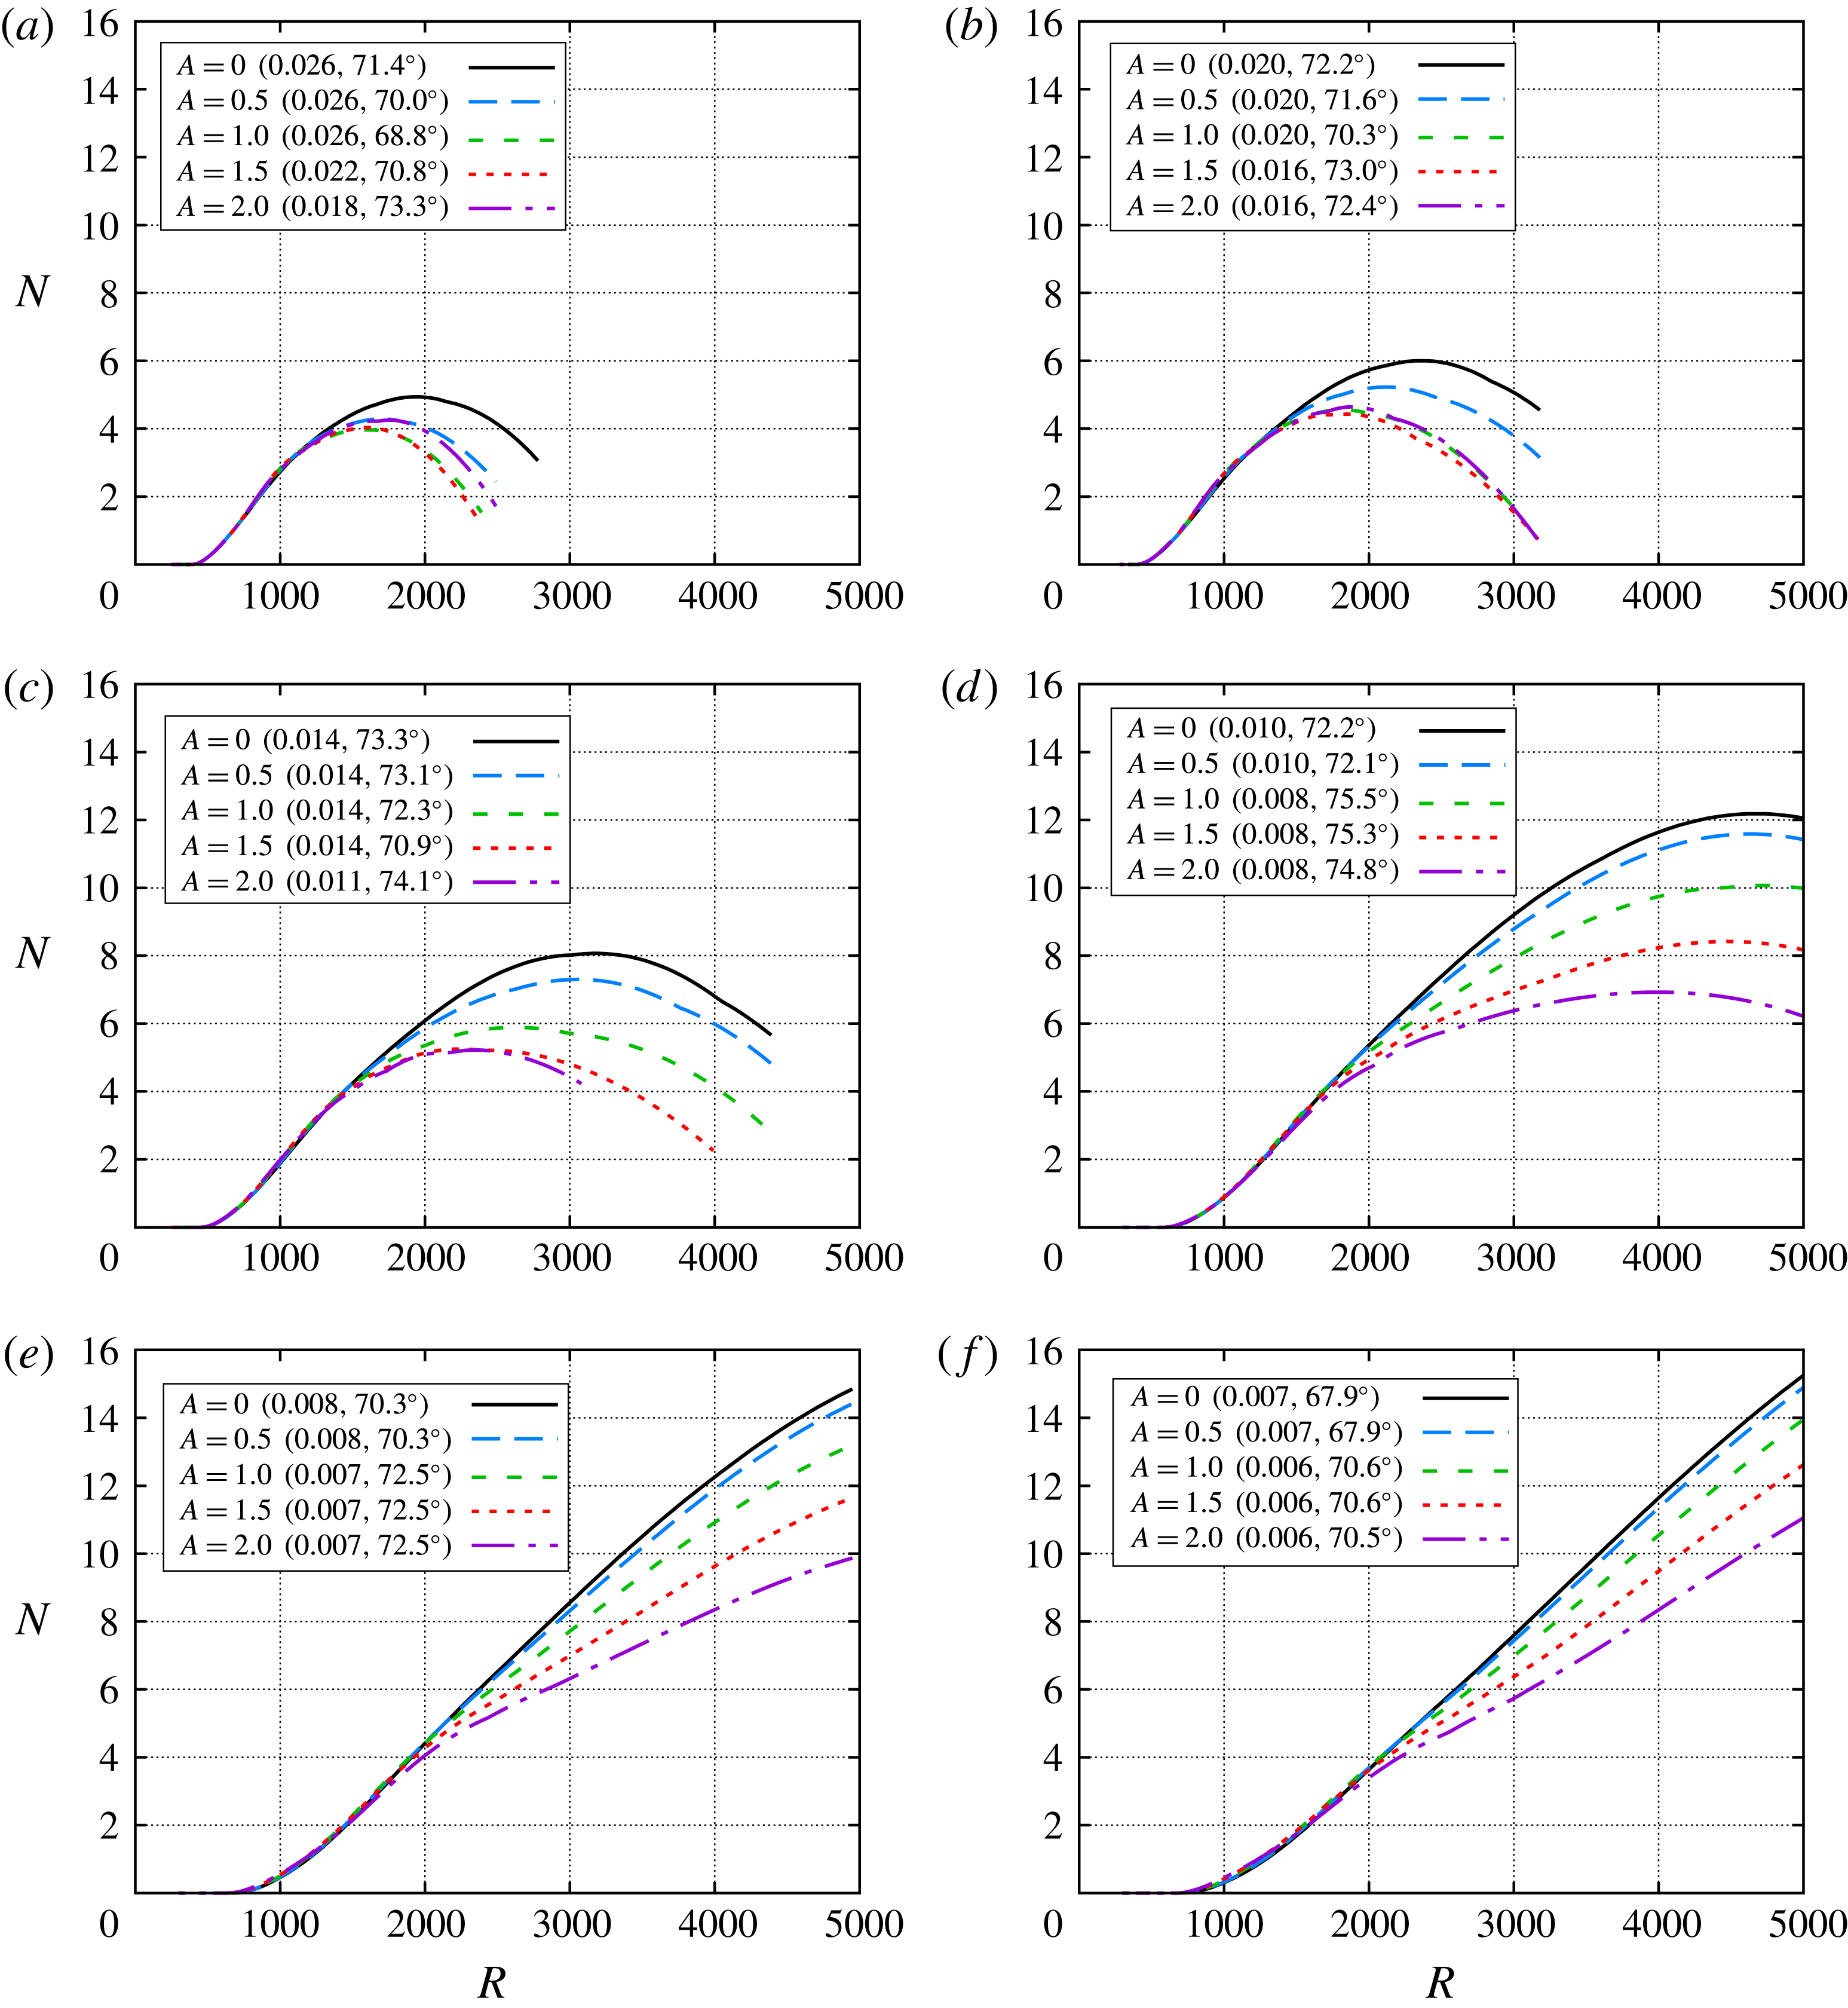
is studied next. Figure 14(a–f) shows the
 $N$
-factor envelopes for selected streak amplitude parameters and instability wavelengths of
 $\unicode[STIX]{x1D706}=5/2\unicode[STIX]{x1D706}_{ST}$
,
 $3\unicode[STIX]{x1D706}_{ST}$
,
 $4\unicode[STIX]{x1D706}_{ST}$
,
 $6\unicode[STIX]{x1D706}_{ST}$
,
 $8\unicode[STIX]{x1D706}_{ST}$
and
 $10\unicode[STIX]{x1D706}_{ST}$
, respectively. For each of these longer spanwise wavelengths, the introduction of streaks yields a stabilization of the first-mode waves with respect to the unperturbed case (
 $A=0.0$
). For
 $\unicode[STIX]{x1D706}=5/2\unicode[STIX]{x1D706}_{ST}$
(figure 14
a),
 $\unicode[STIX]{x1D706}=3\unicode[STIX]{x1D706}_{ST}$
(figure 14
b) and
 $\unicode[STIX]{x1D706}=4\unicode[STIX]{x1D706}_{ST}$
(figure 14
c) the magnitude of stabilizing effect is not strictly monotonic with respect to increasing streak amplitude. Therefore, there is an optimum streak amplitude for maximum stabilization of the first-mode waves at these spanwise wavelengths. On the other hand, the results for the larger wavelengths in figure 14(d–f) indicate a progressively increasing stabilization effect as the streak amplitude becomes larger.
 $N$
-factor envelopes of first-mode waves with spanwise wavelength equal to (a)
 $\unicode[STIX]{x1D706}=5/2\unicode[STIX]{x1D706}_{ST}$
, (b)
 $\unicode[STIX]{x1D706}=3\unicode[STIX]{x1D706}_{ST}$
, (c)
 $\unicode[STIX]{x1D706}=4\unicode[STIX]{x1D706}_{ST}$
, (d)
 $\unicode[STIX]{x1D706}=6\unicode[STIX]{x1D706}_{ST}$
, (e)
 $\unicode[STIX]{x1D706}=8\unicode[STIX]{x1D706}_{ST}$
and (f)
 $\unicode[STIX]{x1D706}=10\unicode[STIX]{x1D706}_{ST}$
. The selected disturbance frequencies to build the envelopes are (a)
 $\unicode[STIX]{x1D714}=0.018$
, 0.022, 0.026 and 0.030, (b)
 $\unicode[STIX]{x1D714}=0.012$
, 0.016, 0.020, 0.024 and 0.028, (c)
 $\unicode[STIX]{x1D714}=0.011$
, 0.014, 0.017 and 0.020, (d)
 $\unicode[STIX]{x1D714}=0.006$
, 0.008, 0.010 and 0.012, (e)
 $\unicode[STIX]{x1D714}=0.006$
, 0.007, 0.008 and 0.009 and (f)
 $\unicode[STIX]{x1D714}=0.005$
, 0.006, 0.007 and 0.008. Note that the most amplified disturbance frequency and its wave angle at the
 $N$
-factor peak location, i.e.
 $(\unicode[STIX]{x1D714},\unicode[STIX]{x1D719})$
, are specified within parentheses for each streak amplitude parameter.

The relative contributions of the mean flow distortion and spanwise variations associated with the streak on the amplification characteristics of instability waves with
 $\unicode[STIX]{x1D706}=6\unicode[STIX]{x1D706}_{ST}$
are shown in figure 15(a,b). As previously observed for the antisymmetric subharmonic case (figure 9
a) and the
 $\unicode[STIX]{x1D706}=5/3\unicode[STIX]{x1D706}_{ST}$
case (figure 12
a), the
 $N$
-factor values for the
 $A=0.0+\text{MFD}$
basic state are much lower than for the rest of basic states. In this case, the
 $N$
-factor values for the
 $A=2.0-\text{MFD}$
basic state are slightly larger than those for the unperturbed, two-dimensional boundary layer (
 $A=0.0$
). This result indicates that the destabilizing effect of the spanwise gradients is much lower for the long wavelength (
 $\unicode[STIX]{x1D706}>2\unicode[STIX]{x1D706}_{ST}$
) than for the short wavelength modes (
 $\unicode[STIX]{x1D706}\leqslant 2\unicode[STIX]{x1D706}_{ST}$
). Therefore, the stabilizing effect of the MFD dominates, yielding a significant
 $N$
-factor reduction for the long wavelength first-mode waves in spanwise modulated boundary-layer flow. Figure 15(b) shows that the values of the ratio between the production terms and the kinetic energy are significantly lower than for the subharmonic case of figure 9(b). Here, the lower branch neutral station occurs at
 $R=650$
, where the streak amplitude is large enough (
 $As_{u}=0.12$
) to yield larger production terms associated with spanwise gradients (
 $Pu_{z}$
) than the production term
 $Pu_{y}$
. As the instability wave evolves downstream and the streak amplitude begins to decrease, the spanwise term
 $Pu_{z}/K$
decreases and the wall-normal term
 $Pu_{y}/K$
becomes the dominant term at
 $R>3720$
.
Analysis of first mode with spanwise wavelength
 $\unicode[STIX]{x1D706}=6\unicode[STIX]{x1D706}_{ST}$
and frequency
 $\unicode[STIX]{x1D714}=0.010$
for streak amplitude parameter
 $A=2.0$
. (a) Evolution of
 $N$
-factors for the unperturbed boundary layer,
 $A=0.0$
, the streaky boundary layer with
 $A=2.0$
and two ‘artificial’ basic states: a two-dimensional boundary layer composed of the unperturbed boundary layer and the MFD of the
 $A=2.0$
case, and a three-dimensional boundary layer composed of the perturbed boundary layer with
 $A=2.0$
without the MFD of the perturbation. (b) Evolution of the ratio between the production terms associated with the streamwise velocity gradients and the kinetic energy of the perturbation.

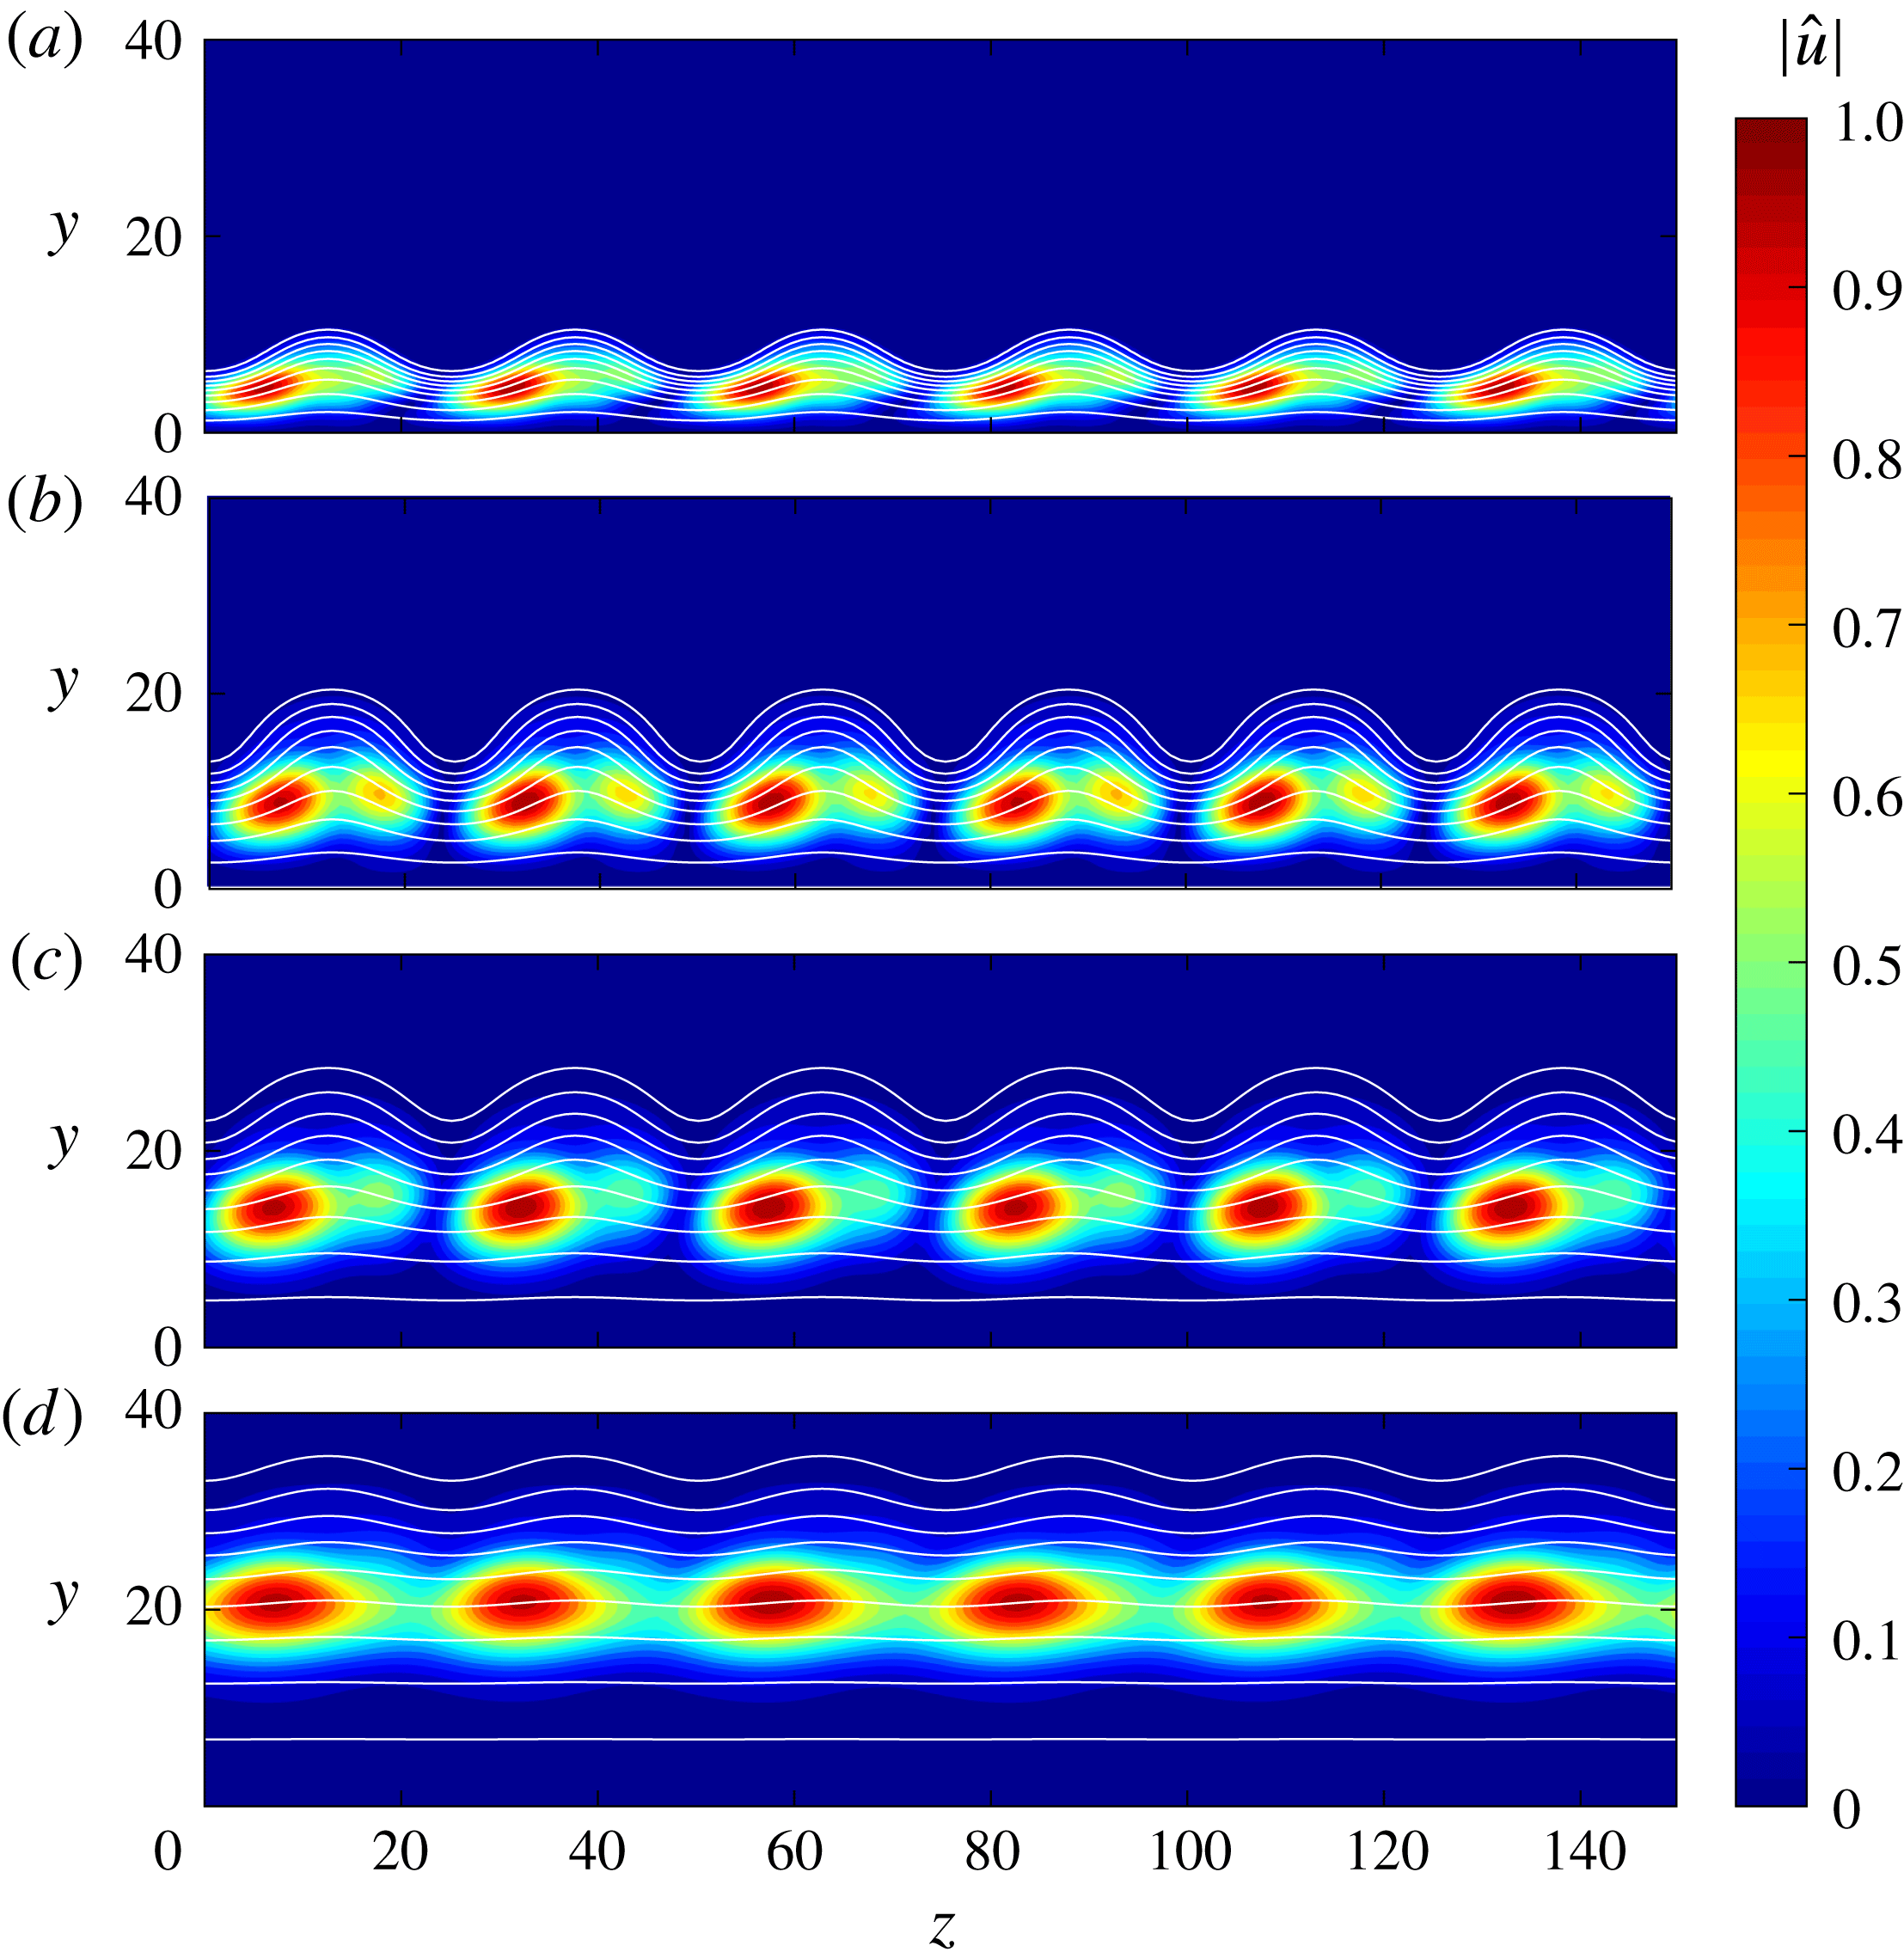
Figure 16 shows the streamwise evolution of the modulus of streamwise velocity perturbation associated with the instability mode from figure 15. As previously indicated, there exists a pair of waves with the same amplification properties but spanwise-opposite mode shapes that are related via
 $\tilde{\boldsymbol{q}}^{-}(x,y,z)=\tilde{\boldsymbol{q}}^{+}(x,y,-z)$
. The mode shapes of these long wavelength waves are clearly differentiable from the mode shapes from the short wavelength cases in figures 10 and 13 for
 $\unicode[STIX]{x1D706}=2\unicode[STIX]{x1D706}_{ST}$
and
 $\unicode[STIX]{x1D706}=5/3\unicode[STIX]{x1D706}_{ST}$
, respectively. In the short wavelength cases, the concentration of the fluctuation evolved toward the upper part of the boundary layer where the spanwise gradients are larger. In contrast, the concentration of the fluctuations in the present long wavelength case remains in the interior of the boundary layer.
Isocontours of the modulus of streamwise velocity fluctuations associated with the first mode with spanwise wavelength
 $\unicode[STIX]{x1D706}=6\unicode[STIX]{x1D706}_{ST}$
and frequency
 $\unicode[STIX]{x1D714}=0.010$
, at streamwise positions (a)
 $R=1000$
, (b)
 $R=2000$
, (c)
 $R=3000$
and (d)
 $R=4000$
, and for streak amplitude parameter
 $A=2.0$
. The isolines of basic state mass flux
 $\bar{\unicode[STIX]{x1D70C}}\bar{u}=0.1:0.1:0.9$
are included.

(a)
 $N$
-factor envelopes for selected streak amplitude parameters
 $A=0.0$
, 0.5, 1.0, 1.5 and 2.0 and spanwise wavelengths within the range
 $\unicode[STIX]{x1D706}\in [\unicode[STIX]{x1D706}_{ST},11\unicode[STIX]{x1D706}_{ST}]$
. (b)
 $N$
-factor envelope for streak amplitude parameter
 $A=2.5$
separated into destabilized antisymmetric subharmonic modes (
 $\unicode[STIX]{x1D706}=2\unicode[STIX]{x1D706}_{ST}$
) with frequencies within the range
 $\unicode[STIX]{x1D714}\in [0.040,0.060]$
and stabilized long wavelength modes (
 $\unicode[STIX]{x1D706}\in [3\unicode[STIX]{x1D706}_{ST},11\unicode[STIX]{x1D706}_{ST}]$
) with frequencies within the range
 $\unicode[STIX]{x1D714}\in [0.004,0.024]$
.

3.2.3 Overall effect on predicted transition onset
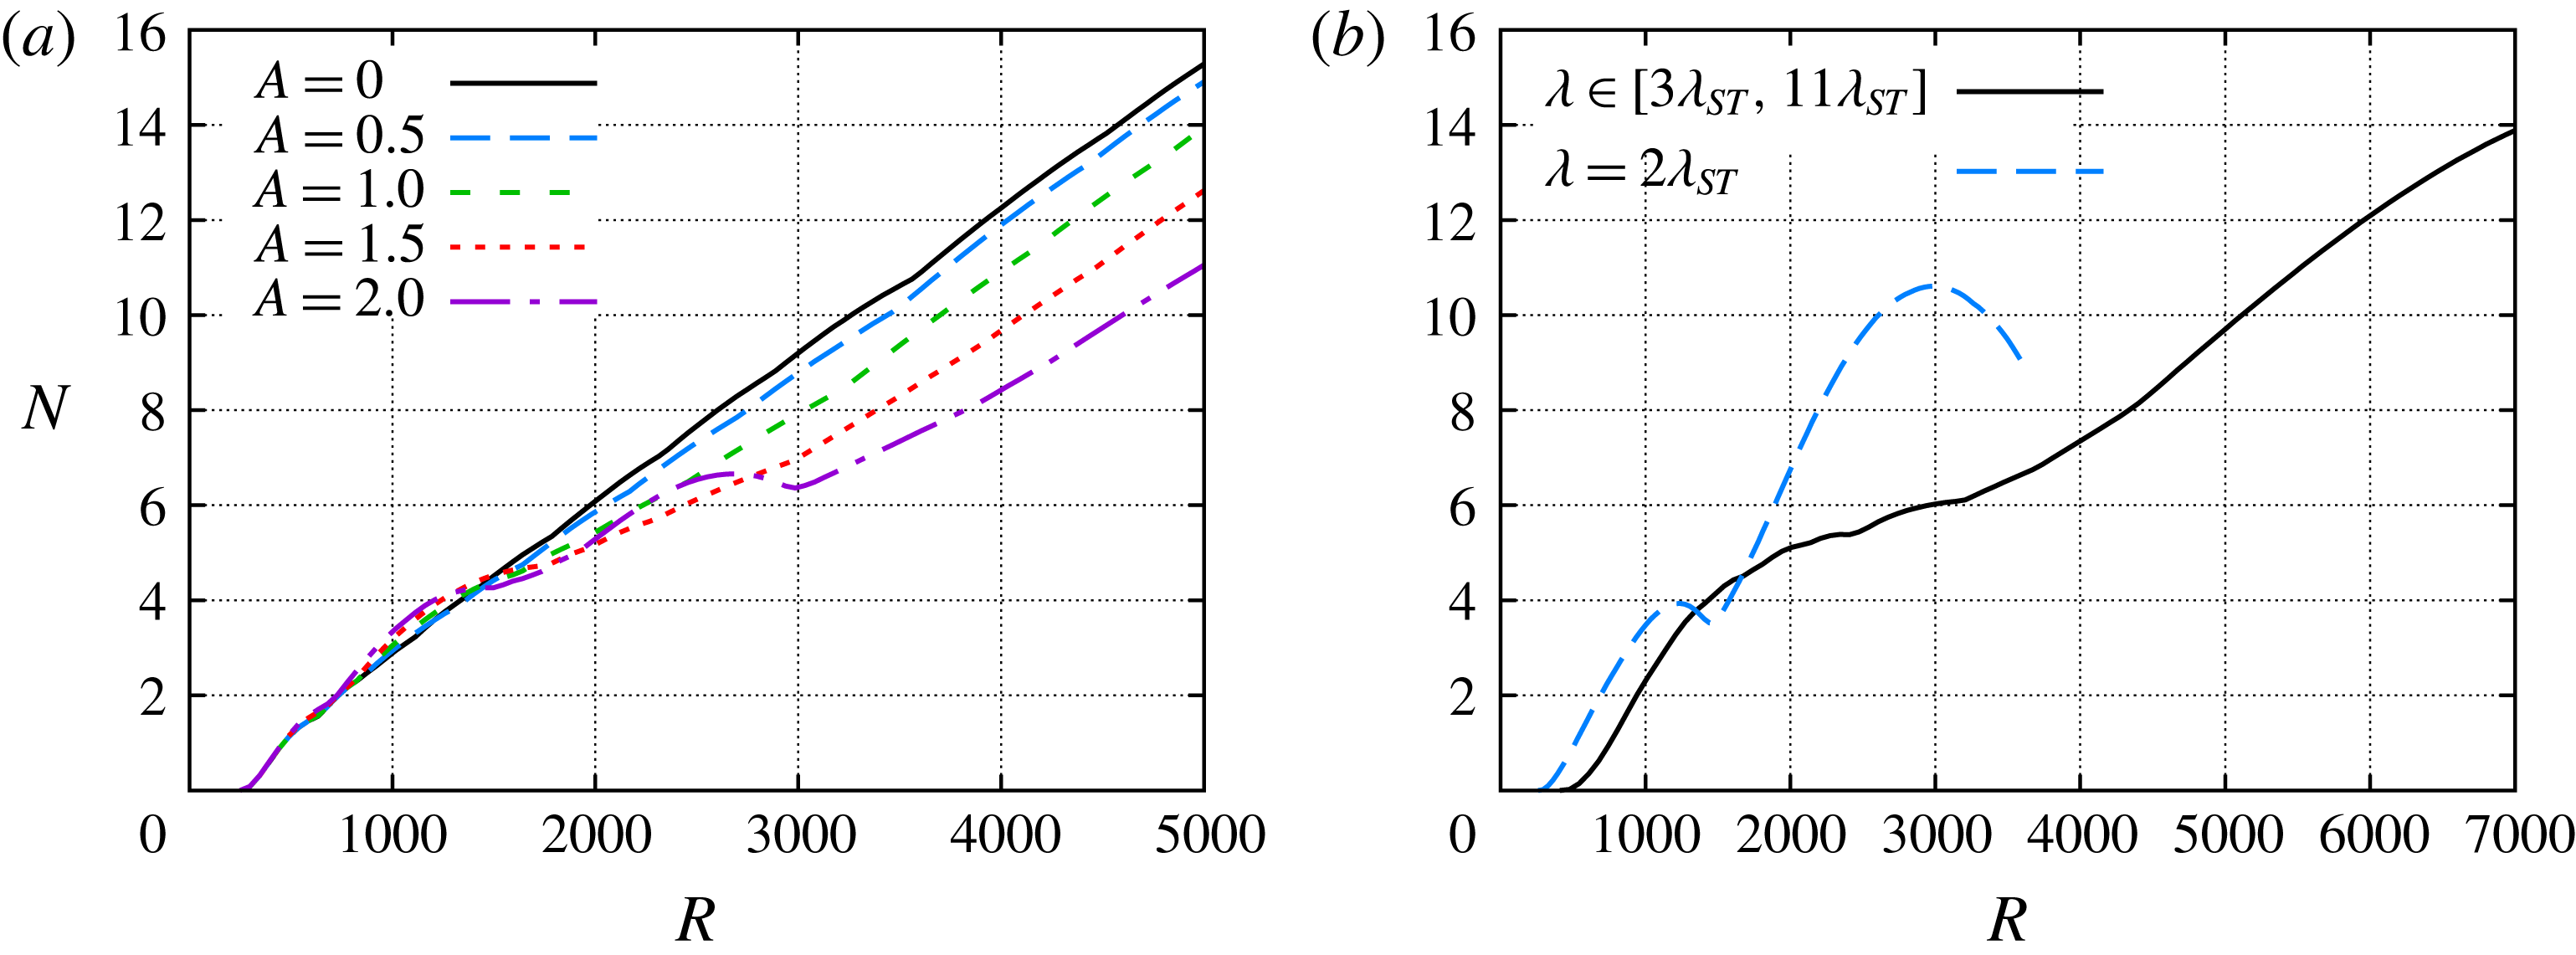
The overall effect of the streaks on the oblique first-mode waves is examined next, in an effort to understand the resulting shift in the transition onset location. Figure 17(a) shows the
 $N$
-factor envelopes for all spanwise wavelengths considered thus far, namely,
 $\unicode[STIX]{x1D706}=(1,4/3,3/2,5/3,2,5/2,3,4,5,6,7,8,9,10,11)\unicode[STIX]{x1D706}_{ST}$
, and a range of relevant frequencies (
 $\unicode[STIX]{x1D714}\in [0.004,0.090]$
) for each wavelength. The previously analysed results are summarized in this plot: the first-mode waves with short wavelengths (
 $\unicode[STIX]{x1D706}\leqslant 2\unicode[STIX]{x1D706}_{ST}$
), which reach moderate
 $N$
-factor values (
 $N<5$
) and would lead to transition only under noisy conditions, are destabilized, but the first-mode waves with longer spanwise wavelengths (
 $\unicode[STIX]{x1D706}>2\unicode[STIX]{x1D706}_{ST}$
), which can reach higher
 $N$
-factor values that typically correlate with the transition onset location in quiet environments are stabilized. Therefore, the results presented in §§ 3.2.1 and 3.2.2 suggest a downstream movement of the transition location in quiet environments, so long as the destabilized subharmonic waves do not cause an earlier onset of transition. These computational findings are not contradictory to the experimental measurements of Holloway & Sterrett (Reference Holloway and Sterrett1964) with supersonic boundary-layer-edge conditions, which showed an upstream movement of the transition location for any roughness height, because of the conventional, i.e. noisy nature of the high-speed facility used in their experiments, which would suggest a likely correlation between the measured transition location and a low
 $N$
-factor value (
 $N<5$
) such as that achieved by short wavelength first-mode waves.
We next examine the effect of streak amplitude parameter on the expected transition behaviour in a benign disturbance environment such that the onset of transition correlates with
 $N=10$
. To that end, the
 $N$
-factor values for both antisymmetric subharmonic modes and long wavelength modes for a higher streak amplitude parameter of
 $A=2.5$
are presented in figure 17(b). The streamwise domain is increased up to
 $R=7000$
, because instability modes with long spanwise wavelength do not reach
 $N=10$
for
 $R\leqslant 5000$
. Specifically, the first-mode wave with
 $\unicode[STIX]{x1D706}=11\unicode[STIX]{x1D706}_{ST}$
and
 $\unicode[STIX]{x1D714}=0.005$
reaches
 $N=10$
at
 $R=5116$
. Paredes et al. (Reference Paredes, Choudhari and Li2016c
) showed that the antisymmetric subharmonic mode or, equally, the subharmonic sinuous mode, reaches
 $N=10$
for a streak amplitude parameter of
 $A\approx 2.5$
. Figure 17(b) shows that the peak
 $N$
-factor value reached by the SS mode is
 $N=10.6$
.
Table 1 shows the effect of streak amplitude parameters on the streamwise location,
 $R$
, where the selected critical
 $N$
-factor values of
 $N=5$
, 7 and 10 are reached, and on the frequency,
 $\unicode[STIX]{x1D714}$
, and spanwise wavelength,
 $\unicode[STIX]{x1D706}$
, of the corresponding instability mode. For
 $A=1.0$
, the transition location moves downstream with respect to the unperturbed case. The instability wave that first reaches either of the critical
 $N$
-factor values has a lower frequency and a larger wavelength than the first-mode wave corresponding to the unperturbed basic state with
 $A=0.0$
. For a larger streak amplitude parameter of
 $A=2.0$
, the SS mode reaches
 $N=5$
earlier than the long wavelength first-mode waves, although farther downstream than the
 $\unicode[STIX]{x1D706}=4\unicode[STIX]{x1D706}_{ST}$
wave for
 $A=1.0$
. The frequency associated with the SS mode is much larger than the frequency associated with the
 $\unicode[STIX]{x1D706}=4\unicode[STIX]{x1D706}_{ST}$
wave for
 $A=1.0$
. The trend of decreasing frequency and increasing wavelength observed from
 $A=0.0$
to
 $A=1.0$
is also observed from
 $A=1.0$
to
 $A=2.0$
for the larger
 $N$
-factor values of
 $N=7$
and 10. The last row of table 1 shows the transition location and the properties of the SS mode wave that is the first to reach
 $N$
-factor values up to
 $N=10$
as shown in figure 17. As shown by Paredes et al. (Reference Paredes, Choudhari and Li2016c
), the most amplified frequency associated with the SS mode increases with the streak amplitude, which is in agreement with the increase in
 $N=5$
frequency from
 $\unicode[STIX]{x1D714}=0.0459$
at
 $A=2.0$
to
 $\unicode[STIX]{x1D714}=0.0548$
at
 $A=2.5$
.
Effect of streak amplitude parameters on the streamwise location,
 $R$
, where the selected
 $N$
-factors are reached and on the properties of the corresponding first-mode wave, namely, the disturbance frequency,
 $\unicode[STIX]{x1D714}$
, and spanwise wavelength,
 $\unicode[STIX]{x1D706}$
. Note that numbers in bold font refer to the destabilized antisymmetric subharmonic mode (
 $\unicode[STIX]{x1D706}=2\unicode[STIX]{x1D706}_{ST}$
).

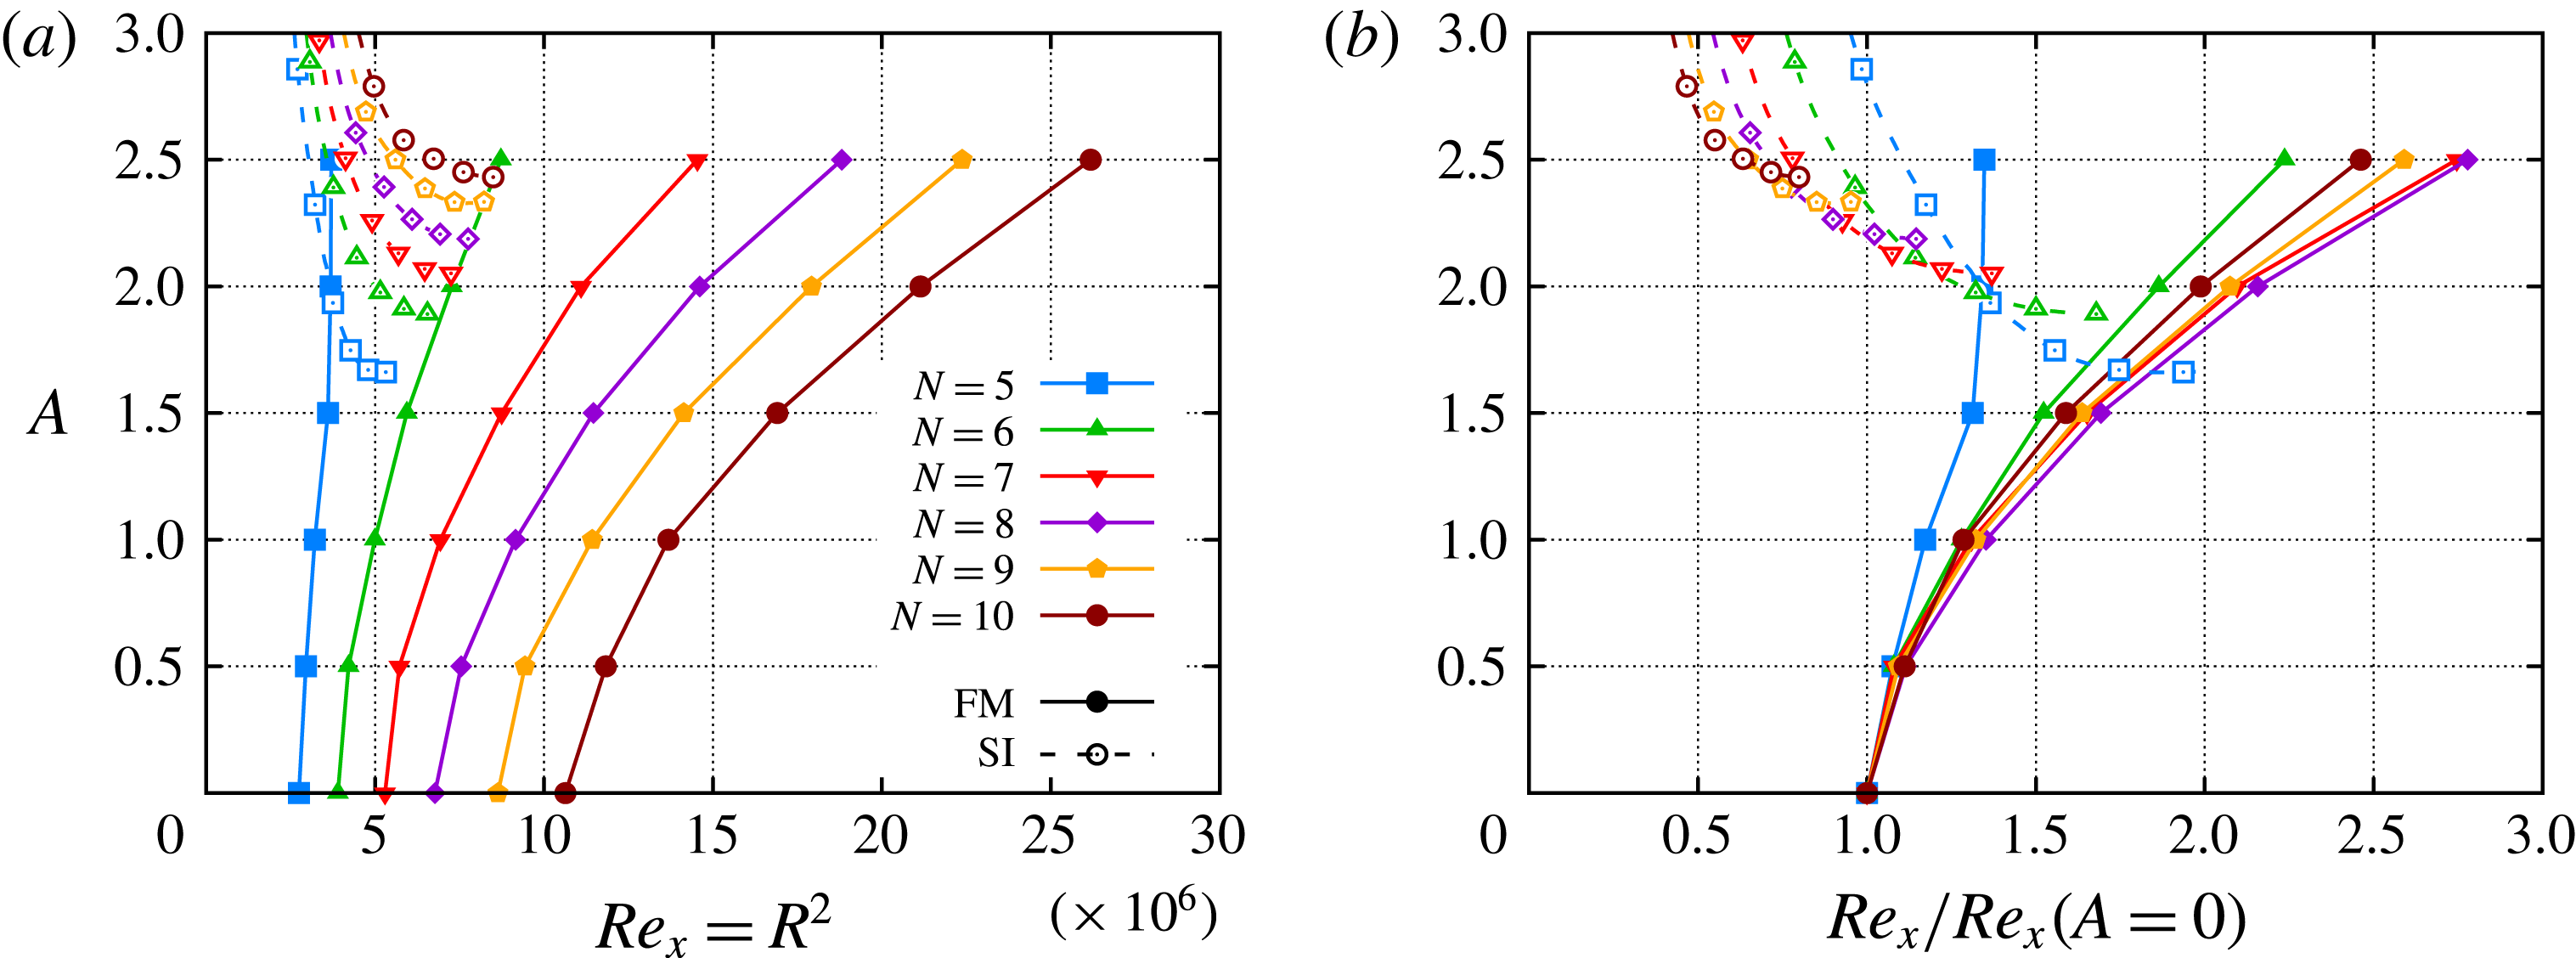
The overall effect of the streaks on the instability characteristics of the supersonic boundary-layer flow is summarized in figure 18(a), where the transition location corresponding to selected
 $N$
-factor values is plotted as a function of the computed streak amplitude parameters,
 $A$
. Figure 18(b) shows the same results but normalized with the unperturbed case to reflect the relative displacement of the transition location. Selecting
 $N=5$
as the transition threshold, figure 18(a) shows how the transition onset due to first-mode waves would be slightly displaced downstream by the introduction of the optimal streaks. However, for
 $A\geqslant 2$
, the SS mode reaches
 $N=5$
at a position upstream of the larger wavelength modes stabilized by the streaks; this leads to an upstream shift in transition location relative to the baseline (
 $A=0.0$
) case. For larger
 $N$
-factor values, the streaks yield a significant downstream movement of the transition onset location, as long as the streak amplitude is below a threshold value to avoid an early transition onset due to the SS mode. Figure 18(b) shows that for the present configuration, the streaks at any specified value of
 $A$
produce the maximum relative shift in transition location when
 $N=8$
. Nevertheless, the trend in transition location from figure 18(b) is quite similar for all
 $N\geqslant 6$
. Therefore, the interaction of the streaks with the first-mode instability waves results in a net stabilization of nearly planar waves, yielding a significant transition delay in quiet environments for which the onset of transition typically correlates with
 $N\approx 10$
.
The present results show a potential increase in the length of the laminar flow that is comparable to the length of the laminar region in the unperturbed case, i.e. the laminar flow acreage is potentially doubled. Considering that the ratio of local skin friction coefficients for turbulent and laminar flows is in the range of
 $c_{f,tur}/c_{f,lam}\in [3,5]$
for a flat-plate boundary layer with an edge Mach number of 3 (Schlichting Reference Schlichting1979), the total skin friction reduction for a flat plate with a total length corresponding to
 $Re_{l}=25\times 10^{6}$
, at the present flow conditions (
 $M=3$
,
 $Re^{\prime }=10^{6}~\text{m}^{-1}$
) and with a transition threshold of
 $N=10$
, would be of the order of the 50 %–70 % relative to the unperturbed case. A parameter study for additional streak wavenumbers and excitation locations, as well as suboptimal streak profiles that are more readily realizable via the available set of actuation techniques, would be very helpful with identifying the optimal flow control settings that would enable a robust performance with maximum transition delay for a given flow configuration.
Effect of streak amplitude parameter
 $A$
on transition location based on
 $N$
factor values
 $N=5{-}10$
. Note that solid lines with filled symbols refer to stabilized long wavelength modes (
 $\unicode[STIX]{x1D706}>2\unicode[STIX]{x1D706}_{ST}$
) and dashed lines with open symbols refer to destabilized antisymmetric subharmonic modes (
 $\unicode[STIX]{x1D706}=2\unicode[STIX]{x1D706}_{ST}$
).

4 Conclusions
Optimal growth theory based on parabolized stability equations is used to identify the range of modulating wavelengths that would benefit the most from the intrinsic ‘lift-up’ mechanism within the boundary-layer flow. Furthermore, the nonlinear plane-marching PSE are used to predict the downstream development of finite-amplitude, optimal, stationary disturbances introduced near the leading edge. Subsequently, the linear stability characteristics of the perturbed streaky boundary-layer flow are studied using the linear form of plane-marching PSE. Results show that stationary streaks lead to a substantial reduction in the amplification of targeted first-mode waves when the streak spacing is less than the spanwise scale of those waves by a factor of two or greater. Instability waves with spanwise wavelengths of twice the streak spacing or lower are destabilized by the streaks; but up to a certain threshold, their amplification factors are sufficiently lower than those of the most amplified waves in the uncontrolled flow so that a significant net stabilization is achieved, yielding a downstream movement of the laminar–turbulent transition onset that is comparable to the uncontrolled transition length. Considering that the wavelengths of the first-mode waves that are substantially amplified in an unperturbed boundary-layer flow are much longer than optimal growth streaks, a favourable situation for transition delay is feasible. For the conditions of the present Mach 3 flow configuration, the results can be summarized in terms of the boundary-layer thickness based on
 $\bar{u}=0.995$
at
 $R_{1}=1000$
,
 $\unicode[STIX]{x1D6FF}_{u,1}$
: the optimal streaks induced near the leading edge, which have a spanwise spacing of
 $\unicode[STIX]{x1D706}_{ST}=2.8\unicode[STIX]{x1D6FF}_{u,1}$
, stabilize first-mode waves with wavelength larger than twice the streak spacing,
 $\unicode[STIX]{x1D706}>5.6\unicode[STIX]{x1D6FF}_{u,1}$
, and destabilize first-mode waves with lower wavelengths,
 $\unicode[STIX]{x1D706}\leqslant 5.6\unicode[STIX]{x1D6FF}_{u,1}$
. Note that the first-mode waves with largest growth rate at
 $R_{1}=1000$
have
 $\unicode[STIX]{x1D706}\approx 9$
; as shown by Paredes et al. (Reference Paredes, Choudhari and Li2016c
). Note that the effect of the streaks on the first-mode waves is expected to be equivalent for other flow conditions, as higher total temperature and/or cooled wall.
Furthermore, a detailed analysis has shown that the MFD of the nonlinear stationary streak perturbation is responsible of the stabilizing effect, while the spanwise variations destabilize the first-mode waves. When the spanwise wavelength of the instability waves is equal to or smaller than twice the streak wavelength, the spanwise production terms dominate and yield the destabilization with respect to the unperturbed case. When the streak amplitude is large enough, the antisymmetric subharmonic mode, becomes the subharmonic, sinuous mode of streak instability (Paredes et al. Reference Paredes, Choudhari and Li2016c ), and because of its high amplification ratio, it can lead to the early onset of transition. When the spanwise wavelength of the first-mode waves is larger than twice the streak wavelength, the difference between both spanwise length scales reduce the destabilizing effect of the spanwise gradients and the streak effects on first-mode waves is dominated by the stabilizing effect of the MFD.
The results indicate that, if suitable stationary disturbances can be excited in the flow, then the net stabilization of first-mode instabilities due to the stationary streaks may lead to a notable delay in transition onset, provided that the
 $N$
-factor values correlating with transition onset remain similar in both cases. Detailed laboratory experiments are required to establish the effect of streaks, if any, on the
 $N$
-factor correlation. The physical source responsible for the excitation of transient growth disturbances has not been addressed in this study and, in turn, the effect of this source on the generation (i.e. receptivity) of the unsteady modal instabilities is also not addressed in the present study. A study of both of these aspects would represent an important extension of the present work.
Acknowledgements
This research was sponsored by the NASA Transformational Tools and Technologies (TTT) Project of the Transformative Aeronautics Concepts Program under the Aeronautics Research Mission Directorate. Resources supporting this work were provided by the NASA High-End Computing (HEC) Program through the NASA Advanced Supercomputing (NAS) Division at Ames Research Center.
Appendix A. Coefficients of plane-marching PSE
The operators of the nonlinear plane-marching PSE of (2.2), namely,
 $\unicode[STIX]{x1D647}_{n}$
,
 $\unicode[STIX]{x1D648}_{n}$
and the vector
 $\boldsymbol{F}$
, can be expressed as follows (index
 $n$
is suppressed for simplification),
 $$\begin{eqnarray}\displaystyle \left.\begin{array}{@{}c@{}}\unicode[STIX]{x1D647}=\left(\begin{array}{@{}ccccc@{}}\unicode[STIX]{x1D613}_{11} & \unicode[STIX]{x1D613}_{12} & \unicode[STIX]{x1D613}_{13} & \unicode[STIX]{x1D613}_{14} & 0\\ \unicode[STIX]{x1D613}_{21} & \unicode[STIX]{x1D613}_{22} & \unicode[STIX]{x1D613}_{23} & \unicode[STIX]{x1D613}_{24} & \unicode[STIX]{x1D613}_{25}\\ \unicode[STIX]{x1D613}_{31} & \unicode[STIX]{x1D613}_{32} & \unicode[STIX]{x1D613}_{33} & \unicode[STIX]{x1D613}_{34} & \unicode[STIX]{x1D613}_{35}\\ \unicode[STIX]{x1D613}_{41} & \unicode[STIX]{x1D613}_{42} & \unicode[STIX]{x1D613}_{43} & \unicode[STIX]{x1D613}_{44} & \unicode[STIX]{x1D613}_{45}\\ \unicode[STIX]{x1D613}_{51} & \unicode[STIX]{x1D613}_{52} & \unicode[STIX]{x1D613}_{53} & \unicode[STIX]{x1D613}_{54} & \unicode[STIX]{x1D613}_{55}\end{array}\right),\\ \unicode[STIX]{x1D648}=\left(\begin{array}{@{}ccccc@{}}\unicode[STIX]{x1D614}_{11} & \unicode[STIX]{x1D614}_{12} & 0 & 0 & 0\\ \unicode[STIX]{x1D614}_{21} & \unicode[STIX]{x1D614}_{22} & 0 & 0 & \unicode[STIX]{x1D614}_{25}\\ 0 & 0 & \unicode[STIX]{x1D614}_{33} & 0 & 0\\ 0 & 0 & 0 & \unicode[STIX]{x1D614}_{44} & 0\\ \unicode[STIX]{x1D614}_{51} & 0 & 0 & 0 & \unicode[STIX]{x1D614}_{55}\end{array}\right),\\ \boldsymbol{F}=\left(\begin{array}{@{}c@{}}F_{1}\\ F_{2}\\ F_{3}\\ F_{4}\\ F_{5}\end{array}\right).\end{array}\right\} & & \displaystyle\end{eqnarray}$$
The full listing of the operators in (A 1) are defined as
 $$\begin{eqnarray}\displaystyle & \unicode[STIX]{x1D613}_{11}=\bar{v}{\mathcal{D}}_{y}+\bar{w}{\mathcal{D}}_{z}+\bar{u}_{x}+\bar{v}_{y}+\bar{w}_{z}+\bar{u}\text{i}\unicode[STIX]{x1D6FC}-\text{i}\unicode[STIX]{x1D714}, & \displaystyle\end{eqnarray}$$
 $$\begin{eqnarray}\displaystyle & \unicode[STIX]{x1D613}_{12}=\bar{\unicode[STIX]{x1D70C}}\text{i}\unicode[STIX]{x1D6FC}+\bar{\unicode[STIX]{x1D70C}}_{x}, & \displaystyle\end{eqnarray}$$
 $$\begin{eqnarray}\displaystyle & \unicode[STIX]{x1D613}_{13}=\bar{\unicode[STIX]{x1D70C}}{\mathcal{D}}_{y}+\bar{\unicode[STIX]{x1D70C}}_{y}, & \displaystyle\end{eqnarray}$$
 $$\begin{eqnarray}\displaystyle & \unicode[STIX]{x1D613}_{14}=\bar{\unicode[STIX]{x1D70C}}{\mathcal{D}}_{z}+\bar{\unicode[STIX]{x1D70C}}_{z}, & \displaystyle\end{eqnarray}$$
 $$\begin{eqnarray}\displaystyle & \displaystyle \unicode[STIX]{x1D613}_{21}=\bar{u}\bar{u}_{x}+\bar{v}\bar{u}_{y}+\bar{w}\bar{u}_{z}+\frac{1}{\unicode[STIX]{x1D6FE}M^{2}}(\bar{T}\text{i}\unicode[STIX]{x1D6FC}+\bar{T}_{x}), & \displaystyle\end{eqnarray}$$
 $$\begin{eqnarray}\displaystyle \unicode[STIX]{x1D613}_{22} & = & \displaystyle -\frac{\bar{\unicode[STIX]{x1D707}}}{Re}({\mathcal{D}}_{yy}^{2}+{\mathcal{D}}_{zz}^{2})+\left(\bar{\unicode[STIX]{x1D70C}}\bar{v}-\frac{\bar{\unicode[STIX]{x1D707}}_{y}}{Re}\right){\mathcal{D}}_{y}+\left(\bar{\unicode[STIX]{x1D70C}}\bar{w}-\frac{\bar{\unicode[STIX]{x1D707}}_{z}}{Re}\right){\mathcal{D}}_{z}\nonumber\\ \displaystyle & & \displaystyle +\,\bar{\unicode[STIX]{x1D70C}}(\bar{u}\text{i}\unicode[STIX]{x1D6FC}+\bar{u}_{x}-\text{i}\unicode[STIX]{x1D714})+\frac{4}{3}\frac{\bar{\unicode[STIX]{x1D707}}}{Re}\unicode[STIX]{x1D6FC}^{2},\end{eqnarray}$$
 $$\begin{eqnarray}\displaystyle & \displaystyle \unicode[STIX]{x1D613}_{23}=-\frac{\bar{\unicode[STIX]{x1D707}}}{3\,Re}\text{i}\unicode[STIX]{x1D6FC}{\mathcal{D}}_{y}+\bar{\unicode[STIX]{x1D70C}}\bar{u}_{y}-\frac{\bar{\unicode[STIX]{x1D707}}_{y}}{Re}\text{i}\unicode[STIX]{x1D6FC}, & \displaystyle\end{eqnarray}$$
 $$\begin{eqnarray}\displaystyle & \displaystyle \unicode[STIX]{x1D613}_{24}=-\frac{\bar{\unicode[STIX]{x1D707}}}{3\,Re}\text{i}\unicode[STIX]{x1D6FC}{\mathcal{D}}_{z}+\bar{\unicode[STIX]{x1D70C}}\bar{u}_{z}-\frac{\bar{\unicode[STIX]{x1D707}}_{z}}{Re}\text{i}\unicode[STIX]{x1D6FC}, & \displaystyle\end{eqnarray}$$
 $$\begin{eqnarray}\displaystyle \unicode[STIX]{x1D613}_{25} & = & \displaystyle -\frac{\bar{\unicode[STIX]{x1D707}}^{\prime }}{Re}(\bar{u}_{y}{\mathcal{D}}_{y}+\bar{u}_{z}{\mathcal{D}}_{z})+\frac{1}{\unicode[STIX]{x1D6FE}M^{2}}(\bar{\unicode[STIX]{x1D70C}}\text{i}\unicode[STIX]{x1D6FC}+\bar{\unicode[STIX]{x1D70C}}_{x})\nonumber\\ \displaystyle & & \displaystyle -\,\frac{\bar{\unicode[STIX]{x1D707}}^{\prime }}{Re}\left[\bar{u}_{yy}+\bar{u}_{zz}-\frac{2}{3}(\bar{v}_{y}+\bar{w}_{z})\text{i}\unicode[STIX]{x1D6FC}\right]-\frac{\bar{\unicode[STIX]{x1D707}}^{\prime \prime }}{Re}(\bar{u}_{y}\bar{T}_{y}+\bar{u}_{z}\bar{T}_{z}),\end{eqnarray}$$
 $$\begin{eqnarray}\displaystyle & \displaystyle \unicode[STIX]{x1D613}_{31}=\frac{\bar{T}}{\unicode[STIX]{x1D6FE}M^{2}}{\mathcal{D}}_{y}+\bar{u}\bar{v}_{x}+\bar{v}\bar{v}_{y}+\bar{w}\bar{v}_{z}+\frac{1}{\unicode[STIX]{x1D6FE}M^{2}}\bar{T}_{y}, & \displaystyle\end{eqnarray}$$
 $$\begin{eqnarray}\displaystyle & \displaystyle \unicode[STIX]{x1D613}_{32}=-\frac{\bar{\unicode[STIX]{x1D707}}}{3\,Re}\text{i}\unicode[STIX]{x1D6FC}{\mathcal{D}}_{y}+\bar{\unicode[STIX]{x1D70C}}\bar{v}_{x}+\frac{2\,\bar{\unicode[STIX]{x1D707}}_{y}}{3\,Re}\text{i}\unicode[STIX]{x1D6FC}, & \displaystyle\end{eqnarray}$$
 $$\begin{eqnarray}\displaystyle \unicode[STIX]{x1D613}_{33} & = & \displaystyle -\frac{\bar{\unicode[STIX]{x1D707}}}{Re}\left(\frac{4}{3}{\mathcal{D}}_{yy}^{2}+{\mathcal{D}}_{zz}^{2}\right)+\left(\bar{\unicode[STIX]{x1D70C}}\bar{v}-\frac{4\,\bar{\unicode[STIX]{x1D707}}_{y}}{3\,Re}\right){\mathcal{D}}_{y}+\left(\bar{\unicode[STIX]{x1D70C}}\bar{w}-\frac{\bar{\unicode[STIX]{x1D707}}_{z}}{Re}\right){\mathcal{D}}_{z}\nonumber\\ \displaystyle & & \displaystyle +\,\bar{\unicode[STIX]{x1D70C}}(\bar{u}\text{i}\unicode[STIX]{x1D6FC}+\bar{v}_{y}-\text{i}\unicode[STIX]{x1D714})+\frac{\bar{\unicode[STIX]{x1D707}}}{Re}\unicode[STIX]{x1D6FC}^{2},\end{eqnarray}$$
 $$\begin{eqnarray}\displaystyle \unicode[STIX]{x1D613}_{34}=-\frac{\bar{\unicode[STIX]{x1D707}}}{3\,Re}{\mathcal{D}}_{yz}^{2}-\frac{\bar{\unicode[STIX]{x1D707}}_{z}}{Re}{\mathcal{D}}_{y}+\frac{2\,\bar{\unicode[STIX]{x1D707}}_{y}}{3\,Re}{\mathcal{D}}_{z}+\bar{\unicode[STIX]{x1D70C}}\bar{v}_{z}, & & \displaystyle\end{eqnarray}$$
 $$\begin{eqnarray}\displaystyle \unicode[STIX]{x1D613}_{35} & = & \displaystyle \left[\frac{\bar{\unicode[STIX]{x1D70C}}}{\unicode[STIX]{x1D6FE}M^{2}}-\frac{\bar{\unicode[STIX]{x1D707}}^{\prime }}{Re}\frac{2}{3}(2\bar{v}_{y}-\bar{w}_{z})\right]{\mathcal{D}}_{y}-\frac{\bar{\unicode[STIX]{x1D707}}^{\prime }}{Re}(\bar{v}_{z}+\bar{w}_{y}){\mathcal{D}}_{z}+\frac{\bar{\unicode[STIX]{x1D70C}}_{y}}{\unicode[STIX]{x1D6FE}M^{2}}\nonumber\\ \displaystyle & & \displaystyle -\,\frac{\bar{\unicode[STIX]{x1D707}}^{\prime \prime }}{Re}\left[\frac{2}{3}(2\bar{v}_{y}-\bar{w}_{z})\bar{T}_{y}+(\bar{v}_{z}+\bar{w}_{y})\bar{T}_{z}\right]\nonumber\\ \displaystyle & & \displaystyle -\,\frac{\bar{\unicode[STIX]{x1D707}}^{\prime }}{Re}\left(\frac{4}{3}\bar{v}_{yy}+\bar{v}_{zz}+\frac{1}{3}\bar{w}_{yz}+\bar{u}_{y}\text{i}\unicode[STIX]{x1D6FC}\right),\end{eqnarray}$$
 $$\begin{eqnarray}\displaystyle & \displaystyle \unicode[STIX]{x1D613}_{41}=\frac{\bar{T}}{\unicode[STIX]{x1D6FE}M^{2}}{\mathcal{D}}_{z}+\bar{u}\bar{w}_{x}+\bar{v}\bar{w}_{y}+\bar{w}\bar{w}_{z}+\frac{1}{\unicode[STIX]{x1D6FE}M^{2}}\bar{T}_{z}, & \displaystyle\end{eqnarray}$$
 $$\begin{eqnarray}\displaystyle & \displaystyle \unicode[STIX]{x1D613}_{42}=-\frac{\bar{\unicode[STIX]{x1D707}}}{3\,Re}\text{i}\unicode[STIX]{x1D6FC}{\mathcal{D}}_{z}+\bar{\unicode[STIX]{x1D70C}}\bar{w}_{x}+\frac{2\,\bar{\unicode[STIX]{x1D707}}_{z}}{3\,Re}\text{i}\unicode[STIX]{x1D6FC}, & \displaystyle\end{eqnarray}$$
 $$\begin{eqnarray}\displaystyle & \displaystyle \unicode[STIX]{x1D613}_{43}=-\frac{\bar{\unicode[STIX]{x1D707}}}{3\,Re}{\mathcal{D}}_{yz}^{2}+\frac{2\,\bar{\unicode[STIX]{x1D707}}_{z}}{3\,Re}{\mathcal{D}}_{y}-\frac{\bar{\unicode[STIX]{x1D707}}_{y}}{Re}{\mathcal{D}}_{z}+\bar{\unicode[STIX]{x1D70C}}\bar{w}_{y}, & \displaystyle\end{eqnarray}$$
 $$\begin{eqnarray}\displaystyle \unicode[STIX]{x1D613}_{44} & = & \displaystyle -\frac{\bar{\unicode[STIX]{x1D707}}}{Re}\left({\mathcal{D}}_{yy}^{2}+\frac{4}{3}{\mathcal{D}}_{zz}^{2}\right)+\left(\bar{\unicode[STIX]{x1D70C}}\bar{v}-\frac{\bar{\unicode[STIX]{x1D707}}_{y}}{Re}\right){\mathcal{D}}_{y}+\left(\bar{\unicode[STIX]{x1D70C}}\bar{w}-\frac{4\,\bar{\unicode[STIX]{x1D707}}_{z}}{3\,Re}\right){\mathcal{D}}_{z}\nonumber\\ \displaystyle & & \displaystyle +\,\bar{\unicode[STIX]{x1D70C}}(\bar{u}\text{i}\unicode[STIX]{x1D6FC}+\bar{w}_{z}-\text{i}\unicode[STIX]{x1D714})+\frac{\bar{\unicode[STIX]{x1D707}}}{Re}\unicode[STIX]{x1D6FC}^{2},\end{eqnarray}$$
 $$\begin{eqnarray}\displaystyle \unicode[STIX]{x1D613}_{45} & = & \displaystyle -\frac{\bar{\unicode[STIX]{x1D707}}^{\prime }}{Re}(\bar{w}_{y}+\bar{v}_{z}){\mathcal{D}}_{y}+\left[\frac{\bar{\unicode[STIX]{x1D70C}}}{\unicode[STIX]{x1D6FE}M^{2}}-\frac{\bar{\unicode[STIX]{x1D707}}^{\prime }}{Re}\frac{2}{3}(2\bar{w}_{z}-\bar{v}_{y})\right]{\mathcal{D}}_{z}+\frac{\bar{\unicode[STIX]{x1D70C}}_{z}}{\unicode[STIX]{x1D6FE}M^{2}}\nonumber\\ \displaystyle & & \displaystyle -\,\frac{\bar{\unicode[STIX]{x1D707}}^{\prime \prime }}{Re}\left[(\bar{w}_{y}+\bar{v}_{z})\bar{T}_{y}+\frac{2}{3}(2\bar{w}_{z}-\bar{v}_{y})\bar{T}_{z}\right]\nonumber\\ \displaystyle & & \displaystyle -\,\frac{\bar{\unicode[STIX]{x1D707}}^{\prime }}{Re}\left(\frac{4}{3}\bar{w}_{zz}+\bar{w}_{yy}+\frac{1}{3}\bar{v}_{yz}+\bar{u}_{z}\text{i}\unicode[STIX]{x1D6FC}\right),\end{eqnarray}$$
 $$\begin{eqnarray}\displaystyle & \unicode[STIX]{x1D613}_{51}=-(\unicode[STIX]{x1D6FE}-1)\bar{T}(\bar{v}{\mathcal{D}}_{y}+\bar{w}{\mathcal{D}}_{z}+\bar{u}\text{i}\unicode[STIX]{x1D6FC}-\text{i}\unicode[STIX]{x1D714})+(\bar{T}_{x}\bar{u}+\bar{T}_{y}\bar{v}+\bar{T}_{z}\bar{w}), & \displaystyle\end{eqnarray}$$
 $$\begin{eqnarray}\displaystyle \unicode[STIX]{x1D613}_{52} & = & \displaystyle -\frac{2\unicode[STIX]{x1D6FE}(\unicode[STIX]{x1D6FE}-1)M^{2}\bar{\unicode[STIX]{x1D707}}}{Re}\left[\bar{u}_{y}{\mathcal{D}}_{y}+\bar{u}_{z}{\mathcal{D}}_{z}-\frac{2}{3}(\bar{v}_{y}+\bar{w}_{z})\text{i}\unicode[STIX]{x1D6FC}\right]\nonumber\\ \displaystyle & & \displaystyle -\,(\unicode[STIX]{x1D6FE}-1)\bar{T}\bar{\unicode[STIX]{x1D70C}}_{x}+\bar{\unicode[STIX]{x1D70C}}\bar{T}_{x},\end{eqnarray}$$
 $$\begin{eqnarray}\displaystyle \unicode[STIX]{x1D613}_{53} & = & \displaystyle -\frac{2\unicode[STIX]{x1D6FE}(\unicode[STIX]{x1D6FE}-1)M^{2}\bar{\unicode[STIX]{x1D707}}}{Re}\left[\frac{2}{3}(2\bar{v}_{y}-\bar{w}_{z}){\mathcal{D}}_{y}+(\bar{v}_{z}+\bar{w}_{y}){\mathcal{D}}_{z}+\bar{u}_{y}\text{i}\unicode[STIX]{x1D6FC}\right]\nonumber\\ \displaystyle & & \displaystyle -\,(\unicode[STIX]{x1D6FE}-1)\bar{T}\bar{\unicode[STIX]{x1D70C}}_{y}+\bar{\unicode[STIX]{x1D70C}}\bar{T}_{y},\end{eqnarray}$$
 $$\begin{eqnarray}\displaystyle \unicode[STIX]{x1D613}_{54} & = & \displaystyle -\frac{2\unicode[STIX]{x1D6FE}(\unicode[STIX]{x1D6FE}-1)M^{2}\bar{\unicode[STIX]{x1D707}}}{Re}\left[(\bar{v}_{z}+\bar{w}_{y}){\mathcal{D}}_{y}+\frac{2}{3}(2\bar{w}_{z}-\bar{v}_{y}){\mathcal{D}}_{z}+\bar{u}_{z}\text{i}\unicode[STIX]{x1D6FC}\right]\nonumber\\ \displaystyle & & \displaystyle -\,(\unicode[STIX]{x1D6FE}-1)\bar{T}\bar{\unicode[STIX]{x1D70C}}_{z}+\bar{\unicode[STIX]{x1D70C}}\bar{T}_{z},\end{eqnarray}$$
 $$\begin{eqnarray}\displaystyle \unicode[STIX]{x1D613}_{55} & = & \displaystyle -\frac{\unicode[STIX]{x1D6FE}}{RePr}\bar{\unicode[STIX]{x1D705}}({\mathcal{D}}_{yy}^{2}+{\mathcal{D}}_{zz}^{2})+\left(\bar{\unicode[STIX]{x1D70C}}\bar{v}-\frac{\unicode[STIX]{x1D6FE}}{RePr}2\bar{\unicode[STIX]{x1D705}}^{\prime }\bar{T}_{y}\right){\mathcal{D}}_{y}\nonumber\\ \displaystyle & & \displaystyle +\,\left(\bar{\unicode[STIX]{x1D70C}}\bar{w}-\frac{\unicode[STIX]{x1D6FE}}{RePr}2\bar{\unicode[STIX]{x1D705}}^{\prime }\bar{T}_{z}\right){\mathcal{D}}_{z}-(\unicode[STIX]{x1D6FE}-1)(\bar{\unicode[STIX]{x1D70C}}_{x}\bar{u}+\bar{\unicode[STIX]{x1D70C}}_{y}\bar{v}+\bar{\unicode[STIX]{x1D70C}}_{z}\bar{w})\nonumber\\ \displaystyle & & \displaystyle +\,\bar{\unicode[STIX]{x1D70C}}(\bar{u}\text{i}\unicode[STIX]{x1D6FC}-\text{i}\unicode[STIX]{x1D714})-\frac{\unicode[STIX]{x1D6FE}}{RePr}[-\bar{\unicode[STIX]{x1D705}}\unicode[STIX]{x1D6FC}^{2}+\bar{\unicode[STIX]{x1D705}}^{\prime }(\bar{T}_{yy}+\bar{T}_{zz})+\bar{\unicode[STIX]{x1D705}}^{\prime \prime }(\bar{T}_{y}^{2}+\bar{T}_{z}^{2})]\nonumber\\ \displaystyle & & \displaystyle -\,\frac{\unicode[STIX]{x1D6FE}(\unicode[STIX]{x1D6FE}-1)M^{2}\bar{\unicode[STIX]{x1D707}}^{\prime }}{Re}\left[\frac{4}{3}(\bar{v}_{y}^{2}+\bar{w}_{z}^{2}-\bar{v}_{y}\bar{w}_{z})+\bar{u}_{y}^{2}+\bar{u}_{z}^{2}+\bar{v}_{z}^{2}+\bar{w}_{y}^{2}+2\bar{v}_{z}\bar{w}_{y}\right],\end{eqnarray}$$
 $$\begin{eqnarray}\displaystyle & \unicode[STIX]{x1D614}_{11}=\bar{u}, & \displaystyle\end{eqnarray}$$
 $$\begin{eqnarray}\displaystyle & \unicode[STIX]{x1D614}_{12}=\bar{\unicode[STIX]{x1D70C}}, & \displaystyle\end{eqnarray}$$
 $$\begin{eqnarray}\displaystyle & \displaystyle \unicode[STIX]{x1D614}_{21}=\frac{1}{\unicode[STIX]{x1D6FE}M^{2}}\bar{T}, & \displaystyle\end{eqnarray}$$
 $$\begin{eqnarray}\displaystyle & \unicode[STIX]{x1D614}_{22}=\bar{\unicode[STIX]{x1D70C}}\bar{u}, & \displaystyle\end{eqnarray}$$
 $$\begin{eqnarray}\displaystyle & \displaystyle \unicode[STIX]{x1D614}_{25}=\frac{\bar{\unicode[STIX]{x1D70C}}}{\unicode[STIX]{x1D6FE}M^{2}}, & \displaystyle\end{eqnarray}$$
 $$\begin{eqnarray}\displaystyle & \unicode[STIX]{x1D614}_{33}=\bar{\unicode[STIX]{x1D70C}}\bar{u}, & \displaystyle\end{eqnarray}$$
 $$\begin{eqnarray}\displaystyle & \unicode[STIX]{x1D614}_{44}=\bar{\unicode[STIX]{x1D70C}}\bar{u}, & \displaystyle\end{eqnarray}$$
 $$\begin{eqnarray}\displaystyle & \unicode[STIX]{x1D614}_{51}=-(\unicode[STIX]{x1D6FE}-1)\bar{T}\bar{u}, & \displaystyle\end{eqnarray}$$
 $$\begin{eqnarray}\displaystyle & \unicode[STIX]{x1D614}_{55}=\bar{\unicode[STIX]{x1D70C}}\bar{u}, & \displaystyle\end{eqnarray}$$
 $$\begin{eqnarray}\displaystyle F_{1}=-\tilde{\unicode[STIX]{x1D70C}}_{x}\tilde{u} -\tilde{\unicode[STIX]{x1D70C}}\tilde{u} _{x}-\tilde{\unicode[STIX]{x1D70C}}_{y}\tilde{v}-\tilde{\unicode[STIX]{x1D70C}}\tilde{v}_{y}-\tilde{\unicode[STIX]{x1D70C}}_{z}\tilde{w}-\tilde{\unicode[STIX]{x1D70C}}\tilde{w}_{z}, & & \displaystyle\end{eqnarray}$$
 $$\begin{eqnarray}\displaystyle F_{2} & = & \displaystyle -\tilde{\unicode[STIX]{x1D70C}}\frac{\unicode[STIX]{x2202}\tilde{u} }{\unicode[STIX]{x2202}t}-\bar{\unicode[STIX]{x1D70C}}(\tilde{u} \tilde{u} _{x}+\tilde{v}\tilde{u} _{y}+\tilde{w}\tilde{u} _{z})\nonumber\\ \displaystyle & & \displaystyle -\,\tilde{\unicode[STIX]{x1D70C}}(\bar{u}\tilde{u} _{x}+\bar{v}\tilde{u} _{y}+\bar{w}\tilde{u} _{z}+\tilde{u} \bar{u}_{x}+\tilde{v}\bar{u}_{y}+\tilde{w}\bar{u}_{z})-\frac{1}{\unicode[STIX]{x1D6FE}M^{2}}(\tilde{T}\tilde{\unicode[STIX]{x1D70C}}_{x}+\tilde{\unicode[STIX]{x1D70C}}\tilde{T}_{x})\nonumber\\ \displaystyle & & \displaystyle +\,\frac{\bar{\unicode[STIX]{x1D707}}^{\prime }}{Re}\left[\tilde{T}(\tilde{u} _{xx}+\tilde{u} _{yy}+\tilde{u} _{zz})+\frac{\tilde{T}}{3}(\tilde{u} _{xx}+\tilde{v}_{xy}+\tilde{w}_{xz})\right.\nonumber\\ \displaystyle & & \displaystyle +\,\left.\frac{2\,\tilde{T}_{x}}{3}(2\tilde{u} _{x}-\tilde{v}_{y}-\tilde{w}_{z})+\tilde{T}_{y}(\tilde{u} _{y}+\tilde{v}_{x})+\tilde{T}_{z}(\tilde{u} _{z}+\tilde{w}_{x})\right]\nonumber\\ \displaystyle & & \displaystyle +\,\frac{\bar{\unicode[STIX]{x1D707}}^{\prime \prime }\tilde{T}}{Re}\left[\frac{2\,\bar{T}_{x}}{3}(2\tilde{u} _{x}-\tilde{v}_{y}-\tilde{w}_{z})+\bar{T}_{y}(\tilde{u} _{y}+\tilde{v}_{x})+\bar{T}_{z}(\tilde{u} _{z}+\tilde{w}_{x})\right],\end{eqnarray}$$
 $$\begin{eqnarray}\displaystyle F_{3} & = & \displaystyle -\tilde{\unicode[STIX]{x1D70C}}\frac{\unicode[STIX]{x2202}\tilde{v}}{\unicode[STIX]{x2202}t}-\bar{\unicode[STIX]{x1D70C}}(\tilde{u} \tilde{v}_{x}+\tilde{v}\tilde{v}_{y}+\tilde{w}\tilde{v}_{z})\nonumber\\ \displaystyle & & \displaystyle -\,\tilde{\unicode[STIX]{x1D70C}}(\bar{u}\tilde{v}_{x}+\bar{v}\tilde{v}_{y}+\bar{w}\tilde{v}_{z}+\tilde{u} \bar{v}_{x}+\tilde{v}\bar{v}_{y}+\tilde{w}\bar{v}_{z})-\frac{1}{\unicode[STIX]{x1D6FE}M^{2}}(\tilde{T}\tilde{\unicode[STIX]{x1D70C}}_{y}+\tilde{\unicode[STIX]{x1D70C}}\tilde{T}_{y})\nonumber\\ \displaystyle & & \displaystyle +\,\frac{\bar{\unicode[STIX]{x1D707}}^{\prime }}{Re}\left[\tilde{T}(\tilde{v}_{xx}+\tilde{v}_{yy}+\tilde{v}_{zz})+\frac{\tilde{T}}{3}(\tilde{u} _{xy}+\tilde{v}_{yy}+\tilde{w}_{yz})\right.\nonumber\\ \displaystyle & & \displaystyle +\,\left.\tilde{T}_{x}(\tilde{v}_{x}+\tilde{u} _{y})+\frac{2\,\tilde{T}_{y}}{3}(2\tilde{v}_{y}-\tilde{u} _{x}-\tilde{w}_{z})+\tilde{T}_{z}(\tilde{v}_{z}+\tilde{w}_{y})\right]\nonumber\\ \displaystyle & & \displaystyle +\,\frac{\bar{\unicode[STIX]{x1D707}}^{\prime \prime }\tilde{T}}{Re}\left[\bar{T}_{x}(\tilde{v}_{x}+\tilde{u} _{y})+\frac{2\,\bar{T}_{y}}{3}(2\tilde{v}_{y}-\tilde{u} _{x}-\tilde{w}_{z})+\bar{T}_{z}(\tilde{v}_{z}+\tilde{w}_{y})\right],\end{eqnarray}$$
 $$\begin{eqnarray}\displaystyle F_{4} & = & \displaystyle -\tilde{\unicode[STIX]{x1D70C}}\frac{\unicode[STIX]{x2202}\tilde{w}}{\unicode[STIX]{x2202}t}-\bar{\unicode[STIX]{x1D70C}}(\tilde{u} \tilde{w}_{x}+\tilde{v}\tilde{w}_{y}+\tilde{w}\tilde{w}_{z})\nonumber\\ \displaystyle & & \displaystyle -\,\tilde{\unicode[STIX]{x1D70C}}(\bar{u}\tilde{w}_{x}+\bar{v}\tilde{w}_{y}+\bar{w}\tilde{w}_{z}+\tilde{u} \bar{w}_{x}+\tilde{v}\bar{w}_{y}+\tilde{w}\bar{w}_{z})-\frac{1}{\unicode[STIX]{x1D6FE}M^{2}}(\tilde{T}\tilde{\unicode[STIX]{x1D70C}}_{z}+\tilde{\unicode[STIX]{x1D70C}}\tilde{T}_{z})\nonumber\\ \displaystyle & & \displaystyle +\,\frac{\bar{\unicode[STIX]{x1D707}}^{\prime }}{Re}\left[\tilde{T}(\tilde{w}_{xx}+\tilde{w}_{yy}+\tilde{w}_{zz})+\frac{\tilde{T}}{3}(\tilde{u} _{xz}+\tilde{v}_{yz}+\tilde{w}_{zz})\right.\nonumber\\ \displaystyle & & \displaystyle \left.+\,\tilde{T}_{x}(\tilde{w}_{x}+\tilde{u} _{z})+\tilde{T}_{y}(\tilde{v}_{z}+\tilde{w}_{y})+\frac{2\,\tilde{T}_{z}}{3}(2\tilde{w}_{z}-\tilde{u} _{x}-\tilde{v}_{y})\right]\nonumber\\ \displaystyle & & \displaystyle +\,\frac{\bar{\unicode[STIX]{x1D707}}^{\prime \prime }\tilde{T}}{Re}\left[\bar{T}_{x}(\tilde{w}_{x}+\tilde{u} _{z})+\bar{T}_{y}(\tilde{v}_{z}+\tilde{w}_{y})+\frac{2\,\bar{T}_{z}}{3}(2\tilde{w}_{z}-\tilde{u} _{x}-\tilde{v}_{y})\right],\end{eqnarray}$$
 $$\begin{eqnarray}\displaystyle F_{5} & = & \displaystyle -\tilde{\unicode[STIX]{x1D70C}}\frac{\unicode[STIX]{x2202}\tilde{T}}{\unicode[STIX]{x2202}t}-\bar{\unicode[STIX]{x1D70C}}(\tilde{u} \tilde{T}_{x}+\tilde{v}\tilde{T}_{y}+\tilde{w}\tilde{T}_{z})\nonumber\\ \displaystyle & & \displaystyle -\,\tilde{\unicode[STIX]{x1D70C}}(\bar{u}\tilde{T}_{x}+\bar{v}\tilde{T}_{y}+\bar{w}\tilde{T}_{z}+\tilde{u} \bar{T}_{x}+\tilde{v}\bar{T}_{y}+\tilde{w}\bar{T}_{z})\nonumber\\ \displaystyle & & \displaystyle +\,(\unicode[STIX]{x1D6FE}-1)\tilde{T}\frac{\unicode[STIX]{x2202}\tilde{\unicode[STIX]{x1D70C}}}{\unicode[STIX]{x2202}t}+(\unicode[STIX]{x1D6FE}-1)\bar{T}(\tilde{u} \tilde{\unicode[STIX]{x1D70C}}_{x}+\tilde{v}\tilde{\unicode[STIX]{x1D70C}}_{y}+\tilde{w}\tilde{\unicode[STIX]{x1D70C}}_{z})\nonumber\\ \displaystyle & & \displaystyle +\,(\unicode[STIX]{x1D6FE}-1)\tilde{T}\left(\bar{u}\tilde{\unicode[STIX]{x1D70C}}_{x}+\bar{v}\tilde{\unicode[STIX]{x1D70C}}_{y}+\bar{w}\tilde{\unicode[STIX]{x1D70C}}_{z}+\tilde{u} \bar{\unicode[STIX]{x1D70C}}_{x}+\tilde{v}\bar{\unicode[STIX]{x1D70C}}_{y}+\tilde{w}\bar{\unicode[STIX]{x1D70C}}_{z}\right)\nonumber\\ \displaystyle & & \displaystyle +\,\frac{\unicode[STIX]{x1D6FE}}{Re\,Pr}\left[\bar{\unicode[STIX]{x1D705}}^{\prime }\tilde{T}(\tilde{T}_{xx}+\tilde{T}_{yy}+\tilde{T}_{zz})+\bar{\unicode[STIX]{x1D705}}^{\prime }(\tilde{T}_{x}^{2}+\tilde{T}_{y}^{2}+\tilde{T}_{z}^{2})\right.\nonumber\\ \displaystyle & & \displaystyle +\,\left.\bar{\unicode[STIX]{x1D705}}^{\prime \prime }\tilde{T}(\bar{T}_{x}\tilde{T}_{x}+\bar{T}_{y}\tilde{T}_{y}+\bar{T}_{z}\bar{T}_{z})\right]\nonumber\\ \displaystyle & & \displaystyle +\,\frac{\unicode[STIX]{x1D6FE}(\unicode[STIX]{x1D6FE}-1)M^{2}\bar{\unicode[STIX]{x1D707}}^{\prime }\tilde{T}}{Re}\left[\frac{2}{3}(2\bar{u}_{x}-\bar{v}_{y}-\bar{w}_{z})\tilde{u} _{x}+(\bar{u}_{y}+\bar{v}_{x})\tilde{u} _{y}\right.\nonumber\\ \displaystyle & & \displaystyle +\,(\bar{u}_{z}+\bar{w}_{x})\tilde{u} _{z}+(\bar{u}_{y}+\bar{v}_{x})\tilde{v}_{x}+\frac{2}{3}(2\bar{v}_{y}-\bar{u}_{x}-\bar{w}_{z})\tilde{v}_{y}+(\bar{w}_{y}+\bar{v}_{z})\tilde{v}_{z}\nonumber\\ \displaystyle & & \displaystyle +\,(\bar{w}_{x}+\bar{u}_{z})\tilde{w}_{x}+(\bar{w}_{y}+\bar{v}_{z})\tilde{w}_{y}+\frac{2}{3}(2\bar{w}_{z}-\bar{u}_{x}-\bar{v}_{y})\tilde{w}_{z}\nonumber\\ \displaystyle & & \displaystyle +\,\frac{2}{3}(2\tilde{u} _{x}-\tilde{v}_{y}-\tilde{w}_{z})\bar{u}_{x}+(\tilde{u} _{y}+\tilde{v}_{x})\bar{u}_{y}+(\tilde{u} _{z}+\tilde{w}_{x})\bar{u}_{z}\nonumber\\ \displaystyle & & \displaystyle +\,(\tilde{u} _{y}+\tilde{v}_{x})\bar{v}_{x}+\frac{2}{3}(2\tilde{v}_{y}-\tilde{u} _{x}-\tilde{w}_{z})\bar{v}_{y}+(\tilde{w}_{y}+\tilde{v}_{z})\bar{v}_{z}\nonumber\\ \displaystyle & & \displaystyle +\,\left.(\tilde{w}_{x}+\tilde{u} _{z})\bar{w}_{x}+(\tilde{w}_{y}+\tilde{v}_{z})\bar{w}_{y}+\frac{2}{3}(2\tilde{w}_{z}-\tilde{u} _{x}-\tilde{v}_{y})\bar{w}_{z}\right]\nonumber\\ \displaystyle & & \displaystyle +\,\frac{\unicode[STIX]{x1D6FE}(\unicode[STIX]{x1D6FE}-1)M^{2}\bar{\unicode[STIX]{x1D707}}}{Re}\left[\frac{4}{3}(\tilde{u} _{x}^{2}+\tilde{v}_{y}^{2}+\tilde{w}_{z}^{2}-\tilde{u} _{x}\tilde{v}_{y}-\tilde{u} _{x}\tilde{w}_{z}-\tilde{v}_{y}\tilde{w}_{z})\right.\nonumber\\ \displaystyle & & \displaystyle +\,\left.\tilde{u} _{y}^{2}+\tilde{v}_{x}^{2}+\tilde{u} _{z}^{2}+\tilde{v}_{z}^{2}+\tilde{w}_{x}^{2}+\tilde{w}_{y}^{2}+2\tilde{u} _{y}\tilde{v}_{x}+2\tilde{u} _{z}\tilde{w}_{y}+2\tilde{v}_{z}\tilde{w}_{y}\vphantom{\frac{4}{3}}\right].\end{eqnarray}$$