I. INTRODUCTION
Structural adhesives are critical ingredients to the success of adhesive bonding in assembly, repair, and manufacturing processes. A common class of structural adhesives is based on epoxy resins, which feature excellent chemical and corrosion resistance and high mechanical and thermal properties. This class of adhesives has been extensively studied in many engineering sectors, such as automotive, aerospace, and civil constructions. Reference Packham1 Nevertheless, epoxy resins are inherently brittle due to their highly crosslinked structure leading to poor resistance to crack propagation; this implies an unsatisfied service life and high labor cost for maintenance, because microcracks are readily created by vibration or weathering in service and they can propagate to cause catastrophic disasters. Reference Kinloch, Shaw, Tod and Hunston2–Reference Mo, Wang, Du, Ma, Qian, Chen and Qian4 Therefore, a number of tougheners have been developed for bulk epoxy resins, including clay, Reference Ma, Xu, Ren, Yu and Mai5–Reference Zulfiqar, Sarwar, Lieberwirth and Ahmad7 carbon-based materials, Reference Zaman, Kuan, Meng, Michelmore, Kawashima, Pitt, Zhang, Gouda, Luong and Ma8,Reference Cheng, Wang, Jiang, Li and Fan9 silica, Reference Tang, Wan, Peng, Pei, Wu, Chen, Shu, Jiang and Lai10,Reference Ma, Mo, Du, Rosso, Friedrich and Kuan11 and other elastomer materials. Reference Ma, Mo, Du, Dai and Luck12–Reference Kim, MacKay and Mai15 Of these additives, elastomeric nanoparticles of ∼55 nm in diameter have recently been found the most effective, as shown by an improvement of 877% in fracture energy observed at 5 vol% nanoparticle fraction, without adversely degrading the matrix stiffness and strength. Reference Le, Kuan, Dai, Zaman, Luong and Ma16,Reference Zhenyi, Langford, Dickinson, Engelhard and Baer17 However, it is unclear whether this superior toughening mechanism as seen in bulk materials is also effective in thin film adhesives, because of the high constraint by stiff adherends, Reference Wang18 which may limit the amount of energy absorption during fracture. It is generally believed that there is a critical adhesive thickness to obtain an ideal adhesive toughness. Reference Kinloch and Shaw19–Reference Choi21 When the bond thickness is less than this critical value, the plastic deformation zone cannot fully develop due to the restriction imposed by the substrates. When the adhesive is thicker than this critical thickness, the plastic deformation zone is no longer constrained, with fracture energy asymptoting to that pertinent to the bulk resin. Reference Kinloch and Shaw19–Reference Takeda, Matoba, Matsuda, Seki, Inoue, Oishi and Sakai23 In particular, a maximum adhesive toughening effect should be obtained when the thickness approximates the diameter of the plastic zone for rubber-toughened adhesives. Reference Kinloch and Shaw19,Reference Imanaka, Nakamura, Nishimura and Iida24 However, this critical thickness is often not practical in applications because (i) thick adhesive bonds are more susceptible to voiding that can reduce the mechanical performance of adhesive joints and (ii) thick adhesive reduces the joint shear strength. Reference da Silva, Rodrigues, Figueiredo, De Moura and Chousal25
The true critical energy release rate (G c) is the most important parameter to indicate adhesive toughness in real conditions, but there is no such perfect mode in practice, meeting all the requirements of G c. Reference Kinloch26 In comparison, Mode I fracture test is the most commonly utilized, with both ISO and ASTM standards being available. 27,28 In this study, Mode I double-cantilever beam test is employed to obtain G 1c.
Since nanosized elastomeric particles have been found to significantly improve the fracture toughness of bulk nanocomposites, Reference Le, Kuan, Dai, Zaman, Luong and Ma16,Reference Zhenyi, Langford, Dickinson, Engelhard and Baer17 the aim of the research reported herein is to investigate whether the same toughening mechanism is also effective in enhancing the toughness and strength of adhesives. Particular focuses will be placed on the relations between particle size, adhesive thickness, matrix ductility, and the resulting adhesive toughness.
II. EXPERIMENTAL DETAILS
A. Materials and preparation
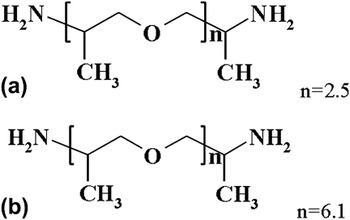
Epoxy resin, diglycidyl ether of bisphenol A (DGEBA, Araldite-F) with an epoxide equivalent weight of 182–196 g/equiv, was supplied by Ciba–Geigy, Australia. Micro rubber particles were dispersed in the matrix by phase-separation in curing epoxy with liquid rubber, a butadiene–acrylonitrile copolymer terminated by amine groups (Hycar 1300×35, Noveon Inc., Cleveland, OH). Nanosized rubber particles (Kane ACE Mx-120) were supplied as a colloidal sol (25 wt%, EEW 243 g/equiv) in epoxy by Kaneka, Japan. Hardener Jeffamine D-230 (denoted J230) and Jeffamine D-400 (J400) were kindly provided by Huntsman (Melbourne). Figure 1 shows the molecular structures of these two hardeners, which are different in molecular chain length and may affect the ductility of cured polymers.
Hardeners used in this study: (a) Jeffamine D-230 and (b) Jeffamine D-400.

Adherends were manufactured from aluminum 6060 alloy, which has a Young's modulus of 69 GPa and a yield strength of 187 MPa. The adherends (150 × 10 × 10 mm) were fabricated according to ISO standard 25217:2009 whose sample fabrication is similar to ASTM 3433-99, 27,28 using 0.1- and 0.6-mm-thick copper shims to control the adhesive thickness. Precrack was created by inserting 40-µm-thick nonsticky paper in the midplane of the adhesive layer.
The adhesives containing 2.5–5.0 vol% additives were fabricated by mechanically mixing epoxy resin (DGEBA) with stoichiometric amounts of either liquid rubber or nanoparticle master batch at 60 °C for 30 min. A calculated quantity of either J230 (weight ratio of DGEBA/J230 = 3.30:1) or J400 (DGEBA/J400 = 1.76:1) was added to the mixture and mixed for 2.5 min at 40–50 °C. Each mixture was carefully degassed in a vacuum oven for 15 min to remove bubbles, followed by applying adhesives on the desired surface of two substrates (adherends). Curing was conducted at 120 °C for 12 h.
Test coupons of bulk nanocomposites, both compact tension (CT) and tensile testing samples (9.5 mm in width × 5.0 mm in thickness), were produced by first blending the epoxy resin with hardener and degassing. The mixture was poured into the CT and dumbbell silicone rubber molds. The cast samples were then cured at 120 °C for 12 h. Both sides of samples were polished by sand paper until all visible marks disappeared. Then the samples were thermally treated at 120 °C for 120 min to remove local stress concentration caused by polishing. Tensile testing was performed at a displacement rate of 0.5 mm/min at room temperature; an Instron extensometer 2630-100 with 25 mm in gage length was used to collect displacement data for determination of elastic modulus; and all Young's moduli were calculated using data within the range of 0.005–0.2% strain.
B. Adhesive toughness measurement
Since instantly propagated cracks were proved sufficiently sharp for the accurate, reproducible fracture toughness measurement of CT, single-edge notched bending samples, and adhesive joints, Reference Ma, Qi, Bayley, Du, Mo and Zhang29 this technique was employed in this study of adhesives. Specifically, a precrack of appropriate length was made by embedding a nonsticky paper. After removing brass shims from a joint and clamping tightly at distance of a third of double cantilever beam (DCB) length from the end by a bench vice, a wedge was inserted into the precrack and tapped to produce an instantly propagated crack of desired length. A layer of plaster coating was made on each side of the joint to monitor the crack growth. According to ISO standard, the propagated crack must be crescent-like and longer than the embedded crack. Reference Meng, Zaman, Hannam, Kapota, Luong, Youssf and Ma30 An example of the crack front was shown in Fig. 5 of Ref. Reference Meng, Zaman, Hannam, Kapota, Luong, Youssf and Ma30. The sample was then mounted onto an Instron machine for measurement. The adhesive toughness (G 1c) of DCB specimens was calculated according to ISO25217 ‘corrected beam theory’ (see SI). 28
C. Adhesive performance by lap shear testing
The substrates for adhesive lap shear tests (100 × 25 × 3 mm) were the same as DCB in Sec. II. B (aluminum 6060), and they were fabricated according to ISO standard 4587 31 and 0.2-mm-diameter copper wires were used to control the adhesive thickness.
D. Morphology
Scanning electron microscopy (SEM) was used to examine the fracture surfaces (crack tip and propagation zone) of DCB and CT specimens. After coated with a thin layer of platinum, these surfaces were observed using a Philips XL30 FEGSEM (Eindhoven, Netherlands) at 10 kV.
Transmission electron microscopy (TEM) was performed to provide detailed images of the internal structure of epoxy/rubber nanocomposites. Ultrathin sections of 50 nm were microtomed from samples using a Leica Ultracut S microtome (Leica, Glattsbrugg, Switzerland) equipped with a diamond knife, and were collected on 400-mesh copper grids and stained with 5 wt% osmium tetroxide for 12 h. These sections were examined with a Philips CM200 transmission electron microscope at an accelerating voltage of 200 kV. Particle sizes were analyzed using an image analysis software analySIS®.
III. RESULTS AND DISCUSSION
A. Toughening by micrometer-sized rubber particles
1. Adhesive toughness of epoxy/rubber microcomposites
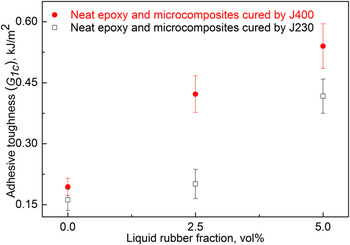
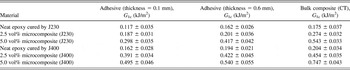
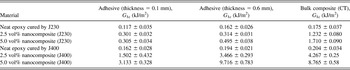
Figure 2 and Table I contain adhesive toughness of neat epoxy and its liquid rubber composites. Although the adhesive toughness increases in both cured systems, the J400-cured system demonstrates much higher level of improvements in fracture toughness. Neat epoxy cured by J230 shows a fracture toughness of 0.162 ± 0.026 kJ/m2 in comparison with 0.194 ± 0.021 kJ/m2 for J400-cured epoxy (in Table I). Of all the microcomposites measured, a maximum increase of 110% in toughness is seen for the 5.0 vol% adhesive. As illustrated in Fig. 1, the molecular formulas of J230 and J400 consist of identical repeat units, but J400 molecule is nearly 100% longer than a J230 molecule. The longer a hardener's molecule, the larger the distance between adjacent crosslinking sites. Thus, the J400-cured system can produce more deformation without a failure than the J230-cured one; this translates to a greater level of plastic deformation around the crack tip, and thus higher fracture toughness for polymers cured using a J400 hardener. In other words, J400 upon curing can provide a more flexible network to absorb fracture energy by promoting more matrix deformation around the particles than J230. Therefore, the J400-cured system demonstrates higher adhesive toughness at all fractions.
Adhesive toughness of epoxy/rubber microcomposites using two hardeners J230 and J400, respectively, with an adhesive layer thickness of 0.6 mm.

Adhesive toughness of neat epoxy and its rubber microcomposites.

2. Effect of adhesive thickness on fracture toughness
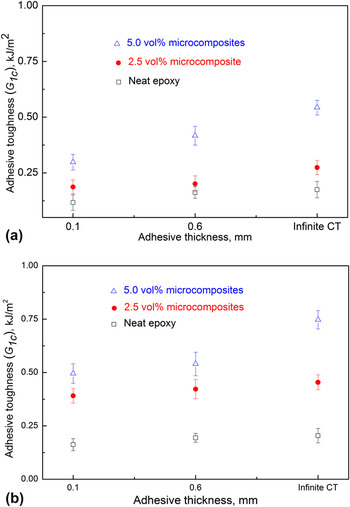
It is known that adhesive toughness increases initially with adhesive thickness, since thicker adhesive can provide more space for plastic deformation under loading to dissipate fracture energy. Figure 3 demonstrates the effect of adhesive thickness on toughness of the two microcomposite systems. The adhesive toughness of neat resins shows no visible change with increase in the thickness, but the toughness of the 5.0 vol% adhesive obviously depends on the thickness. This means that a sufficient thickness is indispensable for nanocomposite-based adhesives. Herein CT samples can be considered as the case of an adhesive joint of infinite bond thickness. All the adhesive toughness values for rubber microcomposites were summarized in Table I.
Effect of adhesive thickness on toughness of epoxy/rubber microcomposites using two hardeners: (a) J230 and (b) J400.

B. Toughening by nanosized rubber particles
1. Morphology
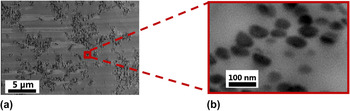
Figure 4 contains TEM micrographs of the 5 vol% epoxy/rubber nanocomposite cured by J400. Most of the nanosized rubber particles form clusters, and the cluster dispersion is relatively good at low magnification. When a representative cluster was magnified in Fig. 4(b), these nanoparticles measured as ∼55 nm in diameter were found separate to each other in the matrix; that is, no aggregation observed.
TEM micrographs of J400-cured epoxy/rubber nanocomposite at 5 vol%: (a) dispersion overview and (b) a magnified cluster.

2. Adhesive toughness of nanocomposites cured by J230 and J400
Figure 5 and Table II show adhesive toughness of the nanocomposites cured by J230 and J400, respectively. Although the toughness of J230-cured system increases obviously with nanoparticle fractions, e.g., 206% improvement at 5.0 vol% over neat epoxy, J400-cured system demonstrates significantly higher toughness, an increase of 4908% at the same fraction. By contrast, there is no obvious difference in the toughness improvement in Fig. 3 for the two sets of microcomposites cured by J230 and J400, respectively. This means that rubber nanoparticles can spectacularly improve adhesive toughness, but this improvement can only occur in a relatively ductile matrix system. In other words, the toughening effect of nano-rubber particles is directly linked to the matrix ductility—J400-cured nanocomposites demonstrating superior adhesive toughness are more ductile than J230-cured nanocomposites, which showed moderately improved toughness. This result indicates the importance of utilizing nanosized rubber particles, rather than micrometer-sized particles, to improve the performance of bulk and adhesive materials.
Adhesive toughness of epoxy/rubber nanocomposites cured by J230 and J400, respectively, with an adhesive thickness of 0.6 mm.

Adhesive toughness of neat epoxy and its rubber nanocomposites.

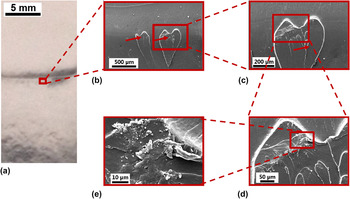
The fracture surface of DCB specimen was investigated to explain the improvement of toughness caused by the hardeners used. The DCB-fractured surface of 5 vol% J230-cured nano-adhesive is illustrated in Fig. 6. Figure 6(a) shows an overview of fracture surface featuring an obvious tip of a crack propagating from top to bottom. The fracture surface in Fig. 6(b) shows a few scale-like structures as indicated by the arrows. Narrow whitening zones are observed in higher magnification images Figs. 6(c) and 6(d), and these zones represent locally cavitated or dilated matrix deformation. The density of the whitening zones is significantly lower than elsewhere, and they are more sensitive to electrons and thus appear white under SEM. These whitening zones and other surface deformation consume fracture energy during crack propagation.
SEM micrographs of DCB-fractured surface of the 0.6-mm-thick, 5 vol% epoxy/rubber nanocomposite cured by J230: (a) for overview of fracture surface surrounding crack tip, (b) and (c) for scale-like structures, and (d) and (e) for matrix deformation. Crack propagates from top to bottom.

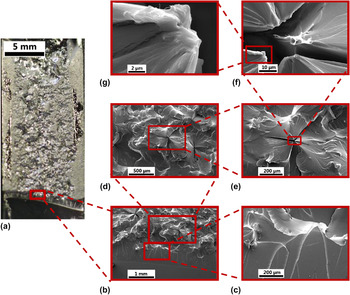
Figure 7 contains micrographs of the DCB-fractured surface of the 5 vol% J400-cured nano-adhesive. A bird view of the fracture surface is shown in Fig. 7(a), where the crack propagation direction is from bottom to top. A river line-like region of ∼1 mm in height is seen in front of the crick tip, which may be caused by tapping prior to the testing. This region is followed by a very rough, whitening zone of ∼21 mm in length in front of the crack tip. At higher magnification, as shown in Figs. 7(b)–7(e), this zone is seen to consist of many cross-like cracks; starting from each crack center, the deformation lines grow extensively outwards; nanofibrils are observed in Figs. 7(f) and 7(g). The formation of these phenomena is explained as below.
SEM micrographs of DCB-fractured surface of the 0.6-mm-thick, 5 vol% epoxy/rubber nanocomposite cured by J400: (a) for bird view of fracture surface including crack tip and deformation zone, (b) and (c) for river-line regions, (d–f) for cross-like cracks, and (g) for matrix deformation. Crack propagates from bottom to top.

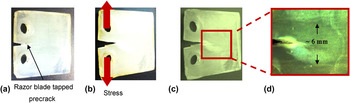
Fracture toughness is the resistance of a material to propagation of a sharp crack. When crack propagation is obstructed by nanoparticles, it may bow out or deflect to produce secondary smaller cracks. It is worth noting that all these cracks observed in previous studies, Reference Ma, Mo, Du, Rosso, Friedrich and Kuan11,Reference Ma, Mo, Du, Dai and Luck12,Reference Le, Kuan, Dai, Zaman, Luong and Ma16,Reference Ma, Qi, Bayley, Du, Mo and Zhang29 albeit in different directions, propagate mainly two-dimensionally. In comparison, the cross-like cracks observed herein propagate three-dimensionally, and this is a unique phenomenon. Since these cracks were not observed in the fracture surface of CT samples (see Fig. SI), they must be caused by the constraining effect of adherends. Under loading, rubber nanoparticles, which are less stiff and stronger than the matrix, would produce voids within a long band ahead of the crack tip; with further loading, these voids grow and expand to absorb more fracture energy. By comparison, a CT specimen of nanocomposite would produce a near-spherical plastic zone of a few millimeters in diameter (in Fig. 8) at the crack tip. In this study, where the adhesives of 0.6 mm in thickness are investigated, a much longer plastic zone is produced due to the constraining effect of adherends. Within the plastic zone and within the adhesive layer, the cross-like cracks can absorb far more energy than planar cracks. The constraining effect combining with the relatively ductile matrix of the adhesive causes deformation to develop along the propagation direction, explaining the ∼21 mm long plastic deformation zone observed in Fig. 7(a). Fibrils are often observed on the fracture surface of highly reinforced or toughened composites. Reference Jancar, Douglas, Starr, Kumar, Cassagnau, Lesser, Sternstein and Buehler32–Reference Xia, Wang and Greer34 Given the large dimensional difference between nanoparticles and fibrils in this study, these fibrils most likely consist of the nanoparticles and the orientated chains of the matrix.
(a) Precracked CT specimen, (b) and (c) its plastic zone after testing with different brightness, and (d) processed image by Photoshop to clearly show the zone size.

3. Effect of thickness on adhesive toughness
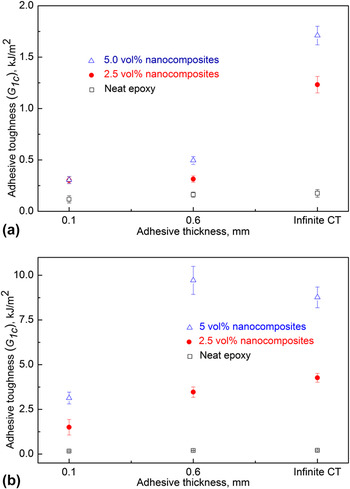
Figure 9 shows the effect of adhesive thickness on the toughness of neat epoxy resins and their nanocomposites. With an increase in adhesive thickness from 0.1 to 0.6 mm, increases of 4% and 62% in adhesive toughness are observed for the 2.5 vol% and 5.0 vol% J230-cured nanocomposites, respectively. Nevertheless, the infinite-thickness adhesives (CT samples) produce far higher toughness than the 0.6-mm-thick samples. This implies that elastomeric nanoparticles were only capable of moderate toughening of the J230-cured adhesives with the thickness considered in this study, although they produced a high toughening effect in the bulk resin. With the adhesive thickness increasing from 0.1 to 0.6 mm, however, J400-cured nanocomposites demonstrate more obvious toughness improvements, 131% for the 2.5 vol% adhesive and 210% for the 5.0 vol% adhesive. Interestingly, these 0.6-mm-thick adhesives demonstrate similar energy release rate to their bulk nanocomposites. This means that the superior toughening mechanisms of nanoparticles in bulk resins are also effective in adhesives, provided the matrix has sufficient ductility and the adhesive is of sufficient thickness. Of the matrix ductility and adhesive thickness, the former appears more important in enabling the superior toughening effect of rubber nanoparticles. All the adhesive toughness results for rubber nanocomposites are listed in Table II.
Effect of adhesive thickness on toughness of epoxy/rubber nanocomposites cured by (a) J230 and (b) J400, respectively.

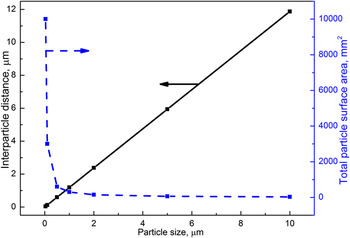
Effect of particle size on surface–surface interparticle distance and total particle surface area in 1 mm3 of the 5 vol% composite.

C. Toughening mechanisms – why nanoparticles toughen better than micrometer-sized particles?
Elastomeric nanoparticles show far higher toughening effect on adhesives than their peer microparticles, and this may be explained from the surface–surface interparticle distance and total particle surface area in a matrix. Adapting a previous model, Reference Jancar, Douglas, Starr, Kumar, Cassagnau, Lesser, Sternstein and Buehler32 it is possible to estimate the surface–surface interparticle distance and total surface area, as shown in Fig. 10 against the particle size for a given volume fraction of particles and also a given quantity of a composite. The interparticle distance increases markedly with particle size. For example, a mean distance of 65 nm observed between adjacent 55-nm particles increases to 1188 nm for neighboring 1-µm particles. This means that nanoparticles can readily interact each other to produce much more intense filler–filler network than microparticles. More importantly, the total particle surface area drops dramatically for particles smaller than 100 nm in diameter. In a given volume, 55-nm particles produce a 7500 mm2 surface area in comparison with a surface area of 300 mm2 for 1-µm particles. This implies that nanoparticles have far more interface region with matrix and thus they can produce a much larger scale of matrix deformation to absorb fracture energy, which would reduce the chance of interface debonding. Nevertheless, the results in Fig. 5 indicate that activation of the effects of interparticle distance and surface area of nanoparticles require a matrix of appropriate ductility to obtain superior adhesive toughness.
The ductility of nanoparticles also plays an essential role in producing a marked toughness improvement. Silica nanoparticles are stiff and do not cavitate to induce a large-scale matrix deformation, thus producing a thin plastic deformation zone along the crack propagation direction (see Figs. 17–19 in Ref. Reference Ma, Mo, Du, Rosso, Friedrich and Kuan11). Rubber nanoparticles are elastomeric, and can readily deform under loading; therefore, they can induce a large-scale matrix deformation as shown in Fig. 7(a), which absorbs much fracture energy leading to significant toughness improvement.
D. Plastic deformation zone
In rubber-toughened epoxy, it is generally agreed that rubber particles cavitate first and almost simultaneously induce matrix shear yielding, producing a plastic deformation zone. The zone size can be calculated by: Reference Kinloch and Shaw19,28
 $${r_{\rm{y}}} = {1 \over {2{\rm{\pi }}}}{{{\rm{E}}{{\rm{G}}_{1{\rm{c}}}}} \over {\sigma _{\rm{y}}^2}}\;{\rm{Plane \hbox{-} stress}}\;{\rm{condition}}\quad$$
 $${r_{\rm{y}}} = {1 \over {6{\rm{\pi }}}}{{{\rm{E}}{{\rm{G}}_{1{\rm{c}}}}} \over {\sigma _{\rm{y}}^2}}\;{\rm{Plane \hbox{-} strain}}\;{\rm{condition}}\quad$$
where r y is the Irwin’s first order estimate of the plastic zone size under plane-stress and plane-strain conditions, E is the adhesive modulus, G 1c is the mode I fracture energy of the bulk adhesive specimen, and σ y is the yield strength of adhesive. Reference Kinloch and Shaw19,Reference Atkins and Mai35,Reference Kramer, Volinsky, Moody and Gerberich36 The equation for plane-stress conditions is more commonly used for quantitative studies and direct comparison of the adhesive thickness values.
Kinloch and Shaw explained that Reference Kinloch and Shaw19 the adhesive energy G 1c depends on the size of a plastic zone, and that the constraining effects posed by two adherends control the plastic zone size. When a bond thickness is less than 2r y, the plastic zone cannot fully develop due to the restriction imposed by the substrates. When an adhesive thickness becomes larger than 2r y, the plastic zone is no longer constrained by the substrates and hence fracture energy should plateau. A maximum G 1c is reached when the adhesive thickness and plastic zone diameter 2r y are approximately equal. So, an adhesive thickness h m at the maximum G 1c value can be expressed by:
 $${h_{\rm{m}}} = 2{r_{\rm{y}}}$$
At very small adhesive thickness, the plastic zone in a DCB specimen is far smaller (height is limited by the adhesive thickness) than that of a CT sample of the same material, due to the constraining effect posed by the adherends. Therefore, the adhesive toughness is often smaller than the toughness measured by CT for very small bond thicknesses. As the adhesive thickness increases, fracture toughness increases, as shown in Fig. 9(a).
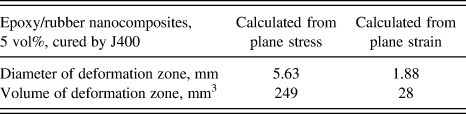
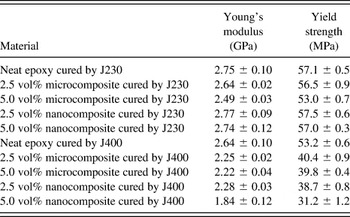
Using the plane-strain and plane-stress solutions [Eqs. (1) and (2)], the plastic deformation zone sizes of a CT specimen for the 5 vol% epoxy/rubber nanocomposite cured by J400 were determined and given in Table III. All the mechanical properties used for the calculation are listed in Table IV. It can be observed that the plane-stress result matches reasonably well with the experimental measurement, as shown in Fig. 7(a), where the plastic deformation zone was measured by SEM to be 21100.6 mm corresponding to a volume of 126 mm3, between the two values calculated from the plane-stress and plane-strain formulas in Table III, respectively. It is worth to note that the actual plastic deformation zone may be larger than the measured 126 mm3.
Deformation zone sizes calculated from plane stress and plane strain, respectively.

Mechanical properties of neat epoxy and its rubber composites cured by J230 and J400.

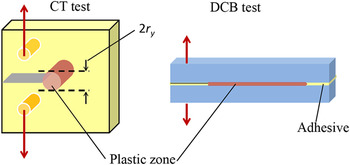
In brief, the superior toughening mechanism of rubber nanoparticles on bulk epoxy is equally effective in thin adhesives as illustrated in Fig. 11, although the crack in a CT specimen dissipates energy by forming a cylindrical deformation zone while a DCB crack consumes energy by deforming along the adhesive plane.
Schematic of deformation zone for CT and DCB specimens.

E. Lap-shear performance of nanocomposite-based adhesives
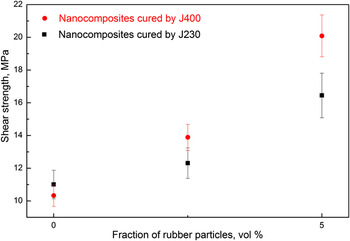
Adhesive toughness represents the energy that an adhesive joint absorbs to prevent a sharp crack propagating, which relates to the residual strength of a joint containing a flaw. The lap-shear testing of adhesive joints measures the shear strength of adhesive joints in pristine conditions without damage or flaws. In Fig. 12, all the nanocomposite joints show markedly improved shear strength, since nanoparticles may promote matrix deformation to absorb more shear energy. The improved shear strength can be explained by the nanoparticles absorbing shearing energy. By contrast, the nanoparticles slightly reduce the yield strength of neat epoxy in Table IV, since the elastomer nanoparticles are far less stiff and stronger than the matrix. In comparison with neat resins, 49% and 95% of increase in shear strength are observed for the J230-cured and J400-cured system containing 5 vol% nanoparticles, respectively (see Table SI). The difference is caused by the matrix ductility—a ductile matrix facilitates more readily the nanoparticles to absorb shearing energy than a brittle matrix.
Shear strength of nanocomposite-based adhesives cured by J230 and J400, respectively.

Three major types of deformation include tension, shearing, and compression. In tension, elastomer particles act as defects; since they are softer and weaker than the matrix, these particles reduce the yield strength. In shearing, these particles can induce matrix deformation, and thus they increase the shear strength.
IV. CONCLUSION
In this study, we have investigated the effects of particle size, matrix ductility, and adhesive thickness on the toughening mechanisms of nanosized and micrometer-sized elastomeric particles. Microparticles have been found to yield moderate increase in fracture toughenness of adhesives, depending on the ductility of the matrix and the adhesive thickness. By contrast, nanoparticles have been found to produce massive improvement in fracture toughness and substantial increase in shear strength. The nanoparticles' toughening mechanisms observed in bulk resins are found to be equally effective in thin adhesives, with appropriate matrix ductility and adhesive thickness. For the 5.0 vol% J400-cured adhesive, the nanosized rubber particles have been found to produce following improvements: (i) 4908% in adhesive toughness and (ii) 95% in adhesive bond shear strength. A unique fracture phenomenon—cross-like cracks—was observed on the fracture surface of our polymeric adhesive, which may absorb more fracture energy than conventional two-dimensional cracks. At a given volume fraction, nanosized particles can result in smaller particle-to-particle distance and much greater particle-matrix surface area, which contribute to the massive increase in fracture toughness.
Supplementary Material
To view supplementary material for this article, please visit http://dx.doi.org/jmr.2014.34X.
ACKNOWLEDGMENTS
Q. Meng thanks AutoCRC for the award of scholarship. We appreciate useful suggestions made by Prof. A. J. Kinloch and Prof. Lin Ye. The authors thank B. Wade and J. Terlet for technical support at Adelaide Microscopy. Jun Ma thanks Huntsman (Melbourne) for providing Jeffamine D230 and D400.