1. Introduction
Primary carbonatite can form from different types of magma derived from the mantle, and it is suggested that partial melting, fractional crystallization or liquid immiscibility can generate distinct type of carbonatite magma (Mitchell, Reference Mitchell2005). Carbonatite magma has very low viscosity; it migrates easily through the mantle and also reacts with it (Green & Wallace, Reference Green and Wallace1988; Hammouda & Laporte, Reference Hammouda and Laporte2000). Carbonatitic magma in the mantle (including magnesio-carbonatites) reacts with depleted mantle wall rocks at < 2 GPa pressure and transforms into more calcite-rich composition with a high CaO/MgO content (Dalton & Wood, Reference Dalton and Wood1993). Experimental studies along with geochemical and mineralogical analyses of mantle xenoliths have shown that carbonate metasomatism can significantly alter the chemical properties of the lithospheric mantle (Green & Wallace, Reference Green and Wallace1988; Yaxley et al. Reference Yaxley, Crawford and Green1991, Reference Yaxley, Green and Kamenetsky1998; Hauri et al. Reference Hauri, Shimizu, Dieu and Hart1993; Ionov et al. Reference Ionov, Dupuy, O’Reilly, Kopylova and Genshaft1993; Boyd et al. Reference Boyd, Pokhilenko, Pearson, Mertzman, Sobolev and Finger1997; Blundy & Dalton, Reference Blundy and Dalton2000; Hammouda & Laporte, Reference Hammouda and Laporte2000; Kogarko et al. Reference Kogarko, Kurat and Ntaflos2001; Dixon et al. Reference Dixon, Clague, Cousens, Monsalve and Uhl2008; Doucet et al. Reference Doucet, Peslier, Ionov, Brandon, Golovin, Goncharov and Ashchepkov2014; Pearson & Wittig, Reference Pearson, Wittig, Holland and Turekian2014; Pokhilenko et al. Reference Pokhilenko, Agashev, Litasov and Pokhilenko2015; Sokol et al. Reference Sokol, Kruk, Chebotarev and Palyanov2016). Interaction of carbonatitic magma with mantle peridotite during carbonate metasomatism and the subsequent formation of olivine is well established (Green & Wallace, Reference Green and Wallace1988; Dalton & Wood, Reference Dalton and Wood1993; Su et al. Reference Su, Chen, Guo, Chu, Liu and Gao2016). Carbonate metasomatism of dunite is a very fast process, where water and CO2-bearing carbonatite magma can ascend through the lithospheric mantle by the dissolution of olivine and reprecipitation of forsterite (Hammouda & Laporte, Reference Hammouda and Laporte2000). This process alters a significant part of the lithospheric mantle with the fugitive CO2 largely lost from the system (Yaxley, Reference Yaxley1993). It can therefore be argued that carbonation of peridotitic lithosphere or CO2 entrapment in the upper mantle by carbonate-rich melt is important in terms of global geodynamics, as it alters the physico-chemical properties of the upper mantle.
Here we report the occurrence of Fe-rich magnesite or (Fe, Mg)CO3 as solid inclusions within a forsterite xenocryst from one carbonatite sample from the Sung Valley ultramafic–alkaline–carbonatite complex (UACC). This UACC is related to the Kerguelen plume activity (Veena et al. Reference Veena, Pandey, Krishnamurthy and Gupta1998). This carbonatite is primary igneous carbonatite (PIC) and has generated due to partial melting of carbonate peridotite in the mantle (Srivastava & Sinha, Reference Srivastava and Sinha2004). This carbonatite interacted with the peridotitic lithosphere during ascent. Our objective was to assess the mineralogical changes this interaction has caused and also to understand the role of volatiles (CO2 and H2O) derived from the carbonatite in alteration of the peridotitic lithosphere. Our study shows carbonate metasomatism in the form of forsterite reprecipitation from olivine. This olivine was sourced from the peridotitic lithosphere, during the ascent of carbonatite magma through the lithospheric mantle. CO2-rich fluid played a pivotal role in the formation of magnesite and this CO2 is released from the carbonatite during its upwards migration. Our results demonstrate that CO2 outflux through the mantle via plume-induced calcio-carbonatite can be entrapped in the peridotitic lithosphere by reacting with olivine and forming magnesite and siderite.
2. Geology of the area
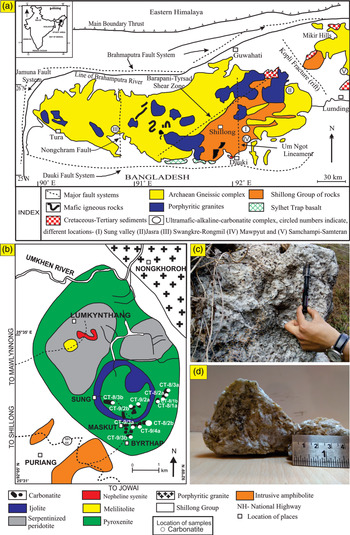
The UACC of Sung Valley is hosted by the Shillong Plateau of NE India (Meghalaya) (Fig. 1a, b). This UACC is associated with the Kerguelen plume (Veena et al. Reference Veena, Pandey, Krishnamurthy and Gupta1998; Ray et al. Reference Ray, Ramesh and Pande1999, Reference Ray, Trivedi and Dayal2000; Srivastava et al. Reference Srivastava, Heaman, Sinha and Shihua2005; Srivastava, Reference Srivastava2020). The Shillong plateau is rectangular in shape and covers an area of about 4 × 10⁴ km2 (Srivastava & Sinha, Reference Srivastava and Sinha2004). This plateau appears as a block of uplifted Precambrian basement and shows a horst-like feature. The E–W-trending Brahmaputra and Dauki fault systems border the Shillong plateau in the north and south, respectively. The NW–SE-trending Kopali fracture zone and the N–S-trending Jamuna fault system characterize the east and west margins of this plateau (Evans, Reference Evans1964; Desikachar, Reference Desikachar1974; Nandy, Reference Nandy1980; Acharya et al. Reference Acharya, Mitra and Nandy1986; Gupta & Sen, Reference Gupta and Sen1988; Srivastava & Hall, Reference Srivastava, Hall, Srivastava and Chandra1995). The N–S-trending Um–Ngot lineament cuts across the Shillong plateau. This lineament contains several alkaline intrusive bodies including the Sung Valley UACC and it is related to the Ninety-East Ridge in the Indian Ocean (Gupta & Sen, Reference Gupta and Sen1988).
(a) Geological map of Shillong plateau. (b) Geological map of Sung Valley, Meghalaya. (c) An outcrop of carbonatite from Sung Valley, Meghalaya. (d) Section of a hand specimen of carbonatite sample, no. CT-8/2b. (a, b) Modified after Srivastava & Sinha (Reference Srivastava and Sinha2004).

The Sung Valley UACC is an oval-shaped plutonic complex emplaced within the Proterozoic Shillong Group of rocks and consists of ultramafics (serpentinized peridotite, pyroxenite and melilitolite), alkaline rocks (ijolite and nepheline syenite) and carbonatites (Srivastava & Sinha, Reference Srivastava and Sinha2004; Srivastava et al. Reference Srivastava, Heaman, Sinha and Shihua2005). The core of this complex is occupied by serpentinized peridotite, and these peridotites are rimmed by pyroxenite. Peridotite and pyroxenite are the earliest rock units of the Sung Valley UACC; ijolite, younger than these ultramafics, forms a ring structure. These three rock units constitute the major part of the Sung Valley UACC. Among all rock units, pyroxenite is dominant and occurs in the marginal part of the complex, which is in direct contact with the quartzites of Shillong Group. The pyroxenite is mostly monomineralic, greenish-black to black in colour and composed dominantly of diopside. Melilitolite intrudes peridotite and pyroxenite as small dykes. Nepheline syenite also occurs as dykes and veins. Carbonatites occupy mainly the southern part of the complex as small stocks, lenses and dykes, and also as veins within the pyroxenite. Carbonatites are the youngest members of this complex (Srivastava & Sinha, Reference Srivastava and Sinha2004).
Petrological and geochemical studies carried out in the past suggest that the carbonatite of the Sung Valley UACC was formed by carbonate magma generated through low-degree partial melting of metasomatized mantle peridotite at ≥ 25 kbar pressure (Srivastava & Sinha, Reference Srivastava and Sinha2004; Melluso et al. Reference Melluso, Srivastava, Guarino, Zanetti and Sinha2010). Ray et al. (Reference Ray, Ramesh and Pande1999) and Srivastava et al. (Reference Srivastava, Heaman, Sinha and Shihua2005) carried out carbon and oxygen isotopic analyses of the UACC carbonatites and inferred incorporation of inorganic carbon from the lithospheric mantle. They further suggested that this inorganic carbon was sourced from ancient subducted oceanic crust. The carbonatites are enriched with light rare earth elements (LREEs; Srivastava & Sinha, Reference Srivastava and Sinha2004; Sadik et al. Reference Sadik, Ranjith and Umrao2014), comparable to other well-known carbonatites (Cullers & Graf, Reference Cullers, Graf and Henderson1984; Woolley & Kemp, Reference Woolley, Kemp and Bell1989; Woolley et al. Reference Woolley, Barr, Din, Jones, Wall and Williams1991; Srivastava, Reference Srivastava1997; Harmer, Reference Harmer1999). This carbonatite consists mainly of calcite and minor dolomite with accessory apatite and magnetite. Noble gas analysis of apatite from the carbonatites of Sung Valley indicates its crystallization during the waning stage of plume magmatism (Basu & Murty, Reference Basu and Murty2006). It also shows significant contributions of mid-ocean-ridge basalt (MORB) and lithospheric components during crystallization of accessory apatite. Sr–Nd–Pb isotopic ratios of the Sung Valley carbonatite also indicate the interaction of plume with the continental lithosphere (Srivastava et al. Reference Srivastava, Heaman, Sinha and Shihua2005). The Sung Valley UACC has been dated by several different methods, giving a range of ages between 100 and 110 Ma (Ray & Pande, Reference Ray and Pande2001; Srivastava & Sinha, Reference Srivastava and Sinha2004; Srivastava et al. Reference Srivastava, Guarino, Wu, Melluso and Sinha2019).
3. Analytical techniques
Petrographic and electron microprobe analyses were carried out on thin-sections. Mineral chemistry was obtained using a CAMECA SXFiveSA electron probe microanalyser (EPMA) at the Department of Geology, Institute of Science, Banaras Hindu University. Wavelength- dispersive spectrometry and a LaB6 source were used to carry out quantitative analyses. A voltage of 25 kV and beam current of 10 nA with a diameter of 1 µm were used. Thallium acid phthalate (TAP), large pentaerythritol (LPET) and large lithium fluoride (LLIF) crystals were used for measurements. Various natural and synthetic standards for rock-forming silicate minerals (diopside, peridote, almandine, albite and orthoclase) were used to calibrate the instrument. For major oxides, less than 1% precision was obtained. Raman spectroscopy was carried out using Horiba Jobin Yvan Lab Ram HR Laser Raman MicroProbe in Raman and Fluid Inclusion Laboratory at Wadia Institute of Himalayan Geology, Dehradun. This instrument includes an 800-nm focal length spectrometer, 514- and 780-nm argon ion lasers, detector charge-coupled device (CCD), edge filters and a trinocular Olympus microscope for both incident and transmitted light. The instrument has a spectral resolution of < 1 cm−1. In the present study, a 514-nm laser of argon ion (Ar+) source was used. For calibration, standard silicon was used, which shows Raman shift at 520.59 cm–1. Calibration was performed with an error of 0.1 cm–1. All the measurements were performed using a 100× objective. Repeated spectra were recorded in the 100–4000 cm−1 region to obtain a better signal-to-noise ratio. Isotopic ratios (for stable carbon and oxygen isotopes) of carbonatite samples from Sung Valley were obtained using gas-source continuous-flow isotope-ratio mass spectrometer (CF-IRMS) through GasBench at Wadia Institute of Himalayan Geology (WIHG), Dehradun. Small chips of fresh and unaltered calciocarbonatite samples (confirmed in thin-sections) were crushed and pulverized using an agate carbide ring grinder. This dry sample powder (100–200 μg) of pure calciocarbonatite was first put in 12 mL vials at 72°C in the GasBench tray and flushed with ultrapure He gas (≥ 99.9995%). In this way, all atmospheric gases from the vials were removed. Dry sample powder of calciocarbonatite was subjected to acidizing process with the injection of c. 50–70 μL phosphoric acid (≥ 99%). Thereafter, all the samples were kept at 72°C for 40–50 minutes to equilibrate and produce carbon dioxide. CO2 formed by this process was introduced into the IRMS through the gas chromatography (GC) column to analyse the isotopic ratio of carbon and oxygen. The δ13C and δ18O in the present study are reported with respect to V-PDB (Pee Dee Belemnite) and V-SMOW (Vienna Standard Mean Ocean Water) standards, respectively, using:
 $$\delta = \left[ {\left( {{R_{{\rm{sample}}}}/{R_{{\rm{standard}}}}} \right) - 1} \right] \times {10^{ - 3}},$$
where R is either 13C/12C or 18O/16O.
Final isotopic ratios of δ13C and δ18O were obtained using the Santrock, Studley and Hayes (SSH) correction (Santrock et al. Reference Santrock, Studley and Hayes1985). Precision better than ± 0.1‰ for δ13C and δ18O was achieved. For calibration, primary standard NBS-18 was used, whereas in-house standard Merck-CaCO3 at the interval of 10 samples was used to verify the precision and quality of the measurement. Inductively coupled plasma – mass spectrometer (ICP-MS; Perkin-Elmer SCIEX ELAN DRC-e) at the WIHG was used to determine REE concentration. An open-system digestion method was chosen for sample preparation. Powder (0.1 g) from each carbonatite sample was separately mixed with an HF and HNO3 (2:1 ratio) solution in Teflon crucibles. Crucibles were then heated over a hot plate until the powdered samples were completely digested. Accuracy range for REE analysis was 2–12%, and precision varied over the range 1–8%. Rock standards (JG-2 and MB-H) were used to calibrate the ICP-MS instrument.
4. Results
A total of 11 fresh samples of carbonatites were collected from different locations (Fig. 1b). Almost all of the carbonatite sample locations are confined to the SE part of the complex. All of these samples represent fresh calcio-carbonatites, which belong to the sovitic carbonatites group (a coarse-grained variety). Two out of these 11 samples contain forsterite grains. However, only one or two forsterite grains were observed in petrographic thin-sections of these two samples.
4.a. Petrography
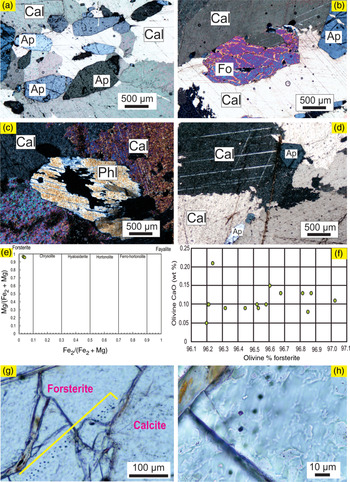
Our petrographic studies reveal that the Sung Valley carbonatite is coarse-grained and shows a hypidiomorphic texture. It is dominantly composed of calcite (80–90%) (Fig. 2a–d). Accessory phases are mostly apatite, which is euhedral to subhedral in nature (Fig. 2a, d), along with phlogopite and magnetite (Fig. 2c). The carbonatite sample CT-8/2b containing one olivine xenocryst was collected from the SE part of the UACC (Fig. 1b, c). This sample consists of 80–90% calcite and c. 5% dolomite (Fig. 2a). The olivine xenocryst is c. 1.5 mm in size and shows resorbed texture (Fig. 2b; rim on the boundary), which confirms its early crystallization and reaction with carbonatitic melt.
(a) Cross-polarized photomicrograph showing coarse-grained calcite with subhedral to anhedral apatites in carbonatite sample (CT-8/2b). (b) Cross-polarized photomicrograph showing presence of forsterite xenocryst with resorbed boundary. (c, d) Petrographic features of analysed carbonatite samples, showing presence of phlogopite and calcite with euhedral to subhedral apatites, respectively. (e) Mg/(Fe2 + Mg) v. Fe2/(Fe2 + Mg) plot representing the position of forsterite xenocryst on Fo–Fy series. The plot was constructed with the EPMA data and this xenocryst fell on the forsterite side on the Fo–Fy solid solution series. (f) Scatter plot of CaO content of xenocrystic olivine v. olivine % forsterite. The field of xenocryst compositions is referred from Spargo (Reference Spargo2007). (g) Plane-polarized photomicrograph of a trail of solid inclusions restricted within forsterite xenocryst (shown with yellow line). (h) Plane-polarized photomicrograph of solid inclusions in forsterite, on higher magnification. Ap – apatite; Cal – calcite; Fo – forsterite; Phl – phlogopite.

4.b. Electron microprobe analysis
Electron microprobe analysis (EPMA) was carried out on 15 spots within one olivine xenocryst present in primary calciocarbonatite (Table 1). The olivine xenocryst is almost pure forsterite with 53.32–55.54% MgO, 3.04–3.87% FeO and 40.63–42.58% SiO2, and a Mg number (100×(Mg/Fe2 + Mg)) value of 96–97%. This indicates a forsterite end-member (Fig. 2e). This olivine is a xenocryst and not an accessory phase of carbonatite. This is confirmed by the presence of pure forsterite with very low CaO content (Fig. 2f and Table 1), which is not likely to form in a Ca-rich rock (Melluso et al. Reference Melluso, Srivastava, Guarino, Zanetti and Sinha2010). A plot of CaO < 0.2 (wt%) and % forsterite > 80 of forsterite xenocryst clearly confirms the disequilibrium between the forsterite xenocryst and carbonatite melt at the time of incorporation of xenocryst in the melt (Fig. 2f).
Composition of forsterite based on EPMA point analysis

a Mg no. = 100×Mg/(Mg+Fe2+).
4.c. Inclusion petrography
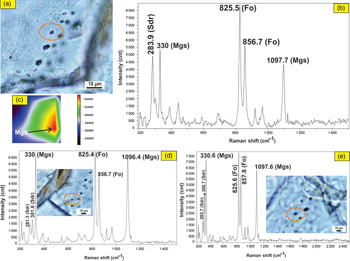
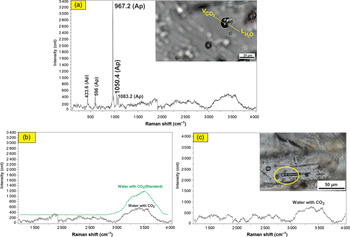
Solid inclusions were observed in the forsterite xenocryst and fluid inclusions in apatite. The forsterite xenocryst hosts a pseudo-secondary, intragranular solid inclusion trail, which is confined within this crystal boundary (Fig. 2g) (Roedder, Reference Roedder1984). These inclusions are solid mineral phases as indicated by their saccharoidal appearance (Figs 2h, 3a, d (inset), e (inset)). They range in size from 2 to 4 μm and are formed as a result of fracture healing during the growth of forsterite crystal (Roedder, Reference Roedder1984). Accessory apatite hosts discrete primary fluid inclusions of various shapes including elliptical to tabular, which are 20–40 μm in size (Fig. 4a (inset), c (inset)). Among them, polyphase and biphase (liquid + vapour) fluid inclusions were considered because they occur in the core of apatite crystals. The occurrence of these fluid inclusions in such a microstructural position suggests primary trapping during growth of its host crystal (Roedder, Reference Roedder1984).
(a) Plane-polarized photomicrograph of saccharoidal solid inclusions in forsterite on higher magnification. (b) Raman spectrum of forsterite (Fo) host, along with magnesite (Mgs) and siderite (Sdr). (c) Mapping in the x–y plane of the solid inclusions, indicating the presence of magnesite. Red–green–blue colours in the map are assigned to intensity of major peak 1097.7 cm−1. (d, e) Additional Raman spectra of solid inclusions (another spots). Insets show high-resolution plane-polarized photomicrographs of the inclusions.

4.d. Raman spectroscopy of inclusions
The phase composition of the forsterite-hosted saccharoidal solid inclusion trail was investigated by Raman microspectroscopy. The Raman spectrum shows the host as forsterite with Raman shifts at 825.5 and 856.7 cm−1 (Fig. 3b). Crystalline phases of these inclusions were identified as magnesite. It shows characteristic Raman shifts at 1097.7 cm−1, which is symmetric stretching vibration v 1, and 330 cm−1, which is strong vibration s (Fig. 3b) (Frezzotti et al. Reference Frezzotti, Tecce and Casagli2012). Siderite is also detected with Raman shift at 283.9 cm−1, which is translational lattice mode with a shoulder peak at around 300 cm−1 (Fig. 3b) (Frezzotti et al. Reference Frezzotti, Tecce and Casagli2012). Usually, translational lattice modes in magnesite and siderite show slightly less intensity than the symmetric stretching vibration v 1. However, in some cases and in the present study, T vibrations (translational lattice modes) show slightly higher intensity than the v 1 bands (i.e. RRUFF ID X050115 and X050116 for magnesite and X050143 for siderite). In these Raman spectra (Fig. 3), all the vibrations of carbonates (magnesite and siderite) result in narrow FWHM (full width of the Raman peak at half maximum height), which further confirm the high crystallinity of these inclusions. Due to the occurrence of these two carbonates together and absence of v 1 vibrations of siderite at c. 1090 cm−1, we have used the term Fe-rich magnesite or (Fe, Mg)CO3. Raman mapping of these saccharoidal inclusions in the x–y plane confirms the presence of magnesite (Fig. 3c). Raman microspectroscopy spot analysis of representative polyphase primary fluid inclusions hosted by apatite (Fig. 4a (inset)) was also carried out. The liquid and vapour phases were identified as water and CO2 (Fig. 4b). Host apatite shows Raman shift at 967.2 cm−1 and asymmetric hump (fitted with standard spectrum) at around 3000–4000 cm−1, indicating the presence of water with CO2 (Fig. 4b). Additional Raman spectra of solid inclusions within the forsterite xenocryst are shown in Figure 3d and e, while the additional spectrum for biphase fluid inclusions in apatite is provided in Figure 4c.
(a) Raman spectrum of host apatite. Inset shows plane-polarized photomicrograph of elliptical polyphase primary fluid inclusions in apatite, showing vapour phase of CO2 and liquid H2O. (b) Extracted Raman spectrum of (a) fitted with standard spectrum, showing presence of water with CO2. Spectrum standard used for reference: quality of spectrum, water with CO2; library, minlabv5.lib (spectrum id: NGS26E9.spc). (c) Raman spectrum of tabular biphase fluid inclusion in apatite showing the presence of water with CO2. Inset shows the photomicrograph of analysed fluid inclusion. Ap – apatite.

4.e. Stable isotope and bulk-rock geochemistry
Eight representative samples of carbonatite were analysed for stable isotopes of 18O and 13C. Oxygen isotope data of our samples fall in the range of +7.88‰ to +9.22‰ with ±0.1‰ precision (Fig. 5; Table 2). This suggests that the carbonatite is primary and of mantle origin (Taylor et al. Reference Taylor, Frechen and Degens1967; Deines & Gold, Reference Deines and Gold1973; Sheppard & Dawon, Reference Sheppard and Dawon1973). Carbon isotope values, on the other hand, fall in the range of −3.70‰ to −4.96‰ with ±0.1‰ precision and indicate some enrichment compared with normal mantle values (δ13C = −5‰ to −8‰) (Fig. 5; Table 2). Stable isotopic (C and O) data in this study corroborate previously obtained data (Srivastava et al. Reference Srivastava, Heaman, Sinha and Shihua2005).
Carbon and oxygen (δ13C and δ18O) isotopic compositions of Sung Valley carbonatites. Primary igneous carbonatites (PIC) defined after Taylor et al. (Reference Taylor, Frechen and Degens1967), modified PIC after Deines (Reference Deines and Bell1989) and Keller & Hoefs (Reference Keller, Hoefs, Bell and Keller1995), and normal mantle values after Kyser (1990) and Keller & Hoefs (Reference Keller, Hoefs, Bell and Keller1995).

Isotopic data obtained for stable isotopes of carbon and oxygen, from the analysis of carbonatites of Sung Valley, Meghalaya. The standard deviation for δ13C and δ18O is ±0.1‰

These same eight samples were chosen for whole-rock geochemistry (Table 3) and were analysed for REE content; total abundance ranged widely from 737 to 1219 ppm (Table 3). A chondrite-normalized REE plot (Boynton, Reference Boynton1984) shows enrichment of LREEs compared with heavy REEs (HREEs) (Fig. 6).
Rare earth element concentration (ppm) of Sung Valley carbonatites, analysed by ICP-MS

Chondrite-normalized rare earth element patterns for carbonatite samples of Sung Valley. (Analysed sample no. CT-8/2b is highlighted in red with unique symbols.) Chondrite values after Boynton (Reference Boynton1984).

5. Discussion
5.a. Interaction of carbonatitic magma with the peridotitic lithosphere
Petrographic and EPMA analyses of sample CT-8/2b provide direct evidence of the interaction between carbonatitic melt and the peridotitic lithosphere. The xenocrystic nature of the olivine crystal is confirmed by its pure forsteritic nature with very low CaO content (Fig. 2f; Table 1), which is not likely to form in a Ca-rich rock. Olivine present in the Sung Valley carbonatite was earlier interpreted as a conspicuous silicate phase (e.g. Melluso et al. Reference Melluso, Srivastava, Guarino, Zanetti and Sinha2010; Sai & Sengupta, Reference Sai and Sengupta2017). These workers suggested that this olivine is in equilibrium with the carbonatite melt. However, a plot between CaO (wt%) and % forsterite (Fig. 2f) suggests that this olivine was not in equilibrium. It shows minimum % forsterite values of c. 96. For this olivine to be in equilibrium, the points should fall at c. 80 (Spargo, Reference Spargo2007; Brenna et al. Reference Brenna, Cronin, Smith, Tollan, Scott, Prior, Bambery and Ukstins2018). It may also be noted that these olivine grains are too rare in Sung Valley carbonatite to be considered an accessory phase. We have carried out petrographic analysis of 11 samples of carbonatites, and olivine was observed in only 2 of them. This paucity also suggests the xenocrystic nature of olivine in Sung Valley carbonatite. We therefore inferred that the olivine xenocryst was scavenged from the peridotitic lithosphere by carbonatite melt.
Experiments suggest that due to the very fast penetrative infiltration mechanism of carbonatite magma in polycrystalline olivine (in peridotites) (Hammouda & Laporte, Reference Hammouda and Laporte2000), chemical exchange between carbonatite melt and rock matrix took place (Green & Wallace, Reference Green and Wallace1988; Yaxley et al. Reference Yaxley, Crawford and Green1991; Hauri et al. Reference Hauri, Shimizu, Dieu and Hart1993; Rudnick et al. Reference Rudnick, McDonough and Chappell1993) and carbonatite melt metasomatizes the mantle rocks at the time of ultrafast mantle impregnation. As a consequence, with the dissolution of olivine from peridotite, forsterite is reprecipitated in carbonatite reservoir (Hammouda & Laporte, Reference Hammouda and Laporte2000).
It can therefore be argued that the forsterite xenocryst investigated was originally from the peridotitic lithosphere that became engulfed in ascending carbonatitic magma and was subsequently altered by dissolution precipitation process. This occurred during upwards migration of carbonatitic magma through the peridotitic lithosphere, and the forsterite must have precipitated initially in euhedral form. However, its boundaries became resorbed and gave it a subhedral to anhedral shape during its interaction with the carbonatitic magma. Complete resorption could not take place, as the xenocryst was not in equilibrium with the carbonatite magma (Fig. 2f).
Our geochemical analyses show enrichment of REEs, specifically LREEs with a high La/Yb ratio (Table 3; Fig. 6), in carbonatite, which is similar to the results obtained by earlier workers researching the Sung Valley UACC (Srivastava et al. Reference Srivastava, Heaman, Sinha and Shihua2005; Sadik et al. Reference Sadik, Ranjith and Umrao2014). Carbonatitic melts generated from partial melting of carbonated peridotites are extremely enriched in incompatible elements, especially LREEs, and are highly metasomatic in nature (Green & Wallace, Reference Green and Wallace1988; Ionov et al. Reference Ionov, Dupuy, O’Reilly, Kopylova and Genshaft1993; Rudnick et al. Reference Rudnick, McDonough and Chappell1993; Yaxley et al. Reference Yaxley, Green and Kamenetsky1998; Blundy & Dalton, Reference Blundy and Dalton2000; Hammouda & Laporte, Reference Hammouda and Laporte2000; Grassi & Schmidt, Reference Grassi and Schmidt2011; O’Reilly & Griffin, 2013; Sokol et al. Reference Sokol, Kruk, Chebotarev and Palyanov2016; Gervasoni et al. Reference Gervasoni, Klemme, Rohrbach, Grützner and Berndt2017). The metasomatic nature of this carbonatite is evident from our EPMA analysis that reveals the highly forsteritic nature of the olivine xenocryst (% forsterite c. 97; Fig. 2e). This is a typical evidence of carbonate metasomatism of the mantle peridotites caused by the migration of carbonatitic magma through peridotitic lithosphere (Hammouda & Laporte, Reference Hammouda and Laporte2000; Su et al. Reference Su, Chen, Guo, Chu, Liu and Gao2016).
As described by Srivastava et al. (Reference Srivastava, Heaman, Sinha and Shihua2005), the interaction of carbonatitic melt with the lithosphere is also well established by isotopic studies in the Sung Valley UACC. This in turn indicates that the carbonation of the lithospheric mantle took place during ascent of carbonatitic magma through the mantle lithosphere. Our results, integrated with existing isotopic data, therefore clearly suggest that carbonatitic magma interacted with and metasomatized the lithospheric mantle in the Sung Valley UACC during its ascent.
5.b. Formation of magnesite due to carbonation of forsterite by primary igneous carbonatite magma
The occurrence of Fe-rich magnesite inclusion trail only in forsterite crystal implies that forsterite was subjected to carbonation in the presence of CO2 at the time of its precipitation and crystallization. As a result, Fe-rich magnesite was formed (Xiong & Giammar, Reference Xiong and Giammar2014; Loring et al. Reference Loring, Chen, Bénézeth, Qafoku, Ilton, Washton, Thompson, Martin, McGrail, Rosso and Felmy2015; Stopic et al. Reference Stopic, Dertmann, Modolo, Kegler, Neumeier, Kremer, Wotruba, Etzold, Telle, Rosani and Knops2018). Since this forsterite is a xenocryst, we envisage that this trail of inclusions has formed as a result of healing fractures during forsterite crystal growth. There is another possibility of magnesite being a secondary inclusion entrapped after the formation of forsterite. Both these processes can occur during carbonation of forsterite while within the carbonatitic magma at the time of its growth or after the completion of crystallization. This trail could therefore be pseudo-secondary or secondary in nature (Roedder, Reference Roedder1984). Above-mentioned carbonation reaction can be described by the relevant MgO–CO2 system (Stopic et al. Reference Stopic, Dertmann, Modolo, Kegler, Neumeier, Kremer, Wotruba, Etzold, Telle, Rosani and Knops2018).
The formation of magnesite through carbonation takes place through the following exothermic reaction:
 $${\rm{Mg}}{{\rm{O}}_{{\rm{(s)}}}}\,{\rm{ + }}\;{\rm{C}}{{\rm{O}}_{{\rm{2}}\left( {\rm{g}} \right)}}\,{\rm{ = }}\,{\rm{MgC}}{{\rm{O}}_{{\rm{3(s)}}}}{\rm{ + }}\;{\rm{energy,}}$$
where the subscripts s and g refer to the state (solid and gas, respectively).
The carbonatites from Sung Valley UACC are characterized by primary fluid inclusions of water with CO2 (Fig. 4) in accessory apatite, which are the essential fluid components of carbonatitic magma (Ray & Ramesh, Reference Ray and Ramesh2006). Carbonatite is characterized by its CO2-rich composition (Bailey & Hampton, Reference Bailey and Hampton1990; Dawson et al. Reference Dawson, Pinkerton, Pyle and Nyamweru1994; Dixon et al. Reference Dixon, Clague, Wallace and Poreda1997; Lee & Wyllie, Reference Lee and Wyllie1998; Ray & Ramesh, Reference Ray and Ramesh2006; Jones et al. Reference Jones, Genge and Carmody2013) and considered as a major carrier of CO2 and H2O fluids in the mantle (Ray & Ramesh, Reference Ray and Ramesh2006). After combining experimental studies on mantle-related carbonatites, Harmer (Reference Harmer1999) showed that low-viscosity carbonatitic melt can percolate upwards and generate free fluid (CO2) and metasomatic olivine. We therefore suggest that these fluid phases (H2O and CO2) from ascending carbonatite in accessory apatite formed magnesite by interacting with olivine from the lithospheric mantle.
We carried out stable isotope analysis to confirm that the magnesite is not a product of alteration or hydrothermal reactions in the carbonatite. Our C and O isotopic analyses reaffirm the fact that these carbonatites were not affected by any secondary hydrothermal alteration, shallow crustal contamination or even magmatic fractionation (Fig. 5). Moreover, the effect of fractional crystallization can also be ruled out, as in such cases δ18O and δ13C values are scattered (Deines, Reference Deines and Bell1989; Ray & Ramesh, Reference Ray and Ramesh2000), unlike the clustered narrow range of values obtained here (Fig. 5). The δ18O values are restricted between 1‰ and 10‰ (mantle values; Fig. 5) and rule out any possibility of fluid loss during the emplacement of these carbonatites (Ray et al. Reference Ray, Ramesh and Pande1999). All the samples we analysed fall within the primary igneous carbonatites field. This field represents the primary isotopic composition of typical igneous carbonatites of mantle origin (Keller & Hoefs, Reference Keller, Hoefs, Bell and Keller1995). Here ‘primary’ indicates carbonatites that are unaffected by surficial secondary processes. Our δ13C and δ18O values tend towards the primary igneous carbonatite values defined by Taylor et al. (Reference Taylor, Frechen and Degens1967), which are much closer to normal mantle values, negating the possibility of any secondary alteration processes. It is worth noting that 87Sr/86Sr and 143Nd/144Nd isotopic ratios of Sung Valley carbonatites obtained by Veena et al. (Reference Veena, Pandey, Krishnamurthy and Gupta1998) and Ray et al. (Reference Ray, Trivedi and Dayal2000) also indicate that these carbonatites are unaffected by crustal contamination. Sr86/Sr87 and δ18O isotopic study by Srivastava et al. (Reference Srivastava, Heaman, Sinha and Shihua2005) also indicate that the Sung Valley carbonatite is not affected by any crustal contamination and hydrothermal alteration. Our inference is in accordance with that of Srivastava et al. (Reference Srivastava, Heaman, Sinha and Shihua2005), who suggested derivation of this carbonatite from low-degree (c. 0.1%) partial melting of carbonated mantle peridotite. Our stable isotope analysis indicates two things. First, no enrichment of 18O indicates that the carbonatites were not affected by any magmatic fractionation or secondary hydrothermal processes (Table 2). Second, δ13C values (−3.70‰ to −4.96‰) indicate the incorporation of recycled inorganic carbon (Table 2). Our isotopic results are comparable with previous work where it is suggested that this inorganic carbon was originally derived from ancient subducted oceanic crusts (Ray et al. Reference Ray, Ramesh and Pande1999). Our stable isotope analysis therefore negates the possibility of magnesite formation through any hydrothermal or crustal contamination process, and reaffirms its formation through metasomatism of forsterite by CO2-rich fluids originated from carbonatite magma.
5.c. Implications for CO2 entrapment in the lithospheric mantle
The crux of the present study is the formation of (Fe, Mg)CO3 in olivine from peridotitic lithosphere by CO2- and H2O-bearing carbonate-rich fluids. Formation of Fe-rich magnesite in olivine by CO2 is a very important global phenomenon that helps sequestration of atmospheric CO2 in geological reservoirs (Kelemen & Matter, Reference Kelemen and Matter2008). Metasomatism of peridotitic rocks by CO2-rich fluid can efficiently form magnesite in peridotitic rocks by post-entrapment carbonation reaction (Berkesi et al. Reference Berkesi, Guzmics, Szabó, Dubessy, Bodnar, Hidas and Ratter2012). Experimental studies have shown that CO2-saturated aqueous fluid and H2O-saturated supercritical CO2 can readily form magnesite by reacting with olivine/forsterite (Kwak et al. Reference Kwak, Hu, Turcu, Rosso, Ilton, Wang, Sears, Engelhard, Felmy and Hoyt2011; Todd Schaef et al. Reference Todd Schaef, McGrail, Loring, Bowden, Arey and Rosso2013; Loring et al. Reference Loring, Chen, Bénézeth, Qafoku, Ilton, Washton, Thompson, Martin, McGrail, Rosso and Felmy2015; Stopic et al. Reference Stopic, Dertmann, Modolo, Kegler, Neumeier, Kremer, Wotruba, Etzold, Telle, Rosani and Knops2018). Precipitation of Mg- and Fe-carbonates during these reactions is further facilitated by fractures present in the rocks (Xiong & Giammar, Reference Xiong and Giammar2014). Carbonatitic magma not only has the lowest viscosity among all types of magmas, but also has low interfacial energy with respect to mantle minerals (Dobson et al. Reference Dobson, Jones, Rabe, Sekine, Kurita, Taniguchi, Kondo, Kato, Shimomura and Urakawa1996). This enables migration of carbonate-rich melt through grain boundary networks even with very low porosities, and can cause widespread metasomatism of the upper mantle. In the present study, we have shown that one important aspect of carbonation or CO2 outgassing of the upper mantle due to metasomatism by carbonatitic melt is the formation of magnesite. It is envisaged that CO2 derived from the metasomatic carbonatitic fluid becomes entrapped within the lithospheric mantle by reacting with peridotite. This reaction forms magnesite or Fe-rich magnesite.
6. Conclusions
The presence of forsterite xenocryst within carbonatite of Sung Valley UACC suggests the interaction of peridotitic lithosphere with plume-derived carbonatitic magma.
Petrographic and mineral chemistry data suggest the dissolution of olivine from lithospheric peridotite by carbonatitic magma and reprecipitation of forsterite.
CO2 and H2O from the carbonatitic magma penetrated the forsterite xenocryst and formed magnesite and siderite when the forsterite was in the carbonatite magma.
We suggest that, by formation of carbonates in the peridotitic lithosphere during carbonate magmatism, a considerable amount of mantle-derived CO2 can become entrapped within the lithosphere.
Acknowledgement
The Director of WIHG is thanked for encouragement and support. Drs Rajesh Sharma (WIHG) and Bhanu Pratap (NPL) are thanked for help and suggestions regarding Raman spectroscopy. We thank NV Chalapathi Rao and Dinesh Pandit, Department of Geology, Banaras Hindu University (BHU) for carrying out the electron probe microanalyses under the DST-FIST and DST-PURSE sponsored programme. Sakshi Maurya is thanked for stable isotope analysis. AK Singh is thanked for help and suggestions regarding ICP-MS analysis. The authors take full responsibility for all the data and their interpretations. We thank the editor, Kathryn Goodenough, and two anonymous reviewers for thorough and constructive reviews. This work is part of the doctoral thesis of SC on the Sung Valley UACC, Meghalaya, India.