Introduction
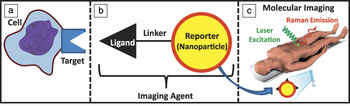
Molecular imaging scans living subjects (rodents, primates, humans) and utilizes electromagnetic (e.g., near infrared light) or acoustic signals to study gene expression or protein levels in deep tissues.Reference James and Gambhir1,Reference Weissleder and Pittet2 Molecular imaging can measure oncogenesis (tumor growth), angiogenesis (blood vessel growth), and metabolism and is in contrast to traditional imaging modalities that image only anatomy. For example, computed tomography (CT) is a traditional anatomic technique that can image bone, tissue, and tumors, but it does not indicate the biological activity of the tissue. In contrast, positron emission tomography (PET) with 18F-2-fluoro-2-deoxyglucose is a molecular imaging modality that produces a map of glucose metabolism. Molecular imaging experiments typically use injected molecules known as imaging agents or molecular probes. Such an imaging agent translates the biology into an imaging signal; a schematic of such a probe is shown in Figure 1. Here, the probe acts as an interface between the biology under study and the imaging equipment used to collect data and create images.
Molecular imaging produces quantitative representations of (a) biological features via (b) imaging agents. For surface-enhanced Raman spectroscopy, these agents consist of a chemically linked reporter (nanoparticle) and a targeting component (ligand). The ligand concentrates the imaging agent at the site of biological interest, while the reporter component works in tandem with (c) molecular imaging hardware and software to create an image. In (b), the yellow sphere represents a gold nanoparticle, and the red outline represents a small molecule Raman dye adsorbed to the surface.

A wide variety of molecular imaging modalities have been reviewed.Reference James and Gambhir1 Magnetic resonance imaging (MRI), fluorescence/bioluminescence, ultrasound, PET, SPECT (single photon emission computed tomography), CT, PET/CT, and PET/MRI have all been employed for molecular imaging. PET and SPECT are perhaps the most evolved molecular imaging modalities and are the workhorses of molecular imaging. However, PET and most other molecular imaging modalities suffer from one common and significant limitation—the capacity to measure multiple imaging biomarkers concurrently (i.e., multiplexing). As the deep biological complexity of cancer and other diseases is further defined with genomics and proteomics, the ability to measure multiple biomarkers concurrently, in vivo, and with high temporal and spatial resolution will increasingly become a real need.
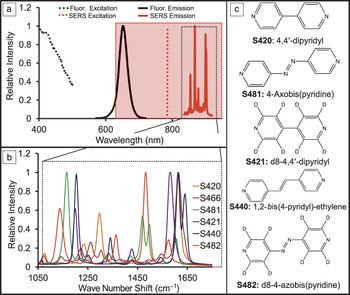
In PET, every imaging agent produces a signal with the same energy. When an emitted positron combines with an electron, it produces two 511 KeV gamma rays. Thus, PET is quantitative but cannot multiplex due to this limitation; it is a “black and white” technique, yielding no spectral data. While optical imaging with fluorophores and luminescent/fluorescent proteins offers more opportunities for multiplexing, these are realistically limited to, at most, 2–3 different color channels because of their broad emission profiles that are limited to the 680–900 nm range, where photons encounter the least resistance from hemoglobin, melanin, water, and other components of tissue. This area of the electromagnetic spectra is known as the “optical window” and is illustrated as the red-shaded box in Figure 2a. While the narrow emission spectra (30–60 nm full width at half maximum) of quantum dots has the potential to improve multiplexing,Reference Jokerst, Raamanathan, Christodoulides, Floriano, Pollard, Simmons, Wong, Gage, Furmaga and Redding3 this technology is usually limited by the toxicity concerns of these heavy metal-based probes and their relatively broad emission spectra (Figure 2a).
(a) The excitation (dotted line) and emission (solid line) spectra of Raman and fluorescence (from quantum dots [QDs]) are contrasted with the optical window (shaded red box). QDs require excitation in the visible and ultraviolet regions (outside the optical window); they also have relatively broad emission peaks, which limit multiplexing. In contrast, many different types of Raman labels can be excited with the same 785 nm laser, yet produce markedly different emission spectra based on differences in chemical structure (black dashed box). (b) Multiplexing with surface-enhanced Raman spectroscopy (SERS) shows that very different spectra are produced by changing the (c) small-molecule Raman dye. Importantly, the excitation source and underlying gold substrate remain the same. Even subtle changes from hydrogen (S420) to deuterium (S421) produce very different SERS spectra.

Raman spectroscopy is ideally suited for multiplexed molecular imaging because it produces highly detailed, “fingerprint” spectra that are characteristic of the molecule of interest. Raman spectroscopy utilizes the Raman effect—the inelastic molecular scattering of incident radiation.Reference Zavaleta, Kircher and Gambhir4 Raman scattering produces a unique spectra (Figure 2b) that is a function of the chemical bonds contained in the molecule of interest (Figure 2c). This molecule of interest can either be the actual protein/metabolite/nucleic acid of interest or it may be a secondary tag. Unfortunately, Raman scatter is very weak, with less than one in a million incident photons experiencing this effect. Nevertheless, many groups have used this intrinsic Raman signal and long acquisition times to glean biomedical content from specimens.Reference Shim, Wong Kee Song, Marcon and Wilson5,Reference Schmidt and Trentelman6
For Raman imaging of tissue deep in living animals, much more signal is needed than provided by a Raman dye alone. In the 1970s, Fleischman and Van Duyne reported that when the scattering molecule is placed on the surface of a roughened plasmonic substrate, the signal is increased by many log orders and is known as surface-enhanced Raman scattering (SERS)Reference Jeanmaire and Van Duyne7,Reference Fleischmann, Hendra and McQuillan8 (see the Introductory and Sharma et al. articles in this issue). SERS spectra are dependent on the concentration and identity of the small molecule. When mixtures of different small molecules are imaged, the relative contributions of individual components are determined through spectral un-mixing.Reference Van de Sompel, Garai, Zavaleta and Gambhir9 SERS also offers greater signal stability than fluorescence and femtomolar (fM) to picomolar (pM) sensitivity in vivo.Reference Zavaleta, Smith, Walton, Doering, Davis, Shojael, Natan and Gambhir10,Reference Keren, Zavaleta, Cheng, de la Zerda, Gheysens and Gambhir11 In this review, we detail how these features can be used in living subjects for Raman molecular imaging. While the use of SERS in tissue culture and microscopy is prevalent and interesting,Reference Willets12–Reference Vo-Dinh, Yan and Wabuyele14 our discussion here focuses on small animal models of human disease. We describe substrates used for Raman imaging, review published examples of Raman molecular imaging, and discuss needs and future directions of the field.
Substrates and materials
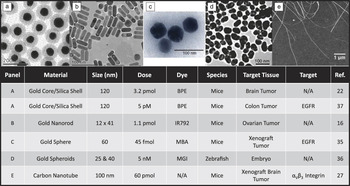
While a variety of metals have been shown to produce SERS, gold is most commonly used for Raman molecular imaging because it is biologically inert and chemically stable with very strong surface enhancement capabilities. In addition, it offers tunable plasmonic resonances in the optical window that are easily addressed by common laser systems. Gold has been transformed into a variety of forms, including nanorods,Reference von Maltzahn, Centrone, Park, Ramanathan, Sailor, Hatton and Bhatia15,Reference Jokerst, Cole, Van de Sompel and Gambhir16 nanoflowers,Reference Xie, Zhang, Lee and Wang17 nanosombreros,Reference Wi, Barnard, Wilson, Zhang, Tang, Brongersma and Wang18 nanostars,Reference Khoury and Vo-Dinh19 and others. However, the vast majority of these have been used only ex vivo for cell or tissue culture experiments. Figure 3a–d illustrates gold nanoparticles that have been used for in vivo molecular imaging. While silver substrates also offer significant SERS enhancement,Reference Orendorff, Gearheart, Jana and Murphy20 they require more blue-shifted excitation (outside of the optical window) and are less stable, and thus have been used to a lesser degree.
Different imaging agents used in Raman molecular imaging. (a) Core–shell nanoparticles, (b) nanorods, (c) nanospheres, (d) roughened spheroids, and (e) carbon nanotubes. The lower table plots the size and dose used to image various molecular imaging targets in different small animal models of human disease. N/A under “Target” indicates in vivo imaging of tumor or tumor boundaries without a biological ligand. BPE, 1,2-bis(4-pyridyl)-ethylene; IR792, IR-792 infrared laser dye; MBA, mercaptobenzoic acid; MGI, malachite green isothiocyanate; and EGFR, epidermal growth factor receptor. (c) Adapted with permission from Reference 35. © 2008 Nature Publishing Group. (d) Adapted with permission from Reference 36. © 2009 American Chemical Society. (e) Reprinted with permission from Reference 70. © 2005 National Academy of Sciences.

Due to the high ionic strength and protein content of serum and tissue, the SERS intensity of gold nanoparticles can sometimes radically change in vivo. Interestingly, the signal in biological media can actually increase due to nanoparticle aggregation,Reference Jokerst, Cole, Van de Sompel and Gambhir16 resulting in the formation of “hot spots” between nanoparticles that increase the signal even more than individual nanoparticles (see the article by Sharma et al.).Reference Stranahan, Titus and Willets21 Nevertheless, such aggregation is currently nonspecific and unpredictable and is a significant error source for experiments in which SERS intensity corresponds to a biomarker. Thus, a silica coat on the surface of gold nanoparticles has been employedReference Zavaleta, Smith, Walton, Doering, Davis, Shojael, Natan and Gambhir10,Reference Keren, Zavaleta, Cheng, de la Zerda, Gheysens and Gambhir11,Reference Kircher, de la Zerda, Jokerst, Zavaleta, Kempen, Mittra, Pitter, Huang, Campos and Habte22–Reference Chen, Frey, Kim, Homan, Kruizinga, Sokolov and Emelianov26 to protect and stabilize the imaging component of the hybrid nanoparticle. This produces an imaging agent that is stable in a variety of diluents and matrices with no changes to the SERS spectral signature. The silica thickness and porosity are tunable to control diffusion kinetics while sequestering the metal cores from any exterior reaction. This approach also provides reactive sites for biological targeting ligands on the silica surface through grafting of amino- or mercapto-trimethoxysilanes on the surface of the silica shell.
Carbon nanotubes (CNTs)Reference Zavaleta, De La Zerda, Liu, Keren, Cheng, Schipper, Chen, Dai and Gambhir27,Reference Liu, Davis, Cai, He, Chen and Dai28 produce strong Raman signals due to their one-dimensional confinement of electronic statesReference Dresselhaus, Dresselhaus, Saito and Jorio29 and can also be used for Raman imaging. Like small molecules, CNTs can be used with or without the surface enhancement of a metallic substrate. Raman multiplexing with carbon nanotubes occurs not via different small molecules on the surface of the nanoparticle, but rather by differences in the nanotube backbone induced by C13 doping that change the Raman signature of the nanotubes themselves.Reference Liu, Li, Tabakman, Jiang, Fan and Dai30 Although some groups have shown toxicity concerns with CNTs,Reference Lam, James, McCluskey and Hunter31 a meta-analysis of the literatureReference Kostarelos, Bianco and Prato32 and our own detailed studiesReference Schipper, Nakayama-Ratchford, Davis, Kam, Chu, Liu, Sun, Dai and Gambhir33 indicate that toxicity is highly dependent on the dose, route of administration, aspect ratio, and passivation chemistry of the nanotubes, and that they cannot be ruled out as molecular imaging agents.
Applications
Deep tissue imaging in small animals has taken two general routes: passive accumulation and active targeting. Our group filed the first patent on Raman imaging in 2007,Reference Gambhir34 and later reported multiplexed liver imaging with SERS nanoparticles via passive targeting (i.e., without a targeting ligand) through the reticuloendothelial system.Reference Zavaleta, Smith, Walton, Doering, Davis, Shojael, Natan and Gambhir10,Reference Keren, Zavaleta, Cheng, de la Zerda, Gheysens and Gambhir11 We later reported passive accumulation in ovarian tumors through the enhanced permeation and retention (EPR) effect, or the natural tendency for nanoparticles to accumulate in tumor tissue. Other groups report active targeting of SERS nanoparticles to tumors.Reference Qian, Peng, Ansari, Yin-Goen, Chen, Shin, Yang, Young, Wang and Nie35 This work used gold nanoparticles targeted to the epidermal growth factor receptor (EGFR) via a single chain variable fragment from a monoclonal antibody. The authors could then correlate the Raman signal to the presence of the EGFR target. Lower SERS signals from controls with untargeted nanoparticles provided evidence of true targeting to EGFR. However, no images were actually formed, and these tumors were quite proximal to the liver, which could potentially contribute to the background. SERS imaging has also been used for anatomic imaging of zebrafish embryos to monitor development.Reference Wang, Seebald, Szeto, Irudayaraj and Willets36 Ongoing work is evaluating the synergistic roles that EPR and active accumulation via targeting ligands play in performing Raman imaging.
Despite the amplified signal resulting from the use of a SERS substrate, image formation is still limited by tissue attenuation relative to other molecular imaging modalities such as PET and ultrasound. Thus, many applications use the SERS signal for surface-weighted imaging such as endoscopy or intra-operative imaging. These approaches eliminate the tissue scattering and absorption that can hamper deep tissue SERS.Reference Jokerst, Cole, Van de Sompel and Gambhir16,Reference Kircher, de la Zerda, Jokerst, Zavaleta, Kempen, Mittra, Pitter, Huang, Campos and Habte22
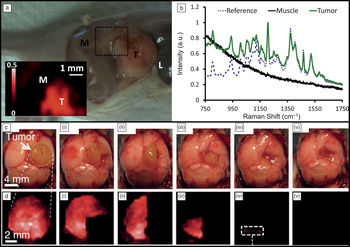
The surgical removal of tumors in both ovarianReference Jokerst, Cole, Van de Sompel and Gambhir16 and brainReference Kircher, de la Zerda, Jokerst, Zavaleta, Kempen, Mittra, Pitter, Huang, Campos and Habte22 tumor cancer models after passive accumulation has been shown with SERS-guided imaging (Figure 4). The results indicate that the accumulation of nanoparticles is unique to the tumor due to the EPR effect, with levels in blood that return to baseline after approximately 24 hours.Reference Jokerst, Cole, Van de Sompel and Gambhir16 The SERS signal not only identified tumor margins to prevent excision of normal tissue, but also could identify any residual tumor remaining in the tumor bed. This scheme was particularly effective for resection of glioblastoma (a malignant brain cancer). Here, after visual inspection, all tumors had been removed (Figure 4c-iv). However, examination with SERS imaging indicates trace amounts of signal (Figure 4d-iv; dashed box). This small tissue section was subsequently removed and found to indeed contain cancer cells tagged with SERS nanoparticles.
In vivo imaging. (a) A mouse xenograft ovarian tumor (T) next to muscle (M) and liver (L). This animal was intravenously injected with 200 µL of 5.4 nM surface-enhanced Raman spectroscopy (SERS) gold nanorods. Twenty-four hours later, the skin was removed and the tumor analyzed for SERS signal. (b) The spectrum at each point was raster scanned and compared to a reference spectrum of gold nanorods before injection. At each point, dynamic least squares analysis indicated the similarity between the reference spectrum and the sample spectrum—more similar spectra produce brighter pixels on the Raman map. The color scale shows the degree of dynamic least squares correlation, where 1 is a perfect match between the pixel and reference spectrum, and 0 is no match. This map highlights the use of SERS to indicate tumor margins. (c) In a model of glioblastoma brain cancer, the tumor was imaged in exposed brain similar to human tumor resection. The SERS signal (d)–(d-v) decreases as the tumor is surgically removed (c)–(c-v). The picomolar sensitivity of SERS allowed microscopic foci of the tumor (invisible to visual inspection) to be detected and removed (d-iv). (a and b) Reprinted with permission from Reference 16. © 2012 American Chemical Society. (c and d) Reprinted with permission from Reference 22. © 2012 Nature Publishing Group.

Needs and future work
Ongoing research efforts focus on both chemical and instrumental approaches to increasing the Raman signal while avoiding interference from the fluorescence background. In addition to intra-operative imaging, endoscopic tools are under development for applications in deep tissue imaging.Reference Jokerst, Miao, Zavaleta, Cheng and Gambhir37 An alternative approach to deep tissue imaging is surface-enhanced, spatially offset Raman spectroscopy, where the excitation and collection optics are arranged 180 degrees from each other.Reference Stone, Kerssens, Lloyd, Faulds, Graham and Matousek38 This approach could detect Raman signals through up to 50 mm of tissue—a value which is nearly clinical reality.Reference Stone, Kerssens, Lloyd, Faulds, Graham and Matousek38 Others improvements to data collection hardware include the Spectro Pen,Reference Mohs, Mancini, Singhal, Provenzale, Leyland-Jones, Wang and Nie39 which is a handheld device able to quickly collect both endogenous Raman and SERS spectra, and wide-field,Reference Bowden, Gardiner, Rice and Gerrard40 line-scanning systems. Tomographic SERS imaging has been reportedReference Schulmerich, Cole, Dooley, Morris, Kreider, Goldstein, Srinivasan and Pogue41 but has not yet been performed in living systems.
Two variations of Raman imaging offer significant advantages. Tip-enhanced Raman scattering (TERS) positions a SERS active probe (tip) in close proximity to the molecules of interest within the laser focusReference Stöckle, Suh, Deckert and Zenobi42–Reference Demming, Festy and Richards44 (see the Sharma et al. article in this issue). In contrast to SERS, where quantity and the spatial distribution of the sample-metal interactions are hard to predict,Reference Kelly, Coronado, Zhao and Schatz45,Reference Camden, Dieringer, Wang, Masiello, Marks, Schatz and Van Duyne46 TERS provides Raman enhancement of the sample molecules at a spatial accuracy within the nanometer scale.Reference Steidtner and Pettinger47 The potential of TERS as a super resolution microspectroscopy tool has been demonstrated for biomolecular imaging, including bacteria cell walls,Reference Budich, Neugebauer, Popp and Deckert48 DNA bases,Reference Rasmussen and Deckert49 fluorophores,Reference Yeo, Maedler, Schmid, Zhang and Zenobi50 and single strands of RNA.Reference Bailo and Deckert51 However, the required experimental setup combines equipment from Raman spectroscopy and atomic force microscopy and remains challenging,Reference Budich, Neugebauer, Popp and Deckert48 which may limit future in vivo applications.
Coherent anti-stokes Raman scattering (CARS) and stimulated Raman scattering (SRS) are nonlinear four wave mixing techniques that require coherent electrical fields of high intensity and provide strong signals without additional SERS agents.Reference El-Diasty52–Reference Maker and Terhune55 Three ultrashort laser pulses designated pump, stokes, and probe coherently interact in the focal volume. If the frequency mismatch between pump and stokes matches the molecule’s Raman transition, a CARS signal is produced with intensity orders of magnitude higher than during linear experiments,Reference Volkmer56 with obvious applications to biomedical studies.Reference Pohling, Buckup, Pagenstecher and Motzkus57 In parallel, the stokes and pump beams show small alterations of intensity, and detection of those effects gives rise to the contrast mechanism of SRS. CARS offers spectral information blue-shifted with respect to the excitation light—critical because this area is not confounded by first-order auto-fluorescence of the sample. Unfortunately, due to interference with non-resonant signals and phase matching conditions between the interacting electric fields, CARS techniques suffer from distorted lines, nonlinearity between signal intensity and concentration, and anisotropic distributions of the scattered signal.Reference Lotem, Lynch and Bloembergen58,Reference Cheng, Volkmer and Xie59 SRS is theoretically free of those drawbacksReference Volkmer60 and has also been used in recent studies of biomedical imaging.Reference Freudiger, Min, Saar, Lu, Holtom, He, Tsai, Kang and Xie61,Reference Saar, Freudiger, Reichman, Stanley, Holtom and Xie62
Given the enormous potential of both SERS and coherent Raman techniques for molecular imaging applications with strong Raman signal enhancement, their combination is a highly promising topic for future research.Reference Chew, Wang and Kerker63 Recently, first studies have already demonstrated a constructive addition of the advantages provided by each method.Reference Steuwea, Kaminski, Baumberg, Mahajana, Vo-Dinh and Lakowicz64,Reference Furusawa, Hayazawa, Catalan, Okamoto and Kawata65
When developing a SERS imaging agent, the potential toxicity needs to be considered. However, previous studies on gold core/silica shell nanoparticlesReference Thakor, Paulmurugan, Kempen, Zavaleta, Sinclair, Massoud and Gambhir66,Reference Thakor, Luong, Paulmurugan, Lin, Kempen, Zavaleta, Chu, Massoud, Sinclair and Gambhir67 and carbon nanotubesReference Schipper, Nakayama-Ratchford, Davis, Kam, Chu, Liu, Sun, Dai and Gambhir33 have shown only minor oxidative stress to cells. Full toxicity studies are needed for each unique imaging agent as it progresses through the chain to clinical development. Furthermore, any developments to increase tumor accumulation versus the liver and spleen accumulation typical of intravenous administration of nanoparticles would be helpful. The multiplexing capabilities of SERS imaging are currently underutilized due to the lack of biological targets with clinical sensitivity and specificity. Activatable probes similar to those used in optical emission imaging would be especially interesting.Reference Nguyen, Olson, Aguilera, Jiang, Scadeng, Ellies and Tsien68,Reference Levi, Kothapalli, Ma, Hartman, Khuri-Yakub and Gambhir69
Conclusion
Despite the opportunities presented by surface-enhanced Raman spectroscopy (SERS), there remain only a handful of examples of using this modality in small animal models of human disease. We suspect that a combination of improved imaging agents, improved imaging equipment, and improved imaging analysis software will facilitate greater utilization of this modality. Just as charge-coupled device technology and reporter genes changed optical imaging from microscopy to in vivo studies, so too will these new advances improve the field of SERS imaging.
Acknowledgments
This work is funded, in part, by the NCI U54CA119367 (SSG), P50CA114747 (SSG), the Canary Foundation (SSG), and the Ben and Catherine Ivy Foundation (SSG). J.V.J. is grateful for support from the Stanford Molecular Imaging Scholars Program R25-TCA118681 and the Burroughs Wellcome Fund. J.J. was supported by a Postdoctoral Fellowship, PF-13–098–01—CCE from the American Cancer Society.