


Introduction
Snow avalanches have been measured and observed in the Shiai valley, Kurobe, Japan, since 1989. Though there are partial data on the internal velocity distribution for both dense and powder parts (Reference GublerGubler, 1987; Reference Kawada, Nishimura and MaenoKawada and others, 1989; Reference Nishimura, Narita, Maeno and KawadaNishimura and others, 1989, Reference Nishimura, Maeno, Kawada and Izumi1993b; Reference Dent, Adams, Bailey, Jazbutis and SchmidtDent and others, 1995; Reference Nishimura and ItoNishimura and Ito, 1997), the data are insufficient to constrain and discriminate between current avalanche models (for a survey of current models see Reference HarbitzHarbitz, 1999), and thus insufficient to allow a quantitative understanding of the dynamics and internal structure of snow avalanches. The poor quality of the data is due to the unpredictability, scarcity and intense destructive power of avalanches.
Avalanches can be modelled in the laboratory using granular materials on inclined planes, usually in water for powder avalanches (Reference Tochon-Danguy and HopfingerTochon-Danguy and Hopfinger, 1975; Reference Hopfinger and Tochon-DanguyHopfinger and Tochon-Danguy, 1977; Reference Beghin and BrugnotBeghin and Brugnot, 1983; Reference Hermann, Hermann and HutterHermann and others, 1987; Reference Beghin and OlagneBeghin and Olagne, 1991; Reference KellerKeller, 1995) or in air for dense avalanches (Reference HutterHutter, 1991; Reference Greve and HutterGreve and Hutter, 1993; Reference Nishimura, Kosugi and NakagawaNishimura and others, 1993a; Reference Greve, Koch and HutterGreve and others, 1994; Reference Hutter, Koch, Pluss and SavageHutter and others, 1995; Reference Gray, Wieland and HutterGray and others, 1999; Reference Wieland, Gray and HutterWieland and others, 1999). Laboratory experiments are much easier to perform than field experiments and are usually easily repeatable. However, the small size of the granular particles used makes direct observation of individual particles difficult, and only a few similarity parameters are typically satisfied (Reference KellerKeller, 1995). For example, no laboratory experiments have yet been carried out in which a dense granular flow becomes a turbulent suspension by entraining the ambient fluid, though in some experiments (Reference Rzadkiewicz, Mariotti and HeinrichRzadkiewicz and others, 1997) a small number of the grains may enter suspension. Instead experimental models of powder-snow models in water tanks use a denser fluid or a premixed turbulent suspension. Laboratory granular flows also rarely exhibit the complex three-dimensional structure which is characteristic of avalanches and other large geophysical flows. For these reasons for the last 5 years large-scale granular flow experiments have been carried out using golf balls and ping-pong balls. The first experiments were carried out on long (20–30 m) chutes and more recently on the Miyanomori ski jump (the normal hill for the 1972 Olympics) in Sapporo, Japan. Ping-pong balls are particularly suitable, since they reach terminal velocity in only a few metres, so fully developed flows occur even on short slopes. These experiments have been described in several papers (Reference Nishimura, Nohguchi, Ito and KosugiNishimura and others, 1997,Reference Nishimura, Keller, McElwaine and Nohguchi1998; Reference Keller, Ito and NishimuraKeller and others, 1998).
The aim of these experiments is to elucidate the dynamics of two-phase granular flows rather than to directly extrapolate the results to snow avalanches. The experiments provide detailed data and insights on the physically significant dynamical processes controlling avalanches. The hope is that this will lead to a theory of snow avalanches based on physical processes with no free parameters.
The kinetic theory of granular matter provides only poor agreement with experiments (Reference HaffHaff, 1983; Reference Jenkins and SavageJenkins and Savage, 1983; Reference Lun, Savage, Jeffrey and ChepurniyLunn and others, 1984; Reference Jenkins and RichmanJenkins and Richman, 1988; Reference Johnson, Nott and JacksonJohnson and others, 1990; Reference Anderson and JacksonAnderson and Jackson, 1992; Reference Hutter and RajagopalHutter and Rajagopal, 1994; Reference JenkinsJenkins, 1994), but does provide a theoretical framework for discussing stresses in granular flows. Another approach is the direct simulation of granular flows using the discrete-element method (Reference Campbell and BrennenCampbell and Brennen, 1985; Reference Campbell and GongCampbell and Gong, 1986; Reference Cleary and CampbellCleary and Campbell, 1993; Reference Campbell, Cleary and HopkinsCampbell and others, 1995; Reference Hanes, Walton, Zakirov, Locurto, Bucklin, Begringer and JenkinsHanes and others, 1997; Reference Herrmann and LudingHermann and Luding, 1998). These simulations have increased the understanding of granular flows, including two-phase flows, but these simulations have not yet accurately dealt with particles strongly coupled to fluids or three-dimensional anisotropic flows.
The ping-pong ball avalanches can be described by well-known equations. The airflow obeys the Navier-Stokes equations, and individual ping-pong balls follow Newton’s law, whereby the force on a particle is a function of gravity, particle-particle contacts, particle-ground contacts and air drag. The no-slip boundary condition between particles and the airflow determine the drag force. For small numbers of particles at low Reynolds numbers in closed domains these equations can be directly solved (Reference Glowinski, Pan, Periaux and WhitemanGlowinski and others, 1996; Reference HuHu, 1996; Reference Blackmore, Samulyak and RosatoBlackmore and others, 1999), but this is currently impossible for this experiment, because of the large number of particles and the large range of length and time-scales. Particle-particle collisions occur over time intervals of order of 10–3 s, whereas the duration of the flow in these experiments is around 30 s. The length scales in these experiments are given by the length of the ski jump (160 m), the volume of the flow
 , the diameter of the balls (0.038 m) and the compression of the balls during collisions (10–3 m).
This paper discusses two complementary approaches for describing the experiments. The first is to consider the flow as a single object moving down the skijump and to use similarity arguments to deduce gross features of the flow. The second approach is to use two-phase flow equations that couple the Navier-Stokes equation for the airflow to the kinetic theory equations for the ball flow using an (empirical) drag force.
Experiment
The experiments were undertaken at the Miyanomori ski jump. The landing slope was 160 m long and 60 m high (Fig. 1) and covered with an artificial surface. Standard ping-pong balls, with a diameter of 38 mm and mass of 2.48 g per ball, were placed in a large box, 15 m (30 m in 1996) along from the top of the landing slope. Flow was initiated by opening the hinged door on the front of the box. The balls then flowed down the slope and past the measurement sensors which were all placed near the middle of the slope 100 m down from the top (83 m from the front of the box). The experimental procedure is described in more detail in Reference Nishimura, Nohguchi, Ito and KosugiNishimura and others (1997).
Cross-section of the landing slope of the Miyanomori ski jump. Marked distances are measured from the top of the landing slope.

Ball measurements
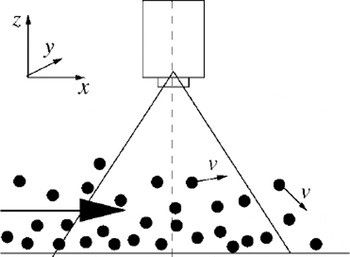
A video camera was set pointing perpendicularly down at the slope (Fig. 2) at a height of 0.82 m. Balls closer to the lens of the camera appear larger than those which are further away. Thus the z coordinate of a ball can be calculated by measuring the size of a ball in the video picture, since all the balls have the same diameter. The x and y coordinates of a ball are given directly by its position in the video frame. Comparing positions for the same ball from adjacent video fields gives the three-dimensional velocity of a ball (time-averaged over the 1/60 s between video fields.) The necessary camera corrections and detailed method are described in Reference Keller, Ito and NishimuraKeller and others (1998).
Schematic of the video camera for measuring ball positions.
Air measurements
Measuring air velocity in particulate flows is very difficult. In snow avalanches ordinary meteorological anemometers are inaccurate because of the snow particles, and are usually destroyed (Reference Kawada, Nishimura and MaenoKawada and others, 1989; Reference Nishimura, Narita, Maeno and KawadaNishimura and others, 1989). Reference Nishimura and ItoNishimura and Ito (1997) and Reference Nishimura, Nohguchi, Ito and KosugiNishimura and others (1997) have developed the use of pressure measurements (sampling frequency 1 KHz) for inferring air speed. A tube connected to a pressure-difference sensor is set so that the open end points downwards, perpendicular to the main flow direction (Fig. 3). Note that this is not a Pitot tube since each tube has only one opening and the pressure difference is measured with respect to the air pressure some distance from the flow. Bernoulli’s law then gives

where Δp is the pressure difference, ρa is the air density and v is the air speed parallel to the slope. However, this equation is only valid when the airflow is perpendicular to the end of the pipe and the local static pressure is known. Also the sensor itself disturbs the flow. The Reynolds number for the flow around the tube is approximately 10 000 (wind speed 10 m s–1, tube diameter 0.01 m), so the flow will be partially turbulent around the sensor. The interaction of the pressure sensor with the flow, coupled with the rapid pressure fluctuations as a result of the turbulent flow field, would lead to inaccurate measurements if solely based on Equation (1). Therefore the pressure tubes were calibrated by measuring the static pressure depression in a wind tunnel over a range of velocities. Four of these air-pressure sensors were placed 100 m down the slope at heights of 0.01, 0.15, 0.3 and 0.45 m.
Schematic of the air-pressure sensors.

Front position
Several video cameras were placed to the side and at the bottom of the slope. As can be seen in Figure 4 the leading edge of the avalanche is clearly visible. The position of the front was measured and used to calculate the front velocity.
Front view of a 550 000 ball avalanche at the Miyanomori ski jump. The horizontal lines are 5 m apart and the lowest one is 90 m from the top of the landing slope.

Results
When the door of the box was opened, the balls at the front of the box rapidly accelerated down the slope (Figs 4 and 5). The front velocity was much larger than the tail velocity (the last balls took several seconds to leave the box). For a 550 000 ball flow, the front of the flow accelerated approximately linearly with distance until it reached a speed of 18 m s-1 after 65 m, whereas the balls in the tail had a speed of only a few metres per second, similar to the speed of a single ball. The front velocity was roughly constant for the next 30 m until the slope angle started to decrease. This large disparity in speed between head and tail caused the flow to elongate so much that at times it covered more than half the slope. The flows can be separated into three distinct regions: a short, high, fast-moving head; a longer, lower body moving at the same speed; and a very long tail moving much slower, consisting of separated balls.
Side view of the head of a 550 000 ball avalanche at the Miyanomori ski jump

Other macroscopic features of the flow are interesting, but hard to quantify. At the beginning of the flow there are often several waves within the flow which move faster than the body and coalesce in the head (Reference Nishimura, Keller, McElwaine and NohguchiNishimura and others, 1998). Obvious features are two roughly circular regions of reduced flow height, symmetrically located about the flow centre line, a little behind the head, called “eyes” after Reference Nohguchi, Izumi, Nakamura and SackNohguchi and others (1997). They can be seen on the third line up from the bottom of Figure 4 as the darker regions. Similar patterns have been reported in laboratory granular-flow experiments with styrene foam particles (Reference Nohguchi, Ozawa and NishimuraNohguchi, 1997) and with ice particles (personal communication from Y. Nohguchi, 1998). In these experiments the particles are approximately 1mm in diameter and the flows contain 1000–100 000 particles. For such a feature to exist in experiments of such different scales suggests that the mean velocity fields and flow structure are similar in all these experiments. The “eyes” may represent a pair of vortices shed by the head, but only a detailed quantitative analysis of ball velocities can confirm this. In the tail the balls are not distributed evenly but tend to cluster, because of inelastic collapse.Footnote *
Front velocity
In Reference Nohguchi, Ozawa and NishimuraNohguchi (1997), granular-flow experiments with styrene particles were performed and the front velocity was observed to increase with the number of balls. Similar increases were observed in these experiments. Reference Nohguchi, Ozawa and NishimuraNohguchi (1997) deduced that the maximum front velocities, u, for flows which vary only in the number of balls, N, should scale according to

In order to derive Equation (2), the drag force was assumed to be a linear function of the flow velocity. However, the result can be obtained without this assumption as follows:
The critical assumption is that there is only one significant length scale given by

where V is the volume of all the balls and d is the ball diameter. The implied constant of proportionality in Equation (3) is constant between experiments with different numbers of balls, but is not constant along the slope, i.e. the height and width of the flow at any given position (a;) scales with the number of balls. Equation (3) will not be true initially when the input box size is important, nor will it be true where the flow is only a few balls thick. However, all the flows with more than ≈ 10 000 balls are observed rapidly to reach a self-similar shape in about 10 m, and the flows are many particle diameters thick except in the tail.
The effective gravitational acceleration in the downslope direction of the flow is g* = g(1 − pa/pb) where 9 is the angle of the slope, μ is the coefficient of friction with the slope, g is the acceleration due to gravity, and ρa and ρb are the air and ball densities, respectively. After the initial surge from the box the flow is close to its equilibrium velocity, i.e. it is accelerating/decelerating slowly, so inertia can be ignored. The Reynolds number for the airflow is of the order 106, so air viscosity can be ignored. Under the length-scale assumption in Equation (3) the non-dimensional density ratio ρaV/(Nm), where m is the mass of a single ball, is constant for different-sized flows since V oc N. Therefore air density ρa need not be further considered as a dimensional variable since it can be substituted by m/L3. The dependence on the box size and ball diameter has already been discussed, which leaves only three variables g*, L and u. Thus the only dimensionless combination that can be formed containing the front velocity is the densiometric Froude number
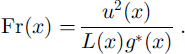
This must be contrast for different flows, and thus

since L α N1/3.
In Reference Nishimura, Keller, McElwaine and NohguchiNishimura and others (1998) the front velocity was measured between the k point and the p point (where the slope angle, 36°, is roughly constant and steepest; see Fig. 1). The remarkably good fit between this equation and experiment is seen in Figure 6 and provides additional justification for Equation (3). As expected, the error is worse for flows with small particle numbers, since they rapidly spread into single ball thickness layers with two significant length scales dN1/2 (width and length) and d (height). The height is likely to be the significant length scale in this range, so for small flows we expect the velocities to be independent of flow size.
Front velocities at the k point for different-sized avalanches.

Flow structure and ball velocities
By analyzing the video film (Reference Keller, Ito and NishimuraKeller and others, 1998), individual particle positions can be calculated, and by identifying balls between adjacent video frames, particle velocities are obtained. Figure 7 shows the perpendicular positions, viewed from the side, and velocities for a 200 000 ball flow as the particles are advected beneath the camera. The time interval of one profile is 17 ms (1/60 s). This technique, however, cannot see through ping-pong balls, and in the dense head (volume fraction ≈ 0.2) only the balls from the top 0.2 m can be identified, so there is a blank region in Figure 7, marked “passage of head”, where there is no data.
Ball heights in a 200 000 ball avalanche calculated as the balls are advected beneath a fixed video camera. The lines show the ball trajectories from one field to the next.

If the structure of any feature in the flow of size I is changing slowly on the time-scale l/u, where u is the mean flow velocity, then we can regard these data as providing a cross-section through the flow in the direction of mean velocity, in this case down the slope. For Figure 7 the mean flow velocity is 15 m s–1, so 0.1 s corresponds to 1.5 m. The head of 1 m length, 0.4 m height, followed by a body of 0.2 m height is visible. The full flow (not shown in Fig. 7) has a body of approximately constant height (0.2 m) and length (10 m), followed by the tail of the flow which stretches back to the box and consists of separated balls.
The shape of the velocity profile in a steady shear flow is governed by the relative magnitude of the drag forces on the upper and lower surfaces, the body forces and the vertical transport rate of momentum. Figure 8 shows that the mean downslope (x) velocity of the balls decreases monotonically with height. There is no visible velocity reduction at the base, indicating that surface friction is unimportant. The mean velocity decreases slowly in the dense part of the flow by about 1 m s–1, and then very rapidly in the less dense top layer by a further 1–2 m s–1. This diffuse top layer of satiating balls moving along approximately parabolic trajectories is visible in Figures 5 and 7 and has been discussed in the literature (Reference Johnson, Nott and JacksonJohnson and others, 1990). This behaviour is characteristic of dilute energetic flows. In high-density flows, on the other hand, the top surface is well defined to within a particle diameter. The lower mean velocity of these satiating balls is easily explained by the extra air drag they experience since they move in regions of higher relative air velocity. The relative air velocity in the bulk of the flow must be much lower since the flows are in approximate equilibrium and move up to four times faster than the terminal velocity of an individual ball.
Vertical profile of ball downslope (x) velocity. The height and velocity of each data point are an average over 50 balls calculated from video camera measurements of the front and body.

The central part of the ski jump is composed of down-slope pointing bristles, and experiments with individual balls show that it is totally inelastic –– the balls bounce to no observable degree–– so that horizontal momentum cannot be converted to vertical momentum by collisions with the slope, but only in collisions with other balls. Since vertical motion will rapidly decay through ground collisions, a priori one might have expected a high-density flow where the balls are in continuous contact with very small fluctuation velocities. This is indeed what happens initially when the balls slump out of the box. However, this dense-flow state is unstable, and, as the flow accelerates, the velocity fluctuations increase and the density decreases.
The kinetic theory of granular matter follows that of gases and describes a system by a particle distribution function f, where f(c, x, t) dc dx is the number of particles with velocity c and range dc that are centred at x and range dx at time t. The number density n(x, f) is the integral of / over all velocities and the volume fraction φ(x, t) = n(x, t)πd3/6. The mean value of any particle property (c,x,t) is defined as

The mean velocity field u(x,i) is thus (c), the fluctuation velocity C = c – u and the second moment of the fluctuation velocity K(x, t) = (CC). The granular temperature T(x, t) l/3(KXX + Kyy ,) is the isotropic component of K. The stress tensor (sometimes referred to as the pressure tensor (Reference Jenkins and SavageJenkins and Savage, 1983)) for a granular flow is

where ρb is the ball density, m is particle mass and (-)[C] denotes the collisional transport of velocity fluctuation. The notation follows Reference Jenkins and RichmanJenkins and Richman (1988), where it is shown that in dilute flows the collisional transport term can be ignored. The dilute approximation consists of retaining only terms that are constant or linear with respect to volume fraction φ and is valid when the strength of mean shear relative to velocity fluctuations is small. This approximation is assumed valid for the rest of the paper.
The square root of the diagonal elements of K are the velocity standard deviations along the coordinate axis and are shown in Figure 9. The standard deviation is taken over each video field. This shows that the perpendicular (Kzz), and cross-slope (Kyy) velocity deviations are roughly similar in the head and the body, 1.5 and 0.5 m s∼\ respectively. However, the downslope (Kxx) is low initially, then increases rapidly in the head to reach a maximum of 2.5 ms–1 before decaying to a nearly constant 0.5 ms–1 in the body. The results are similar for other flows.
Ball velocity standard deviation for a 300 000 ball experiment. (Data have been smoothed.)

Kinetic theories (Reference Lun, Savage, Jeffrey and ChepurniyLunn and others, 1984; Reference Anderson and JacksonAnderson and Jackson, 1992) of granular matter often postulate that K is isotropic, i.e. the diagonal stresses Kxx, Kyy and Kzz are identical and the off-diagonal stresses are zero. This is clearly not the case for these flows. Figure 9 shows that the diagonal elements of K are never equal. Since K is symmetric and positive definite it can be decomposed into its principal stresses (eigenvalues) and principal axes (eigenvectors). The rotation of the principal axes away from the coordinate axes (θX, θy, θZ) is shown in Figure 10. The large rotation of the principal axes in the head is clearly visible, in contrast to the much smaller rotation in the body. On symmetry grounds one would expect 9y to be identically zero if the measurements had been taken along the centre line of the flow, but since the measurements were taken slightly to the side the results are not surprising. The large rotations 0X and 0y and small rotation 9Z suggest a shearing motion in the plane of the slope but no vertical shearing. These data are consistent with video footage in which horizontal velocity structure is visible, and with Figure 8 which shows that there is no appreciable vertical shearing.
Rotation angles of the principal axes of the granular stress tensor for a 300 000 hall experiment. (Data have been smoothed.)

In the case of steady and uniform flow, the mean velocity must be constant and the momentum equation for the flow is

where p is the air pressure, g is gravity and f is the drag force from the air on the balls (Reference Jenkins, Hermann, Hovi and LudingJenkins, 1987). For a free surface to be steady and clearly delineated there is a kinematic constraint that n-Kn vanishes on the surface, where n is the surface normal. That is to say, as well as the mean velocity vanishing normal to the surface, so must the velocity fluctuation. This term, if non-zero, would result in a diffusion outward from the surface of the volume fraction φ. The top surface, in contrast, is diffuse, φ slowly decreases with z, and such a condition is not satisfied. Figure 5 shows that the front is indeed very clearly defined, which requires that Kxx = 0. Since K is calculated from averages over two video fields, the value at the front is not known, but extrapolating the curve makes it plausible that Kxx is indeed zero (Fig. 9).
There is also a dynamical requirement given by Equation (8) that the forces on the front should balance.

Unfortunately only a dozen balls or so in each video frame can be identified, which does not provide enough data to calculate y and z derivatives unless averaged over the whole length of the flow. Assuming that the only z dependence of stress is that required to counteract gravity, the ∂/∂z terms can be dropped. The ∂/∂y terms should be zero on the centre line (y = 0) of the flow and can also also be dropped. The equation is then

and can be integrated if/, is known to provide a variant of Bernoulli’s law. We will return to this equation after a discussion of the air-pressure data.
Pressure measurements
Although in the general case of flow past bodies of arbitrary form the actual flow pattern bears almost no relation to the pattern of potential flow, for streamlined shapes the flow may differ very little from potential flow; more precisely, it will be potential flow except in a thin layer of fluid at the surface of the body and in a relatively narrow wake behind the body (Reference Landau and LifshitzLandau and Lifshitz, 1987). In particular, in front of the avalanche head the flow will be irrotational since the Reynolds number is very high (for length 1 m and velocity 10 m s–1, one has Re * 106). A simple approximation is to assume that the flow field is that of irrotational flow around a sphere where the sphere represents the head of the gravity current (cf Fig. 7) in a stationary frame. The flow field has the required symmetries since it is symmetric about the cross-stream (y = 0) plane and, if the influence of the ground on the airflow is assumed to be small, the flow field can be reflected in the perpendicular (z=0) plane.
A similar approach to the ambient flow around gravity currents was pioneered by Reference Von Karmanvon Karman (1940). He considered the local flow around where the head meets the ground and used this to deduce the head angle (60°). This is accurate over distances small compared to the head height. Similar ideas were also discussed in Reference HamptonHampton (1972), but he considered the ambient flow around semi-infinite debris flows, so his approach is correct over scales large compared to the head height but small compared to the flow length. In contrast, the approach in this paper is equivalent to retaining the first three terms (up to the dipole) in a multi-pole expansion and is therefore asymptotically correct.
To apply Bernoulli’s theorem it is most convenient to work in a frame in which the flow field can be approximated as steady. This is true in a frame moving with the same velocity as the avalanche head since the slope angle changes slowly. The velocity distribution around a stationary sphere of radius R in a flow field moving with constant velocity v at infinity is

Using Bernoulli’s theorem the corresponding pressure distribution is

where x cos 0 = x • v. Regarding the pressure sensors as fixed on the centre line, the data are not of sufficiently high quality to warrant a more complicated approach, then x(i) = v(R/v – t), where t = 0 is taken as the time when the front reaches the sensor. The output from a pressure sensor is then

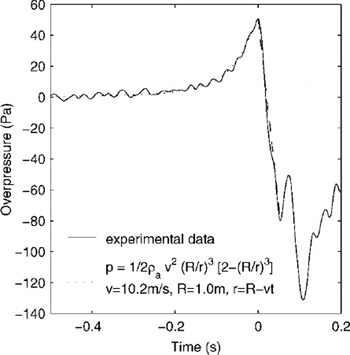
Figure 11 shows the result of fitting this curve to the data from one of the sensors. The equation has three free parameters: the impact time, which is taken as the point of highest pressure, the effective radius R, and the effective velocity v. The pressure data were sampled at 1000 Hz and passed through a 4 ms width Gaussian filter, ρa was taken as 1.2 kg m–3 and an additional correction was applied after calibrating the sensors in the wind tunnel.
Static air-pressure change as the front of a 300 000 ball avalanche is advected past the sensor at height 0.3 m. The balls reached the sensor at t = 0, and for t < 0 the line of best fit (least mean squares) is drawn assuming the pressure distribution in front of a sphere (two free parameters effective radius R and velocity v).
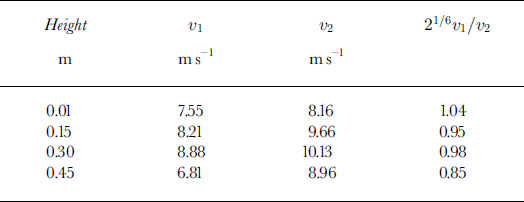
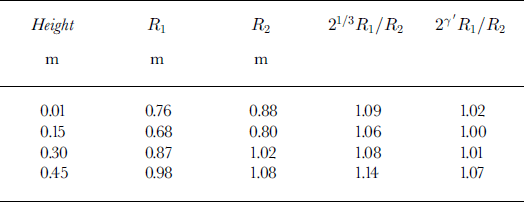
The velocities implied by the pressure data are shown in Table 1. The lower three sensors are all in rough agreement, with the velocity increasing slightly with height. The difference between these velocities and the video-derived head velocity (of order 5 m s–1) is the penetration velocity of the air into the head. Not surprisingly, this decreases with height as the air flows over the avalanche rather than into it. The flow velocities from the top sensor (height 0.45 m) are low because it is largely out of the flow in a region of reduced air velocity. The third column of Table 1 compares the air velocities with the scaling Equation (2). The agreement for the lowest three sensors in the flow is very good and provides further evidence in favour of the length-scaling hypothesis.
Comparison of implied velocities for 150 000(v1) and 300 000(v2) ball avalanches
Though the calculated velocities match the scaling law reasonably well, the radii do not (Table 2). A possible explanation is as follows. The flow field far from the body is that of a dipole imposed on constant flow. The magnitude of the dipole is the surface area of the implied sphere times the velocity π R2u. Close to the front, however, the flow field, to second order, will be more like that around an ellipsoid (this is the result of expanding the surface to second order in the coordinates). The equation fit is influenced by the region of high pressure difference close to the flow front, and the length scale measured here is actually the local radius of curvature. Thus 1/R = l/R, + 1/R2. Video footage and pictures of the slope show that the flow front is reasonably approximated by the parabola y = x2/d where d = 5 m and y is the distance from the centre line. Thus in Figure 4 it can be seen that 5 m back from the front the flow is 10 m wide. The measured radius of curvature in the x-y plane is thus R2 = d/2 = 2.5 m independent of the flow scale. This does not necessarily contradict the scaling hypothesis, because this is a local length scale and the width of the flow is still expected to scale as N1/3. Thus if R1 scales and R2 is constant the ratio between the front radii is
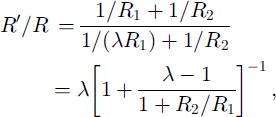
where A = (N’/N)1/3 is the length-scaling ratio. When A is close to 1 this can be simplified to

and thus the scaling exponent 7 = 1/3 is altered to γ = γ/(l + R1/R2). To the same order of approximation, R1 can be taken from the flows for either N or N’. The fourth column of Table 2 shows the excellent fit obtained with this analysis for R2/R1 = 2.5 and γ = 5/21.
Comparison of implied radii for 150 000(R1) and 300 000(R2) ball avalanches
This is a very tentative solution, and an explanation is still required as to why the front should have a constant parabolic shape.
The definition of the calculated radius is somewhat arbitrary. The pressure data could be equivalently fitted to

where t0 is a time constant. The radius is then deduced from R = t0v. The above analysis took v as the air velocity, but a more natural choice would be to use the velocity of the coordinate frame, i.e. the front velocity u if this is known. Since this velocity has the same scaling, this would only result in the implied radii being multiplied by some constant factor, so the previous discussion is unaffected.
Air pressure through the front
Within the ping-pong ball flow the steady-state mass and momentum equations for the airflow are


To calculate the pressure inside the flow these equations must be integrated. A simple approximation for the force valid to lowest order in φ is

where
 is an air-drag length scale and uT
is the terminal velocity of an individual ball (7.5 m s-1). An analytic solution is not easy to find. However, if the streamlines are not diverging (or converging) too rapidly the continuity equation can be approximated by (1 – φ) v = v0 over short distances if the streamlines diverge slowly where v0 is the penetration velocity of the air into the front. This is most likely to be true close to the ground, where symmetry suggests there will be a streamline passing straight through the centre of the flow. Substituting this into Equation (17) and integrating along this streamline yields

where s is the distance along a streamline. Even if the surface of the flow is sharply defined to within a ball diameter, φ changes more slowly because it is defined as an average over a volume containing many balls. Suppose the ball concentration is 0 outside the flow and φc = const, inside the flow. Then 0 increases linearly from 0 to φc
over a width w of order
 Integrating Equation (19) gives
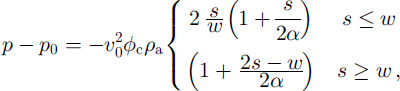
accurate for small s. Over longer distances the streamlines will diverge as the airflow is deflected up and out of the avalanche, the velocity will decrease and the pressure will increase (see Fig. 12).
Air pressure through the front at 0.01m for 300 000 balls. The front reaches the sensor at t=0s.

The rapid decrease in pressure as the flow front goes past the sensor that is predicted by this equation is clearly seen in Figure 12 (and also Fig. 11). The total pressure drops by 84 Pa from 0 s to 0.035 s. The front velocity is around 15 m s–1, so this corresponds to a distance of 0.5 m, certainly much larger than w, and Equation (20) is
 . From Table 1 the air velocity for this flow at 0.01 m is 8 ms–1, so v0 = 1 m s-1 and φc
≈ 0.2. This value for the volume fraction seems reasonable and is much lower than the maximum packing fraction, thus justifying the dilute approximation.
The x component of the momentum equation for the ping-pong balls Equation (8) can now be integrated with the same approximations to give

At t = 0.035 s (using linear interpolation) Kxx = 1.9 m2 s–2, and
 . These quantities are all of the same order, showing that the structure of the head is determined by the balance between air drag, granular stress and gravity. Further back in the body of the avalanche, Kxx
is approximately constant and the pressure varies only slowly. Since the effect of surface drag appears to be small this implies that the air drag on the top surface balances gravity.
A more detailed analysis of Equation (21) is not appropriate for several reasons. The large fluctuations of the air pressure in the avalanche imply that the flow is turbulent, and make interpretation of the air-pressure data very difficult since the sensor measures a complicated function of the local velocity and local pressure which can be simply understood only if the direction of the velocity is known. The ball velocity data also contain a lot of noise since in a typical frame only a dozen balls can be identified. Though mean values of the velocity are reasonably accurate, derivatives of K are much less so. There is an additional problem that the balls that were identified might be very special (perhaps only those with low vertical velocity have been sampled, for example), possibly leading to systematic errors which have not been estimated. In addition, the ball position measurements were taken lm to the left of the flow centre and the location of the pressure measurements. Despite all these difficulties, the data do suggest a number of significant processes within the avalanches.
Discussion
Classical work on gravity currents is based on perfect-fluid theory and assumes that the effects of viscosity and mixing of the fluids at the interface can be ignored (Reference BenjaminBenjamin, 1968). A major result of Reference BenjaminBenjamin (1968) is that, except when a gravity current exactly fills half a cavity, energy dissipation must occur through the formation of a head and turbulent flow behind it. Extensions to the basic theory include lower-boundary effects (Reference SimpsonSimpson, 1972) and a mixing region behind the head (Reference SimpsonSimpson, 1986), but there is still assumed to be a clear boundary at the front of the current.
A complete description of the flow field for a mixture of Newtonian fluids requires only one velocity field. This is because there can be no relative motion (at a point) between two fluids since a no-slip condition holds everywhere, so the velocity fields for each fluid (where they are defined) must be identical. Thus mixing between fluids is a slow diffusion process and there are often well-defined boundaries. The stability of boundaries is also enhanced by surface tension. However, when one of the fluids is a non-cohesive granular fluid there is no surface tension and the granular fluid will generally have a distinct velocity field. This is because although on the surface of each grain a no-slip condition holds, very large velocity gradients can exist across a narrow boundary layer, so the difference between the ambient fluid velocity field and the granular velocity field averaged over volumes containing a few grains can be very large. For grains falling in a gravitational field, for example, the relative velocity will be of the order of the terminal velocity.
The standard gravity-current theory (Reference BenjaminBenjamin, 1968) (correctly) assumes a stagnation point at the front of a gravity current because the velocity of the ambient and the current must be equal. This need not be true for granular gravity currents, and the air-pressure data show that there is a significant relative velocity over the width of the head (Fig. 13). The drag force is related to the relative velocity so a large difference between these avalanches and standard gravity currents is that the drag is a body force over the head of the avalanche rather than a surface force over the head’s front surface. Analysis of the forces in the head of the avalanches shows that there is an approximate balance of forces on the balls between gravity granular stress and air drag, and that surface friction is negligible. The air drag is balanced by a large, anisotropic increase in the granular stress and gravity. This increase is a result of an increase in the downslope fluctuation velocity which then leads to an increase in vertical and cross-slope fluctuations through collisions. Though a quantatitive balance of the vertical forces in the head has not been accomplished, the granular stress and the vertical component of the drag are probably both significant and lead to the height of the flow. Air drag may also directly enhance vertical velocity fluctuations. Further back in the body of the avalanche the granular stresses are constant (downslope) and the height is lower. Since surface drag is negligible, the gravity must be balanced by air-drag forces through the top surface. A likely mechanism for this is momentum transfer by the saltating particles. During their high trajectories they have time to exchange considerable horizontal momentum with slowly moving air, and when they collide with the main body this momentum will be almost perfectly transferred. In effect, there is a drag interaction between the main body and the airflow over the whole height of the saltating balls. Though this has not been quantified, this mechanism of momentum transfer is most likely more efficient than the drag on the upper surface of a smooth gravity current and helps explains why steady flows occur on such steep slopes even with such a large relative density (ρb/ ρa ≈ 90).
Schematic of the airflow round and through a ping-pong ball avalanche.

Conclusions
The air-pressure distribution in front of the ping-pong ball avalanches is well approximated by irrotational flow around a sphere. This approach could be extended to the flow behind the head by comparing the data with turbulent wake theory, but this is difficult because of the complicated interaction of the pressure sensors with the airflow when the velocity direction is unknown. The implied air velocities scale as the sixth power of the number of balls, in agreement with dimensional analysis and the scaling for the ping-pong ball velocities. The length scales implied by the airflow are of the same order of magnitude as the front height, but only obey the scaling law if the shape of the head is assumed to have a constant curvature (in the plane of the slope). Kinetic theory calculations show a quantatitive balance of forces in the head between gravity, granular stress and air drag.
Acknowledgements
The authors gratefully thank the many people who came to Miyanomori to support the experiment, which could not have been performed without their help. Furthermore we wish to thank the workshop staff of the Institute of Low Temperature Science who made the equipment. This work was partly supported by grant-in-aid for cooperative research and science from the Japanese Ministry of Education, Science and Culture. One of the authors was supported by an EU/JSPS Fellowship.



