

If there is one tissue in the body that deserves special recognition for its ability to perform extremely demanding load-bearing duties it is articular cartilage – that thin, glistening layer of compliant tissue covering the bone ends of our articulating joints. Articular cartilage functions so effectively in its role at the forefront of the joint system because of its unique physicochemical properties and its complex integration with the undergirding subchondral bone. And whereas the bone, at least in a straightforward mechanical sense, behaves very largely as a stiff elastic substrate, the overlying cartilage exhibits a much more varied set of mechanical properties and these can, in turn, render the junction between these two adjoining tissues especially vulnerable. This first chapter will provide a brief overview of some key mechanical principles relating to joint function followed by a detailed analysis of the structure of articular cartilage. Subsequent chapters will explore the structure and mechanical properties of the integrated cartilage–bone system.
1.1 The Regulation of Joint Stresses and Joint Friction
1.1.1 Contact Stress Reduction and the Importance of Compliance
Articular cartilage is a tissue we mostly take for granted until, by virtue of its partial or complete destruction, we enter that all-too-familiar world of debilitating joint pain. But why should the loss or breakdown of this highly compliant cartilaginous layer be the cause of such widespread suffering? Recourse to several quite straightforward mechanical principles can help answer this question.
First, the bone covered by the compliant articular cartilage layer is rigid by comparison and herein lies a major problem. Imagine a pair of typically profiled condyles making direct bone-to-bone contact under a state of simple compression (LH schematic in Figure 1.1a). Unless there is perfect contour matching across their entire surfaces the compressive load will be transmitted only across that smaller area of direct contact resulting in a concentration of stress that may well exceed the mechanical limits of the bone.
Schematics illustrating both macro-level (see a) and micro-level (see b) stress attenuation provided by the intervening layers of compliant articular cartilage (arrow length indicates approximate magnitude of stress).
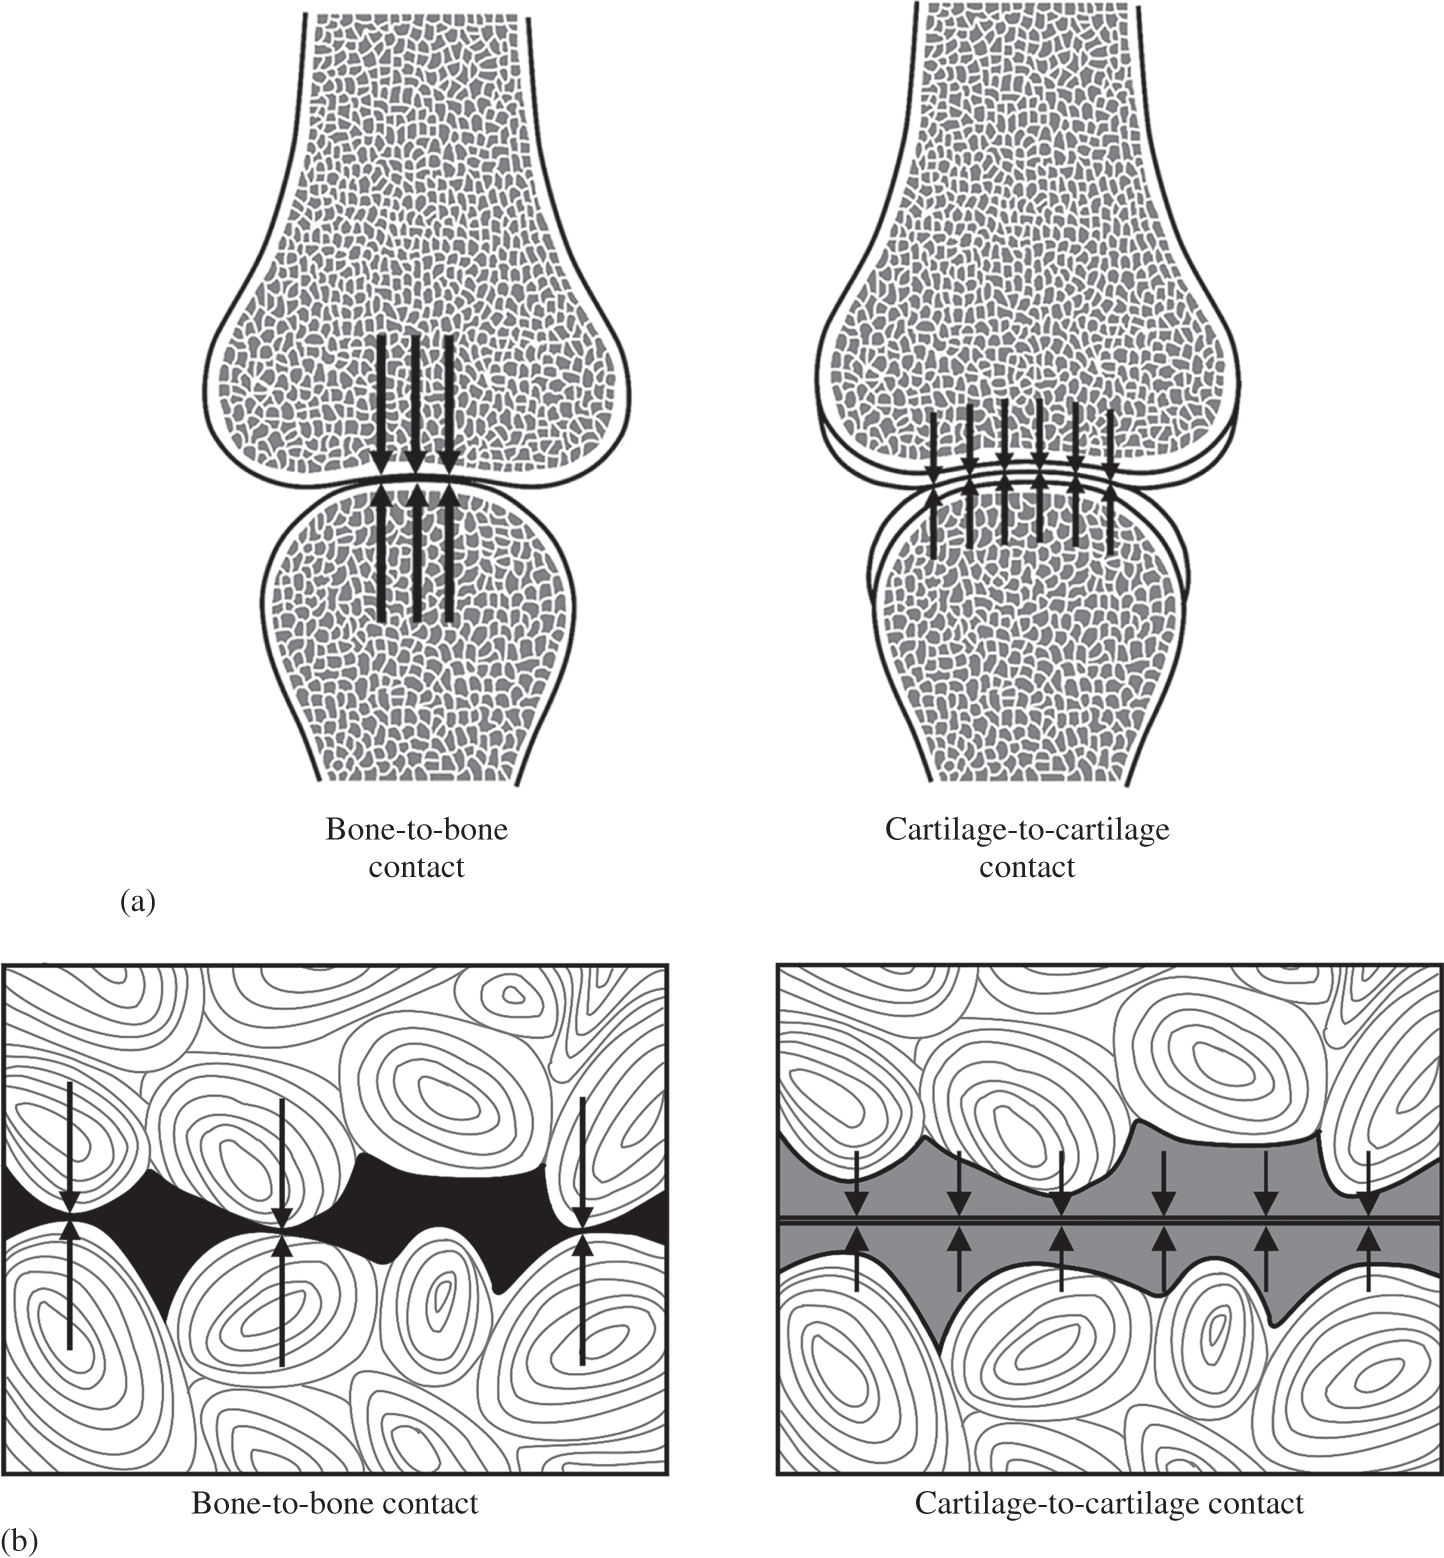
There is also a second level of mechanical risk, but on a much smaller scale. Less related to the joint contour it arises more from the natural microscopic undulations of the bone surfaces that would, without any intervening layers of cartilage, be in direct contact (LH schematic in Figure 1.1b). The load would again be concentrated at the high points of contact and sensed as pain in the innervated bone. The ‘grinding’ effect of repeated joint-loading and movement would lead, in time, to the destruction of the bone.
The elimination of these potentially damaging stress concentrations is, therefore, one of the primary biomechanical functions of the joint cartilage and is achieved by preventing the two rigid bone surfaces from having direct contact by means of the two compliant layers of articular cartilage (see RH schematics in Figures 1.1a and 1.1b). The latter deforms sufficiently to both maximise the area of contact between the differently contoured joint surfaces and eliminate these localised, more micro-scale contact points. The applied compressive load is now distributed over a much larger area thereby reducing the contact stresses transmitted into the bone tissues to a safe level.
Broom and Oloyede (Reference Broom and Oloyede1993) were the first to experimentally investigate this contact stress-attenuating role of articular cartilage in a study in which they glued layers of articular cartilage to a photo-elastic epoxy resin substrate, the latter acting as a model analogue of the rigid subchondral bone. By analysing the photo-elastic fringe patterns obtained under both quasi-static and dynamic compressive loading they were able to determine the levels of shear stress generated subchondrally with respect to depth below the compliant–rigid junction and compare the effectiveness of the articular cartilage in reducing these shear stresses under conditions of both quasi-static and dynamic compression. They inferred from these experiments that while articular cartilage provides a significant level of subchondral bone protection under both quasi-static and dynamic loading, greater bone protection is provided closer to the cartilage–bone junction under quasi-static than under dynamic loading conditions. They interpreted this difference in terms of the contrasting deformation mechanisms operating in the articular cartilage matrix at low versus high rates of loading. We explore this rate effect in more depth in Chapter 3 (see Section 3.2).
We can see the damaging consequences of high-stress concentrations (and their prevention) when two flat sheets of glass are brought together but between them a small fragment of grit has been inadvertently trapped. The consequences are all too obvious: the destructively high contact stresses at the grit site will quickly scratch or damage the glass. But simply by sandwiching several soft layers of paper (analogous to cartilage) between the two hard sheets the problem is averted. In fact, glaziers always cut their sheets of glass on a flat, soft cloth-covered surface for this very reason.
1.1.2 Lubrication Mechanisms in the Articulating Joint
The stiff subchondral bone is therefore protected from high concentrations of stress by its compliant covering of articular cartilage, but what then protects the ‘protector’? The constant articulations performed by a joint over a lifetime would surely put at risk even its cartilage were it not for the very special conditions that prevail at the joint surfaces. A key function of the joint cartilage is therefore the provision of near friction-free movement and it can perform this critical role by virtue of it having a coefficient of friction of around 0.01 (Charnley Reference Charnley1960). By way of comparison polytetrafluorethylene (‘Teflon’) bearing materials have a coefficient of the order of 0.04 (McCutchen Reference McCutchen1962a, Reference McCutchen1962b).
McCutchen (Reference McCutchen1990) has provided an insightful overview of the history of synovial joint lubrication as well as highlighting the conflicting ideas and theories that have shaped our understanding of this important area. As a way of doing justice to the topic of joint lubrication within the confines of this short section we shall draw substantially on material presented in McCutchen’s informative overview.
The science of joint lubrication began to develop with the very early suggestion of MacConaill (Reference MacConaill1932) that wedge-shaped synovial fluid-filled spaces were created between the articulating surfaces that were not completely congruent throughout their entire range of movement. MacConaill argued that pressure is then generated in this wedge of fluid as a result of the relative movement between the two surfaces. It is this pressurised-fluid film that keeps the two surfaces separated, supports the loading applied to the joint and facilitates very low friction articulation: in effect he was describing the well-known mechanism of hydrodynamic lubrication. It should be noted that the hydrodynamic mechanism proposed by MacConaill required relative movement between the two joint surfaces. However, in human-made bearing systems the same end goal of physically separating two surfaces by means of a pressurised film of fluid can also be achieved without any relative motion – simply by employing an external pressure pump to inject a lubricant directly into the bearing as is the case in the modern motorcar engine – a mechanism obviously not applicable to the living joint!
Following MacConaill (Reference MacConaill1932), others were able to show that the viscosity of synovial fluid decreased with an increasing rate of shear, a property change again consistent with a mechanism of hydrodynamic lubrication operating in the joint such that with higher speed motion a lower viscosity would still ensure effective lubrication without increasing the drag forces (Ropes et al. Reference Ropes, Robertson and Rossmeisl1947; Ogston and Stanier Reference Ogston and Stanier1953). Charnley (Reference Charnley1960), however, challenged the hydrodynamic theory on three counts arguing that: (i) in some joint systems there is extended intimate contact between the two loaded surfaces such that the wedge space profile would not exist; (ii) where there is ‘reciprocating’ movement the pressurised fluid wedge, once generated by movement in one direction, would then be destroyed with any reverse movement; and (iii) hydrodynamic lubrication is not easily achieved with slow-moving surfaces under heavy loads. In fact, the synovial joint exhibits low friction with zero sliding between its surfaces (McCutchen Reference McCutchen1962b). Charnley (Reference Charnley1960) promoted, instead, the idea of the articular surface being inherently slippery, with low-friction joint articulation being primarily dependent on a mechanism of boundary lubrication. However, he did not rule out the possibility of there being a component of quasi-static hydrodynamic lubrication arising from the free synovial fluid present in the joint cavity.
In response to the idea of boundary lubrication McCutchen (1959, Reference McCutchen1962a, Reference McCutchen1962b) suggested that it might have been premature of Charnley to dismiss the role of fluid pressure in favour of some kind of inherent ‘Teflon-like’ boundary layer slipperiness created by an interaction between the cartilage surface and synovial fluid. Building on the idea of a ‘hydrostatic bearing’ McCutchen developed the concept of ‘weeping lubrication’ based on the fact that articular cartilage is both porous and deformable. He conducted a series of ingenious friction experiments using a closed-pore sponge material in which one face had been cut to expose its cells and was able to demonstrate that its slipperiness when wetted and loaded against a glass surface was a direct consequence of the pressurised fluid being trapped in the tiny pockets now sealed against the impervious surface. The bulk of the applied load was carried in a largely frictionless manner and as long as the fluid remained trapped McCutchen was able to show that the low-friction state persisted – gradual leakage over time brought the solid material of the sponge increasingly into contact with the glass surface, thereby increasing the friction.
McCutchen (Reference McCutchen1962a, Reference McCutchen1962b, Reference McCutchen1990) carried out similar experiments on articular cartilage, treating it as a ‘fine-grained sponge’ material possessing an ultra-low permeability, and demonstrated again that it is slippery when hydrated, but, as the fluid is squeezed out of its ultrafine pores, the friction increases. He argued that loading would pressurise the fluid in the pores almost to the level of the applied load and therefore carry most of this load with little left to be carried by direct solid-to-solid contact between the two cartilage matrices. McCutchen referred to this mechanism as ‘weeping lubrication’ in order to emphasise that fluid initially present between the two surfaces would not be responsible for the persisting low-friction contact between them. Rather, the fluid carrying the load is derived from within the hydrated cartilage matrix itself. He also reasoned that because the solid components of the two matrices would only be in very light contact – a consequence of the small component of the total load being carried by them – their sliding over each other will be lubricated successfully by the synovial fluid, in effect providing an additional minor component of boundary lubrication (McCutchen Reference McCutchen1983).
That there is stress-sharing between the interstitial fluid and the solid components in the compressed articular cartilage matrix, and that this sharing changes over time, was first demonstrated experimentally by Oloyede and Broom (Reference Oloyede and Broom1991, Reference Oloyede and Broom1993, Reference Oloyede and Broom1994a, Reference Oloyede and Broom1994b, Reference Oloyede and Broom1996) and subsequently by Soltz and Ateshian (Reference Soltz and Ateshian1998, Reference Soltz and Ateshian2000) and Park et al. (Reference Park, Krishnan and Nicoll2003). Oloyede and Broom were able to show that a level of pore pressure was developed in the compressed articular cartilage matrix that approached the applied stress and was, thus, entirely consistent with McCutchen’s mechanism of weeping lubrication. They were also able to demonstrate experimentally the transient nature of this hydrostatic pore pressure development, showing that it attained a maximum initial value (the maximum excess pore pressure) and with sustained loading it decayed gradually to a near-zero level over a period of several hours. This indicated that the applied load was being progressively transferred from the fluid phase into the solid components of the matrix via a classical consolidation mechanism.
As has been pointed out in the review by Ateshian (Reference Ateshian2009), now that the pressurised interstitial fluid has been shown to facilitate one of the primary friction-reducing mechanisms in the joint, by allowing this interstitial pressure to subside (by matrix consolidation) it becomes possible to independently investigate the effectiveness of other mechanisms and especially that provided by boundary lubricants. With sufficient relative motion between the articulating surfaces there is also hydrodynamically induced fluid film lubrication to add to the mix of mechanisms now recognised as contributing to the joint’s low-friction function. The science of joint lubrication is a still-developing field; the literature is vast and growing, and interested readers are referred to reviews by Neu et al. (Reference Neu, Komvopoulos and Reddi2008), McNary et al. (Reference McNary, Athanasiou and Reddi2012) and Daniel (Reference Daniel2014).
1.2 The Structural Meaning of Elastic Stiffness
The mechanical property termed elasticity refers to a material’s ability to recover completely from any deformation of its structure and it will be obvious that elasticity has its limits – if we stretch or compress too much we exceed the material’s elastic limit and either irreversible deformation or fracture will be the end result.
Conventional materials such as most minerals, metals, ceramics and glass, etc., all derive their relatively high stiffness from the balance between the attractive and repulsive forces that bind their component atoms or molecules into what is usually (but not always) an ordered or crystalline arrangement. In effect, the distance separating the atoms or molecules defines an interaction of lowest potential energy, or greatest stability. The distances over which the fundamental forces act are very small so the degree to which these materials can be elastically deformed is very small and directly related to the permissible amount of stretching or compressing of the interatomic or intermolecular bonds before they are either severed or the component atoms or molecules are irreversibly translated into new equivalent lowest energy positions as occurs in permanent or plastic deformation. Importantly, any elastic stretching or compressing results in an increase in strain energy of the material and it is the return to the lowest energy state on removal of the deforming stress that is the driving force for its near-instantaneous elastic recovery.
For a conventional metal the limit of elastic stretching or compressing before irreversible changes occur is typically less than ~0.2 per cent of its undeformed dimensions. Most metals possessing a degree of ductility will be permanently or plastically deformed if strained beyond this value, whereas highly brittle solids such as many minerals, ceramics and inorganic glasses may reach a slightly higher strain and then simply fracture. Whether this elastic behaviour ends in either permanent deformation or brittle fracture, it comes under the general definition of conventional, low-strain elasticity.
1.3 Fundamental Principles Governing Compliant Versus Stiff Tissues
The osteochondral junction is responsible for integrating structurally the articular cartilage and subchondral bone with their contrasting mechanical properties to create a highly successful load-bearing system. The subchondral bone is required to function mechanically as a relatively rigid elastic material and can, therefore, be categorised approximately as having small-strain elastic properties.
The binding forces responsible for this high elastic stiffness reside mostly in the bone’s brittle mineralised component, namely the calcium hydroxyapatite in which the amount of elastic stretch is defined by the strength of intermolecular bonds within its complex crystalline structure. The less stiff collagen fibrils embedded and constrained within it act primarily as a highly structured tensile-reinforcing component that reduces the risk of fracture occurring in the mineralised phase under tensile loading conditions and thereby increases the bone’s toughness. We shall explore in more detail this important concept of toughness as applied to fracture of the osteochondral junction in Chapter 4.
Although we have described the collagen fibre or fibril as the less stiff component in the subchondral bone, such a statement requires some careful qualification. First, the collagen fibril, by virtue of its inherent structure, would be expected to fit more within the category of small-strain elasticity, although at first glance this might appear to contradict what we observe experimentally. The assembly of the collagen fibril begins with a primary α-helical polymer chain developed from a repeating sequence of amino acids. Then, through several sub-levels we arrive finally at the quarter-staggered, over-lapping array of tropocollagen molecules to form the collagen fibril (see reviews of collagen structure by Nimni and Harkness Reference Nimni, Harkness and Nimni1988; van der Rest and Garrone Reference Van der Rest and Garrone1991), a hierarchical structure that is highly ordered and effectively ‘bond-locked’, with limited ability to extend axially before irreversible structural damage results.
Rigby et al. (Reference Rigby, Hirai and Spikes1959) suggested that for the rat tail tendon, strains beyond about 4 per cent result in the rupture of secondary bonds, but not necessarily the primary bonds, of the collagen molecules. Harkness (Reference Harkness1961) in his extensive review of collagen described the fibril as being relatively inextensible with actual rupture in the collagen fibre occurring beyond strains of 10–20 per cent. Kastelic and Baer (Reference Kastelic and Baer1980) report irreversible elongation (they termed this ‘yield’) of tendon fibres with strains from 2 per cent and upward depending on maturity. Earlier experiments by Hall (Reference Hall1952) demonstrated that at a normal pH of 7.0 collagen fibre elasticity is due primarily to internal energy changes arising from the stretching of bonds and bond angles rather than to entropy changes, the latter being the case for both elastomeric rubbers and the elastin fibre, a topic we shall discuss in some depth in Chapter 7.
The elastic strain limit of the collagen fibre is still considerably higher than that of many conventional crystalline solids (typically ~0.2 per cent strain) but this reflects the much more complex multi-level nature of the bonding in collagen’s hierarchical structure (involving hydrogen bonds, electrostatic interactions and covalent bonds) in contrast to the regular interatomic bonds that determine the elastic limit of a typical crystalline metal. It is important to emphasise, too, that while collagenous arrays such as those comprising tendons, ligaments, and the disc annulus are able to exhibit elastic strains as high as 10–15 per cent (see e.g. Rigby et al. Reference Rigby, Hirai and Spikes1959; Baer et al. Reference Baer, Cassidy, Hiltner and Nimni1988) this is not a reflection of their inherent material elasticity. Rather, such large elastic strains are derived from their crimped morphology and its straightening under a tensile load. Once this ‘geometric’ crimp is eliminated any further elastic stretch is limited to that able to be derived from the fibril’s bond-locked structure.
For the collagen fibril or fibre we, therefore, need to distinguish between an intrinsic bond-based elasticity (inherently low strain and probably less than ~4 per cent) and a geometric or configuration-based elasticity which has the ability to generate very large elastic strains that still harness the intrinsic bond-based interactions. A nice example illustrating this principle is a coiled steel spring: the intrinsic elastic stiffness of steel is ~200 GPa and yet we can have a spring constructed from this same steel having vastly lower stiffness values by virtue of the elastic uncoiling of its coiled configuration. The material stiffness of the steel remains unchanged throughout the elastic unravelling of the coils.
Although the articular cartilage matrix is relatively rich in collagen, for it to function effectively in its stress-attenuating role it is required to be highly deformable in a completely recoverable sense and yet still act in the ‘front line’ of joint loading. Cartilage derives these important mechanical properties from a highly complex set of structural and physicochemical relationships between its constituent components. So, what is the structure of articular cartilage and how does this structure give rise to the tissue’s functional properties?
1.4 Composition of Articular Cartilage and Its Physico-Chemical Implications
In purely constituent terms, about two-thirds of the dry weight of mature articular cartilage is collagen and this is mostly type II collagen fibrils (Eyre Reference Eyre2002). The other major biochemical components are the proteoglycans – a broad class of macromolecules consisting of a protein core to which are attached glycosaminoglycans – the dominant one being aggrecan (Heinegard Reference Heinegard2009). Typically, more than a 100 negatively charged chondroitin sulphate molecules bind to the aggrecan chains (Knudson and Knudson Reference Knudson and Knudson2001). Two related physico-chemical properties arise from the macromolecular configuration characterising the proteoglycans. First, due to the repulsive forces between the fixed negative charges along the glycosaminoglycan chains they adopt an extended, rather than contracted, configuration and, thus, present as a potentially large open macromolecular structure. Second, the fixed negative charges will tend to be neutralised by counter ions which increase the chemical species concentration and results in water being drawn osmotically into the cartilage matrix.
The above two effects therefore give the cartilage matrix a very large water-binding potential such that more than 60 per cent of its wet weight can consist of matrix fluid. The swelling pressure generated by this in-drawing of fluid is countered by the unique fibrillar architecture of the healthy articular cartilage matrix and confers on it a range of biophysical and biomechanical attributes fundamental to its primary load-bearing function. The reader is referred to pioneering studies by Maroudas and co-workers in which the fundamental physico-chemical principles are developed that correlate composition with both the swelling and permeability properties of the cartilage matrix, both normal and degenerate (Maroudas Reference Maroudas1968; Maroudas and Bullough Reference Maroudas and Bullough1968; Maroudas et al. Reference Maroudas, Bullough and Swanson1968; Maroudas Reference 368Maroudas1976).
1.5 Early Structural Models of Articular Cartilage
In a larger mammalian joint the articular cartilage covering the bone ends is typically between 1 and 2.5 mm in thickness with its depth conventionally divided into a number of relatively distinct structural zones before the bone substrate is reached. The earliest investigation of the relationship between the fine structure of articular cartilage and its functional role was conducted by the Scottish physician and anatomist William Hunter (Figure 1.2). In his paper Of the Structure and Diseases of Articulating Cartilages (Hunter Reference Hunter1742) which he read to a gathering of The Royal Society of London in 1743, Hunter’s opening paragraph should bring delight to the eyes of any modern joint biomechanist (Figure 1.2). It alludes most elegantly to the mechanical principles describing how the cartilage protects the bone-ends and to the requirements of both joint lubrication and stability.
Portrait of eighteenth-century Scottish physician and anatomist William Hunter (image from Wikipedia) together with a quote from the paper that he read to a meeting of the Royal Society of London on 2 June 1743.
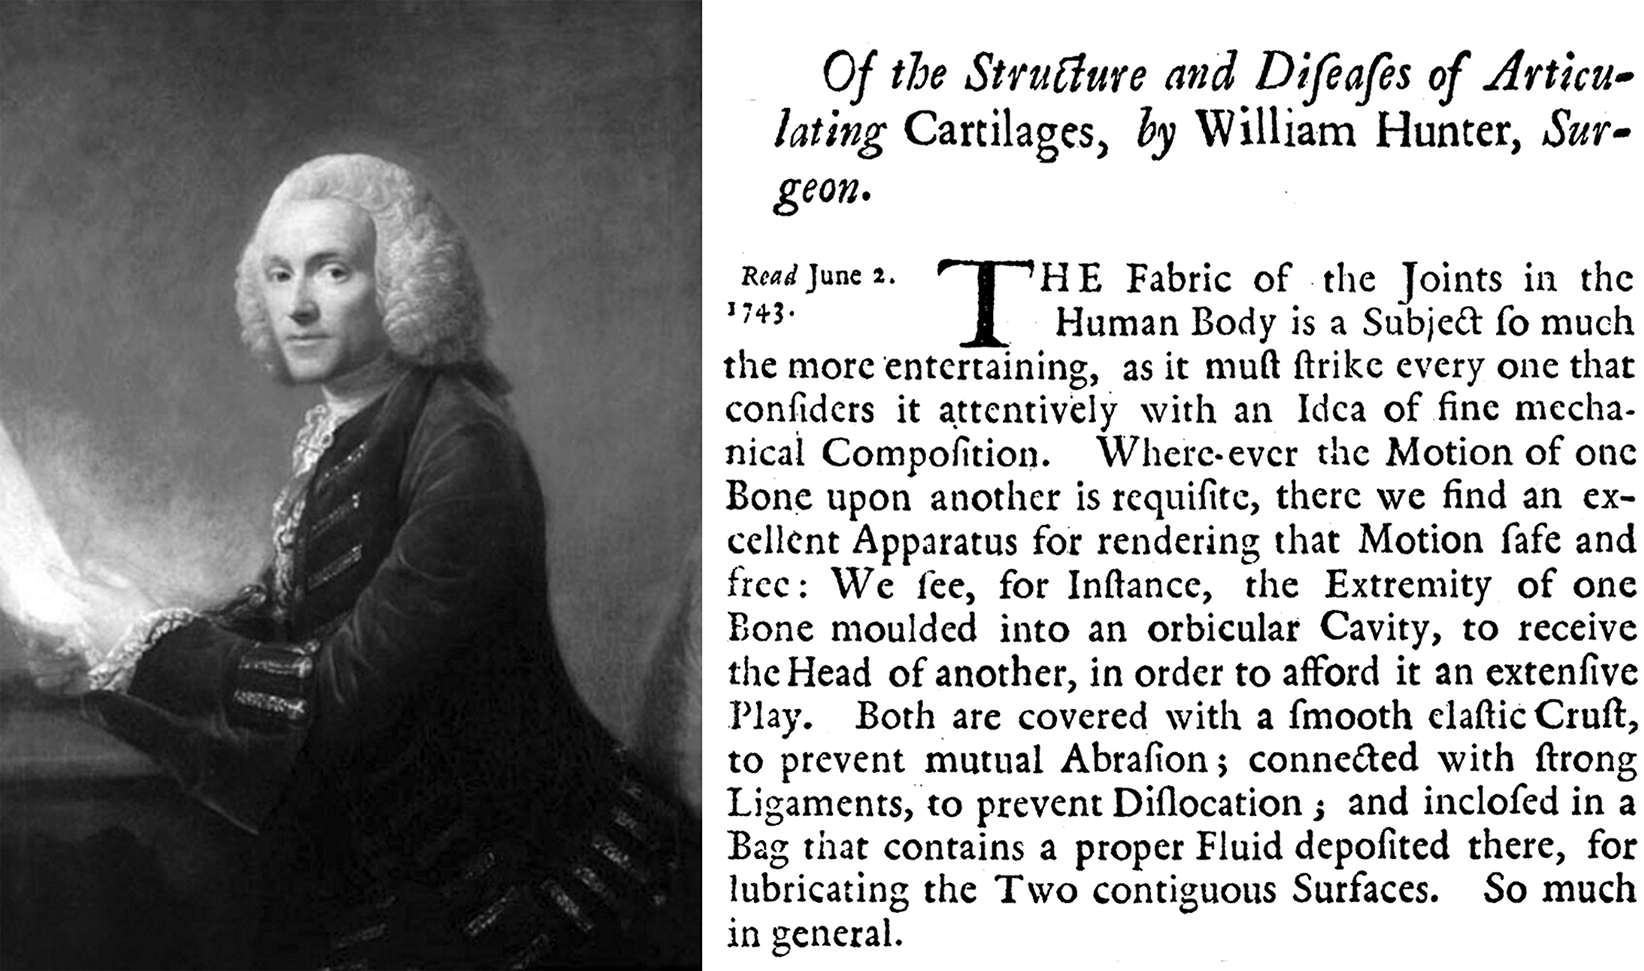
As we will see shortly, Hunter was the first to provide us with a glimpse of the basic architecture of articular cartilage. He describes the fibres in articular cartilage as rising up perpendicularly from the underlying bone, likening its texture to the pile of velvet attached to its base of woven cloth. Although unable to view them with his ‘glass’, Hunter argued for the presence of transverse fibres to connect the perpendicular elements and thus form a ‘whole solid body’. Further, he refers to a fine covering membrane ‘firmly braced upon the surface’, this being exceedingly fine but readily demonstrated when the cartilage is macerated.
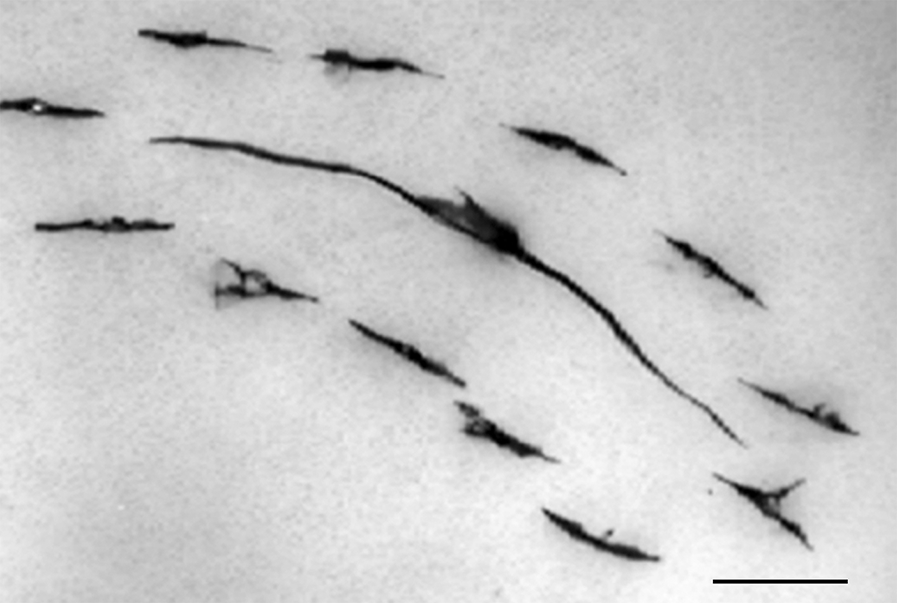
As noted by Clarke (Reference Clarke1971), the Swedish anatomist Vilhelm Hultkrantz in 1898 developed the idea that the fibres in the surface layer of articular cartilage possessed strongly directional properties. He made multiple punctures across the articular surfaces of a variety of joints with a small round awl and demonstrated sweeping patterns of directional splitting which he interpreted as tracking the fibrous alignment in the surface layer. The image in Figure 1.3 illustrates this directional splitting tendency in the articular surface of a cartilage–bone sample that had been incrementally loaded in compression using a transparent indenter until rupture occurred. The sample was rehydrated and then pin-pricked and inked to reveal how the rupture had tracked along the contour of the pin-prick splits.
Image showing en face view of directional splitting revealed by pin-pricking the articular surface followed by India ink staining. Scale = 1 mm.
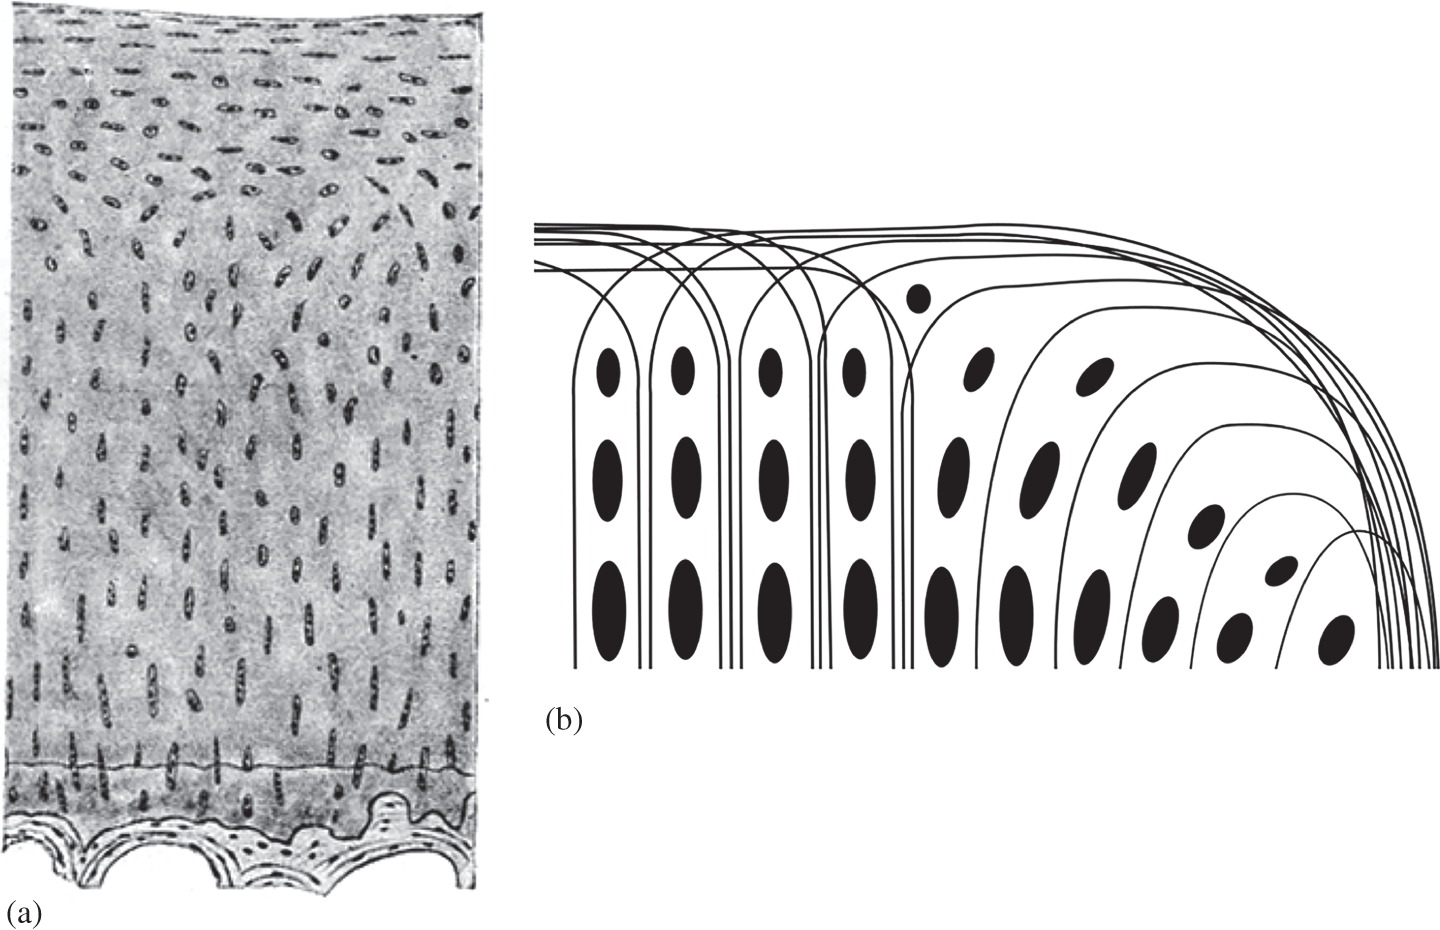
Employing optical microscopy Benninghoff (Reference Benninghoff1925) explored both the fibrosity and cellularity of the deeper cartilage matrix and developed his oft-quoted arcade concept as a means of linking, in a structurally coherent manner, the vertical or radial arrangement of fibres in the deeper regions with those aligned transversely in the articular surface (see Figure 1.4).
(a) One of the early microscopic images of the osteochondral tissues from Benninghoff (Reference Benninghoff1925). Reproduced with permission. (b) Schematic redrawing of Benninghoff’s original formulation of the fibrous arcade concept as derived from the lines of chondrocyte continuity.
MacConaill (Reference MacConaill1951) countered, in part, Benninghoff’s radial model, proposing instead an arrangement of fibrils that, in large measure, coursed obliquely from the articular surface to the bone, arguing that based on principles of structural engineering an oblique rather than radial configuration would be more effective in resisting the joint forces. He did acknowledge that there were radial elements, but that these could not be the predominant fibrous constituent. However, if one examines MacConaill’s relatively crude microscopic evidence there seems little to support this assertion.
Interestingly, MacConaill (Reference MacConaill1951) did emphasise the importance of a fibrous network that incorporated a significant element of transverse connectivity between his envisaged fibre bundles, referring to this as forming a ‘phorm-anastomotic network’, meaning a plaited mat or basketwork. We shall return to this concept of transverse connectivity shortly because of its relevance to our understanding of both the directional mechanical properties of the cartilage matrix and its degeneration.
1.6 Structural Models of Articular Cartilage with the Advent of Electron Microscopy
The development of electron microscopy, both transmission (TEM) and scanning (SEM) gave investigators access to the fibril-level structure of the cartilage matrix. Again, various studies offered evidence both for and against the primary radial configuration embodied in the Benninghoff (Reference Benninghoff1925) model (see Figure 1.4). We shall summarise several of these.
Davies et al. (Reference 359Davies, Barnett and Cochrane1962) from their TEM study of young rabbit cartilage claimed there was no predominance of fibre bundles perpendicular to the surface. Silberberg (Reference Silberberg1968) reported a relatively non-directional arrangement of fibrils in the mid and deep zones of mouse articular cartilage. The TEM study by Weiss et al. (Reference Weiss, Rosenberg and Helfet1968), although focussing primarily on the upper layer of human articular cartilage, also described the fibrillar architecture in its underlying zones as randomly oriented as did Clarke (Reference Clarke1971) using SEM evidence.
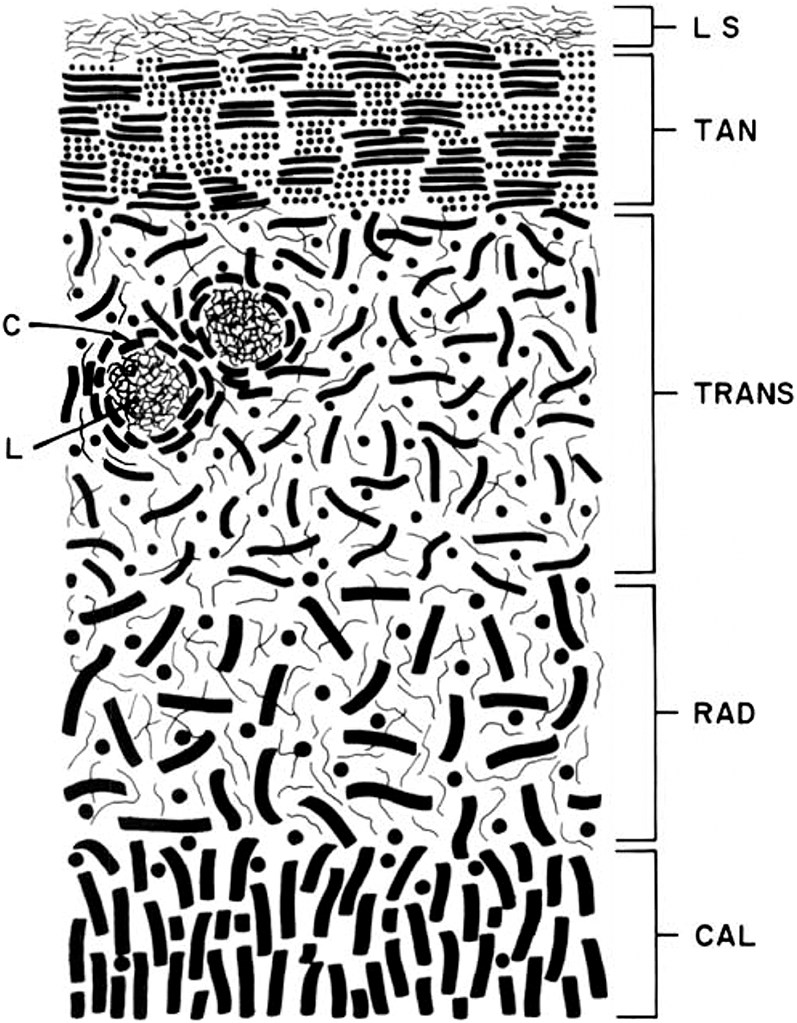
Lane and Weiss (Reference Lane and Weiss1975) in their review of the literature presented a schematic of the fibrous architecture of human articular cartilage, emphasizing the idea of a random configuration of fibrils in the so-called radial zone but, interestingly, portrayed those in the calcified cartilage zone as being perpendicular to the articular surface (see Figure 1.5).
Schematic representation of the various zones of articular cartilage from Lane and Weiss (Reference Lane and Weiss1975). Their annotations are as follows: LS = lamina splendens, TAN = tangential zone, TRANS = transitional zone. RAD = radial zone, CAL = calcified zone, C = lacunae capsule, L = lacunar rim.
Speer and Dahners (Reference Speer and Dahners1979) studied both canine and human joint cartilage using polarised light microscopy (PLM) and SEM. While providing evidence in general support of the Benninghoff (Reference Benninghoff1925) arcade model, they also argued for the presence of a bracing system of oblique fibres integrated with the predominantly radial fibres in the mid and deep zones, this being similar to that proposed earlier by Bullough and Goodfellow (Reference Bullough and Goodfellow1968) in their study of human articular cartilage using both PLM and TEM.
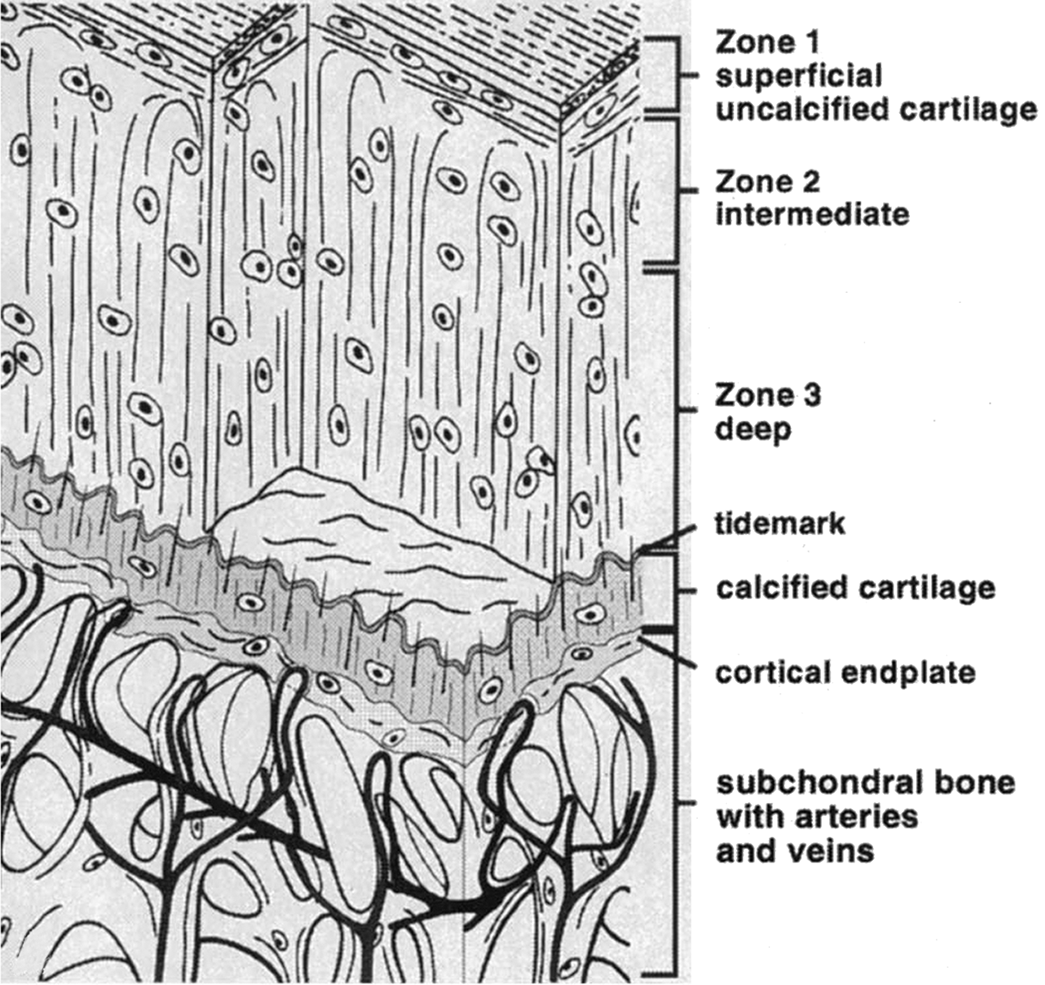
Still others in subsequent studies (e.g., Imhof et al. Reference Imhof, Sulzbacher and Grampp2000) have persisted with the Benninghoff (Reference Benninghoff1925) model portraying a simple radial configuration of fibrils in the mid and deep zones, often described as organised in leaves or laminae, and arching over in the upper regions to form the tangential layer of the articular surface (see Figure 1.6).
Structural schematic of the osteochondral tissues taken from Imhoff et al. (Reference Imhof, Sulzbacher and Grampp2000) and portraying a vertical configuration of fibrils in the articular cartilage general matrix.
1.7 Fibril Continuity and Ultra-Structural Imaging of the Articular Cartilage Matrix
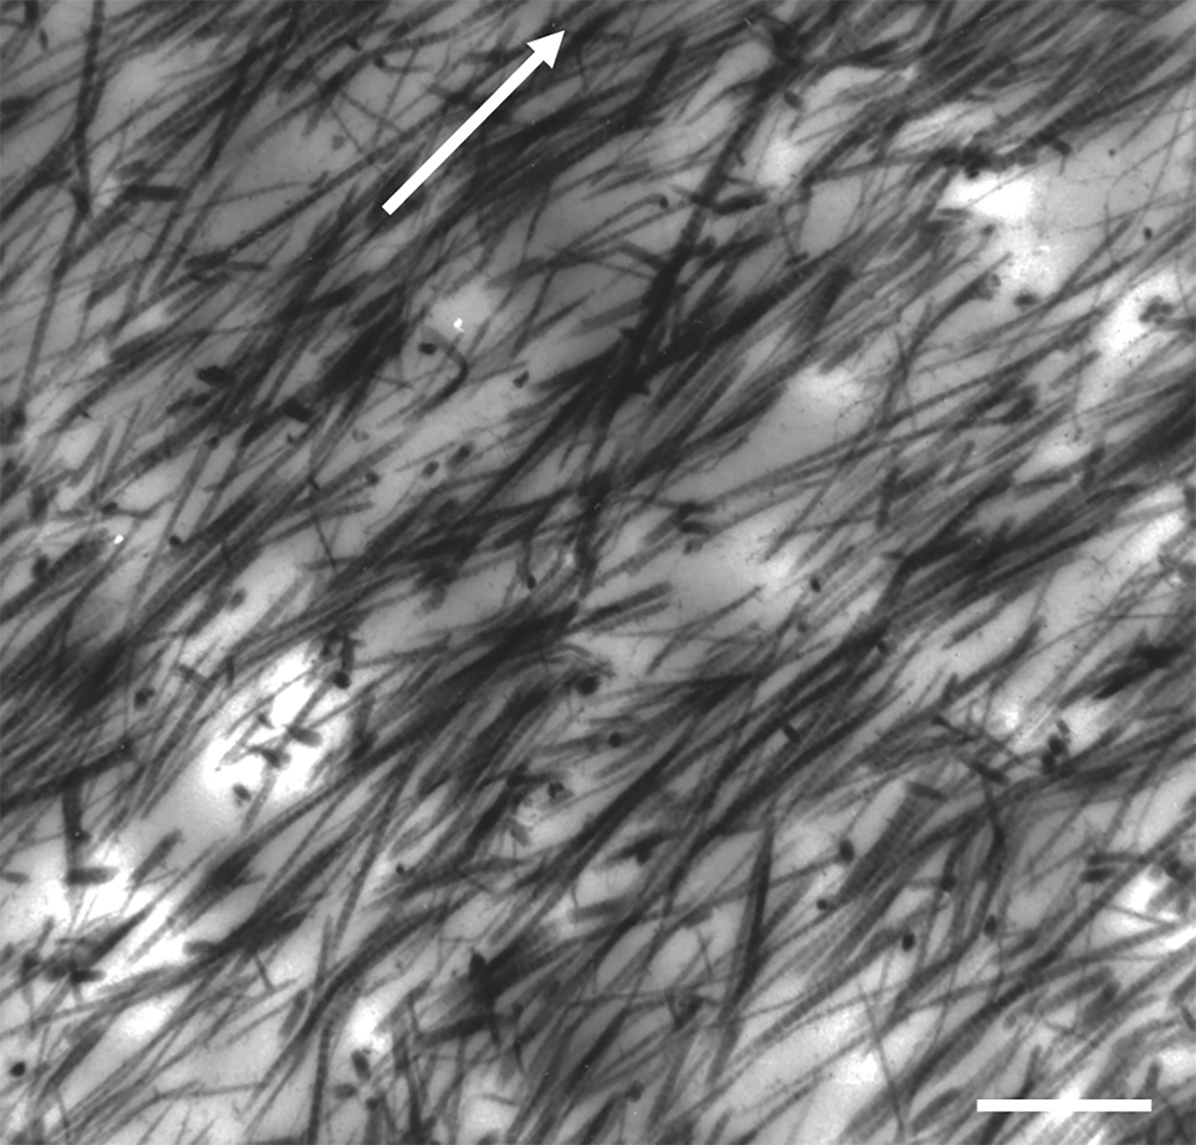
It is important to acknowledge the difficulty of capturing the full extent of fibril continuity in the cartilage matrix using ultra-structural imaging. With TEM the need to use ultra-thin sections means that most fibrils, unless lying exactly within the plane of the thin section, will quickly depart out of the section. For example, the images in Figures 1.7 and 1.8 illustrate this problem in two contrasting ultra-structural images of the general matrix. Figure 1.7 is a mid-to-deep zone view of the fibril structure in normal cartilage from a fifty-nine-year-old human femoral head and shows only limited continuity of the fibrils within the plane of the section.
TEM fibril-level images of the mid-to-deep zone of normal articular cartilage from the bovine femoral condyle. Arrow indicates radial direction. Scale bar = 1 µm.
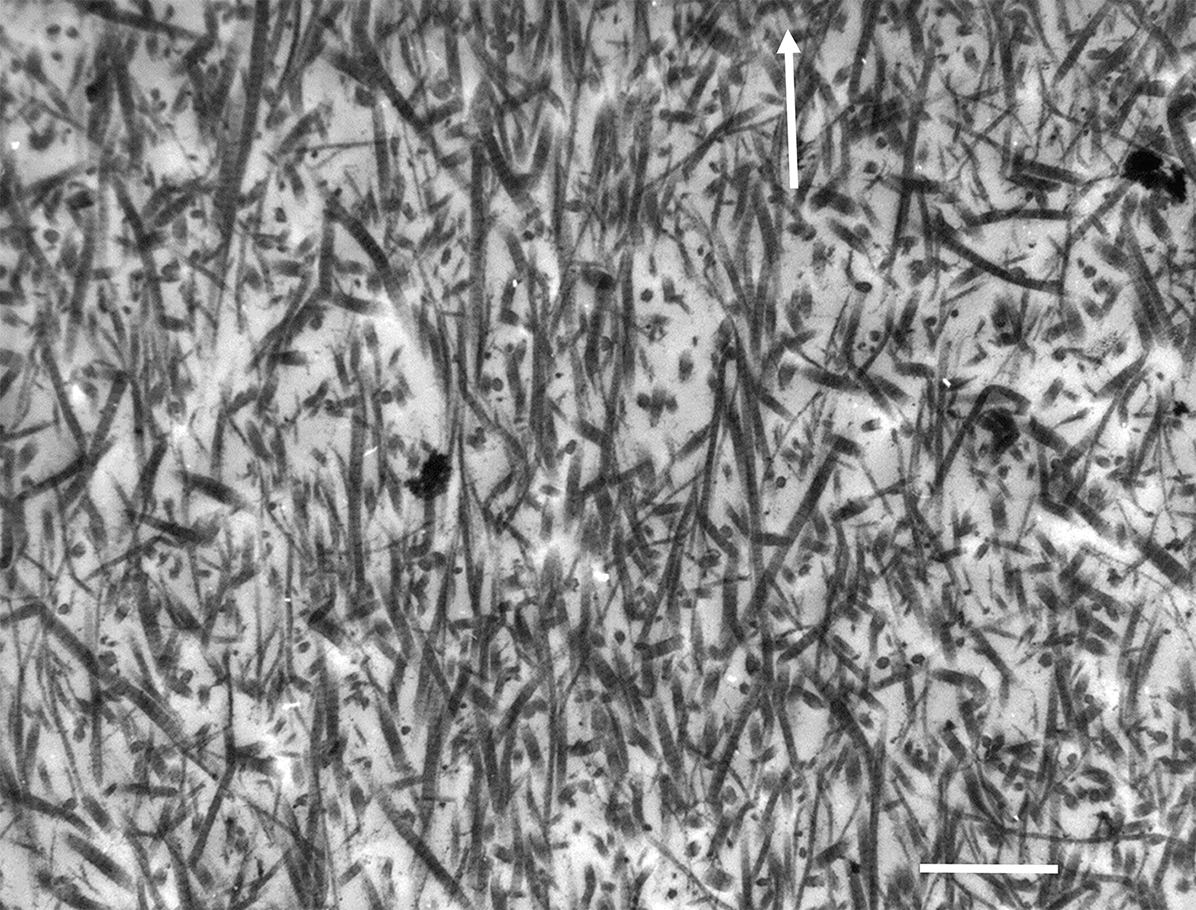
TEM image of the collagen fibrils in the mid zone of abnormally softened articular cartilage taken from the bovine tibial plateau. Arrow indicates radial direction. Scale bar = 1 µm.
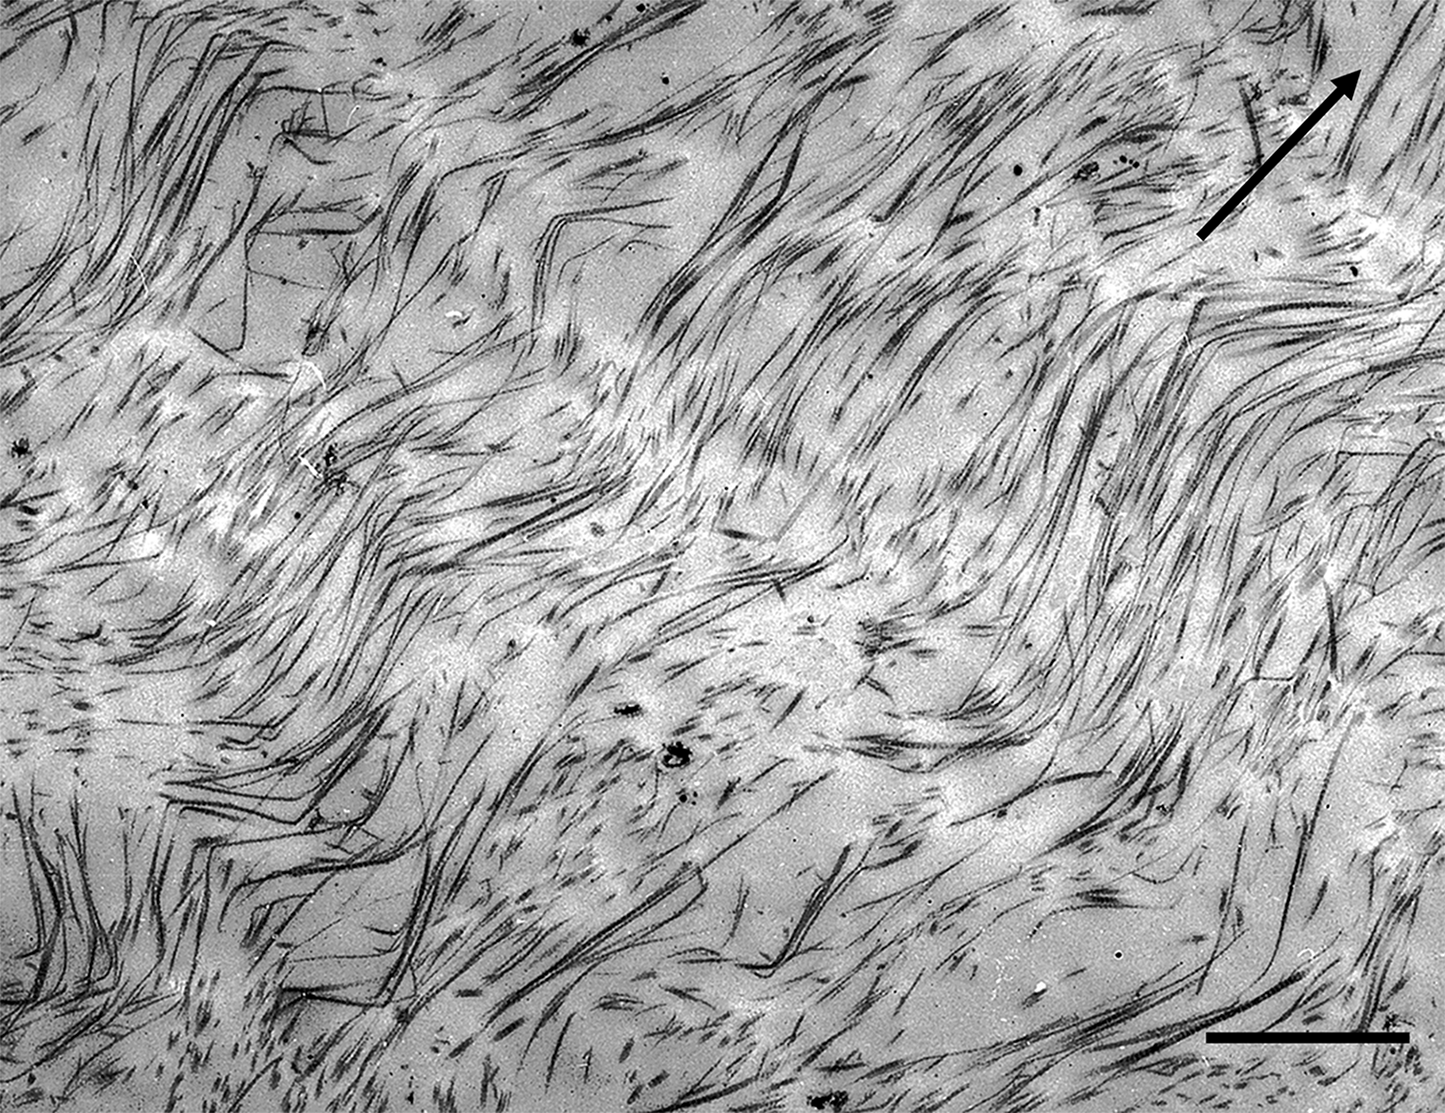
By contrast, the image in Figure 1.8 shows the fibrillar structure in the mid-to-deep zone of cartilage from the bovine tibial plateau, and here the thin section has captured a significant amount of structural continuity. The fibrils, while possessing an in-phase waviness or crimp are, in this instance, mostly aligned in a radial direction that is also contained within the plane of the section. Despite the fact that the images in Figures 1.7 and 1.8 convey two very different collagenous morphologies seen in articular cartilage, both can be unified under the same structural model and this will be discussed in detail in the following two sections.
Relative to TEM imaging the capturing of fibril continuity in cartilage is only marginally less of a problem with SEM. Whether the viewing face of the sample is artificially sectioned or cryo-fractured, it still offers a largely ‘skin-deep’ view of the tissue’s three-dimensional fibrillar architecture. Once a fibril deviates out of the imaged surface plane it is, as with TEM, lost from view. However, with image reconstruction techniques now available it is possible to combine images from serial TEM sections and obtain a much more extended 3-D map of the fibrillar architecture.
1.8 A Fibril-Level Model Integrating Multiple Scales of Evidence
Following on from the earlier TEM- and SEM-based ultra-structural investigations there seemed to be a clear consensus in the literature regarding the orientation of the fibrils in the tangential zone and in the transitional zone immediately below it. However, the question as to whether the overall fibrillar structure in the general matrix (also termed the mid and deep or radial zones) below the transition zone contained vertical or oblique fibrils, or both, remained somewhat unresolved until the issue was addressed using a fundamentally different experimental approach, described next.
1.8.1 Questions Concerning Fibril Continuity and Orientation
If either a TEM thin section or a SEM cut or cryo-fractured surface view of the cartilage general matrix contains fibril segments that lie in a variety of orientations ranging from oblique to vertical, can we assume that these segments are simply part of a much more extended fibril continuity in these same diverse orientations? If this were the case then we would expect such a structural arrangement to be reflected in the directional mechanical properties of the cartilage matrix. If the fibrils in the general matrix (i.e., those in the mid-to-deep zones) were largely random as has been implied by some investigators (see for example Figure 1.5) then we would expect to see a substantial strain-limiting response of the matrix when stretched in tension in all directions corresponding to this spread of orientations. But this is certainly not the case, at least not in the articular cartilage of larger mammalian joints. So, what is the alternative?
1.9 The Pseudo-Random Radial Fibrillar Model
1.9.1 Radial Fibrils: A Structural Priority
The principal evidence challenging the random discontinuous fibrillar view came from several different corroborating experiments. First, Broom (Reference Broom1982) argued on purely microstructural grounds that the changes in fibrosity of the general matrix associated with abnormal softening, as commonly seen in the tibial plateau cartilage of large mammals (see Figure 1.8) including humans, and also in human osteoarthritis (OA) cartilage, are best explained by the transformation of a specific type of fibrillar architecture.
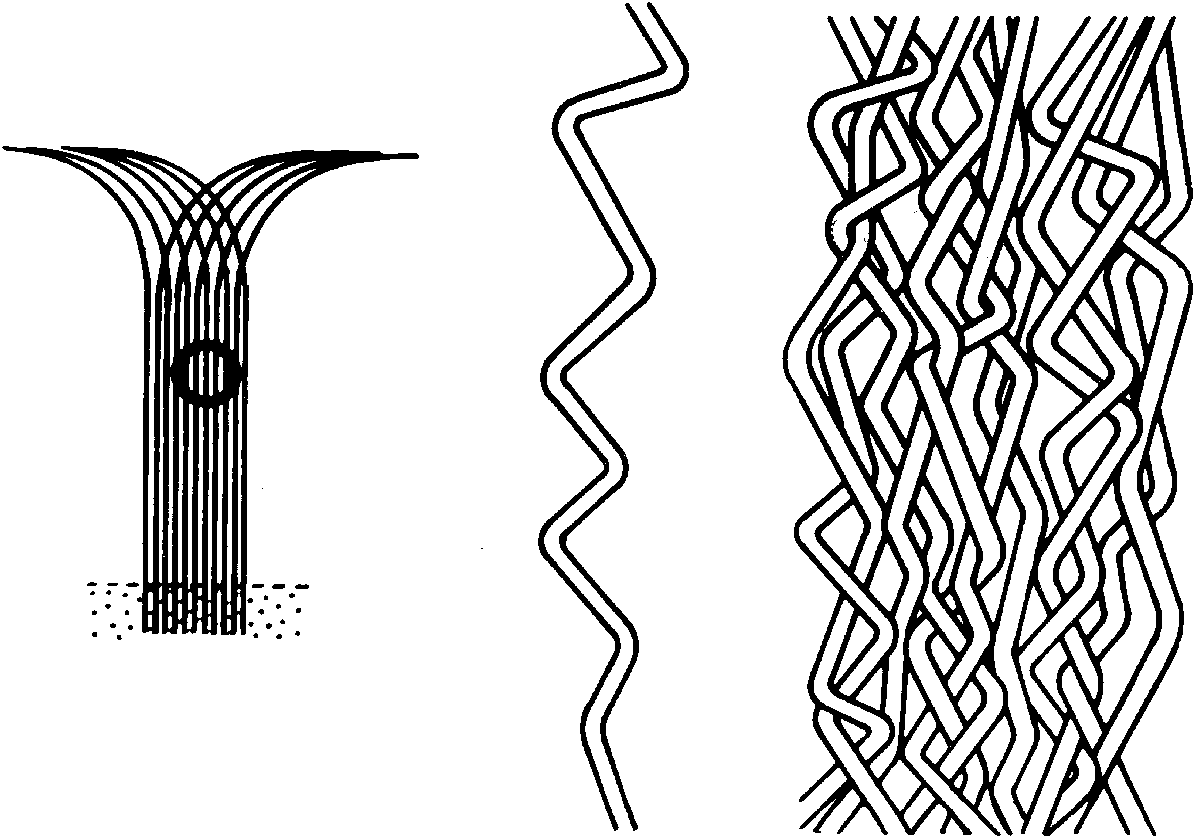
The model Broom (Reference Broom1982) proposed (see Figure 1.9), rather than being formed from fibrillar elements extending long ultra-structural distances in relatively random orientations, was instead built from fibrils that possessed a long-range radial orientation and thus in keeping with the spirit of Benninghoff’s original scheme (Figure 1.4), but whose segments are repeatedly deflected sideways such that a pseudo-randomness is achieved. Built up into an array formed by many such elements, a highly interconnected fibrillar architecture is created within which the high-swelling proteoglycans can be constrained.
Schematic of fibril model of articular cartilage proposed by Broom (Reference Broom1982). While possessing an overall radial configuration (LH image) the fibrils also have a repeating obliquity and thus collectively constitute a pseudo-random configuration (middle and RH images).
1.9.2 Evidence from Micro-Mechanical Rupture Propagations Studies
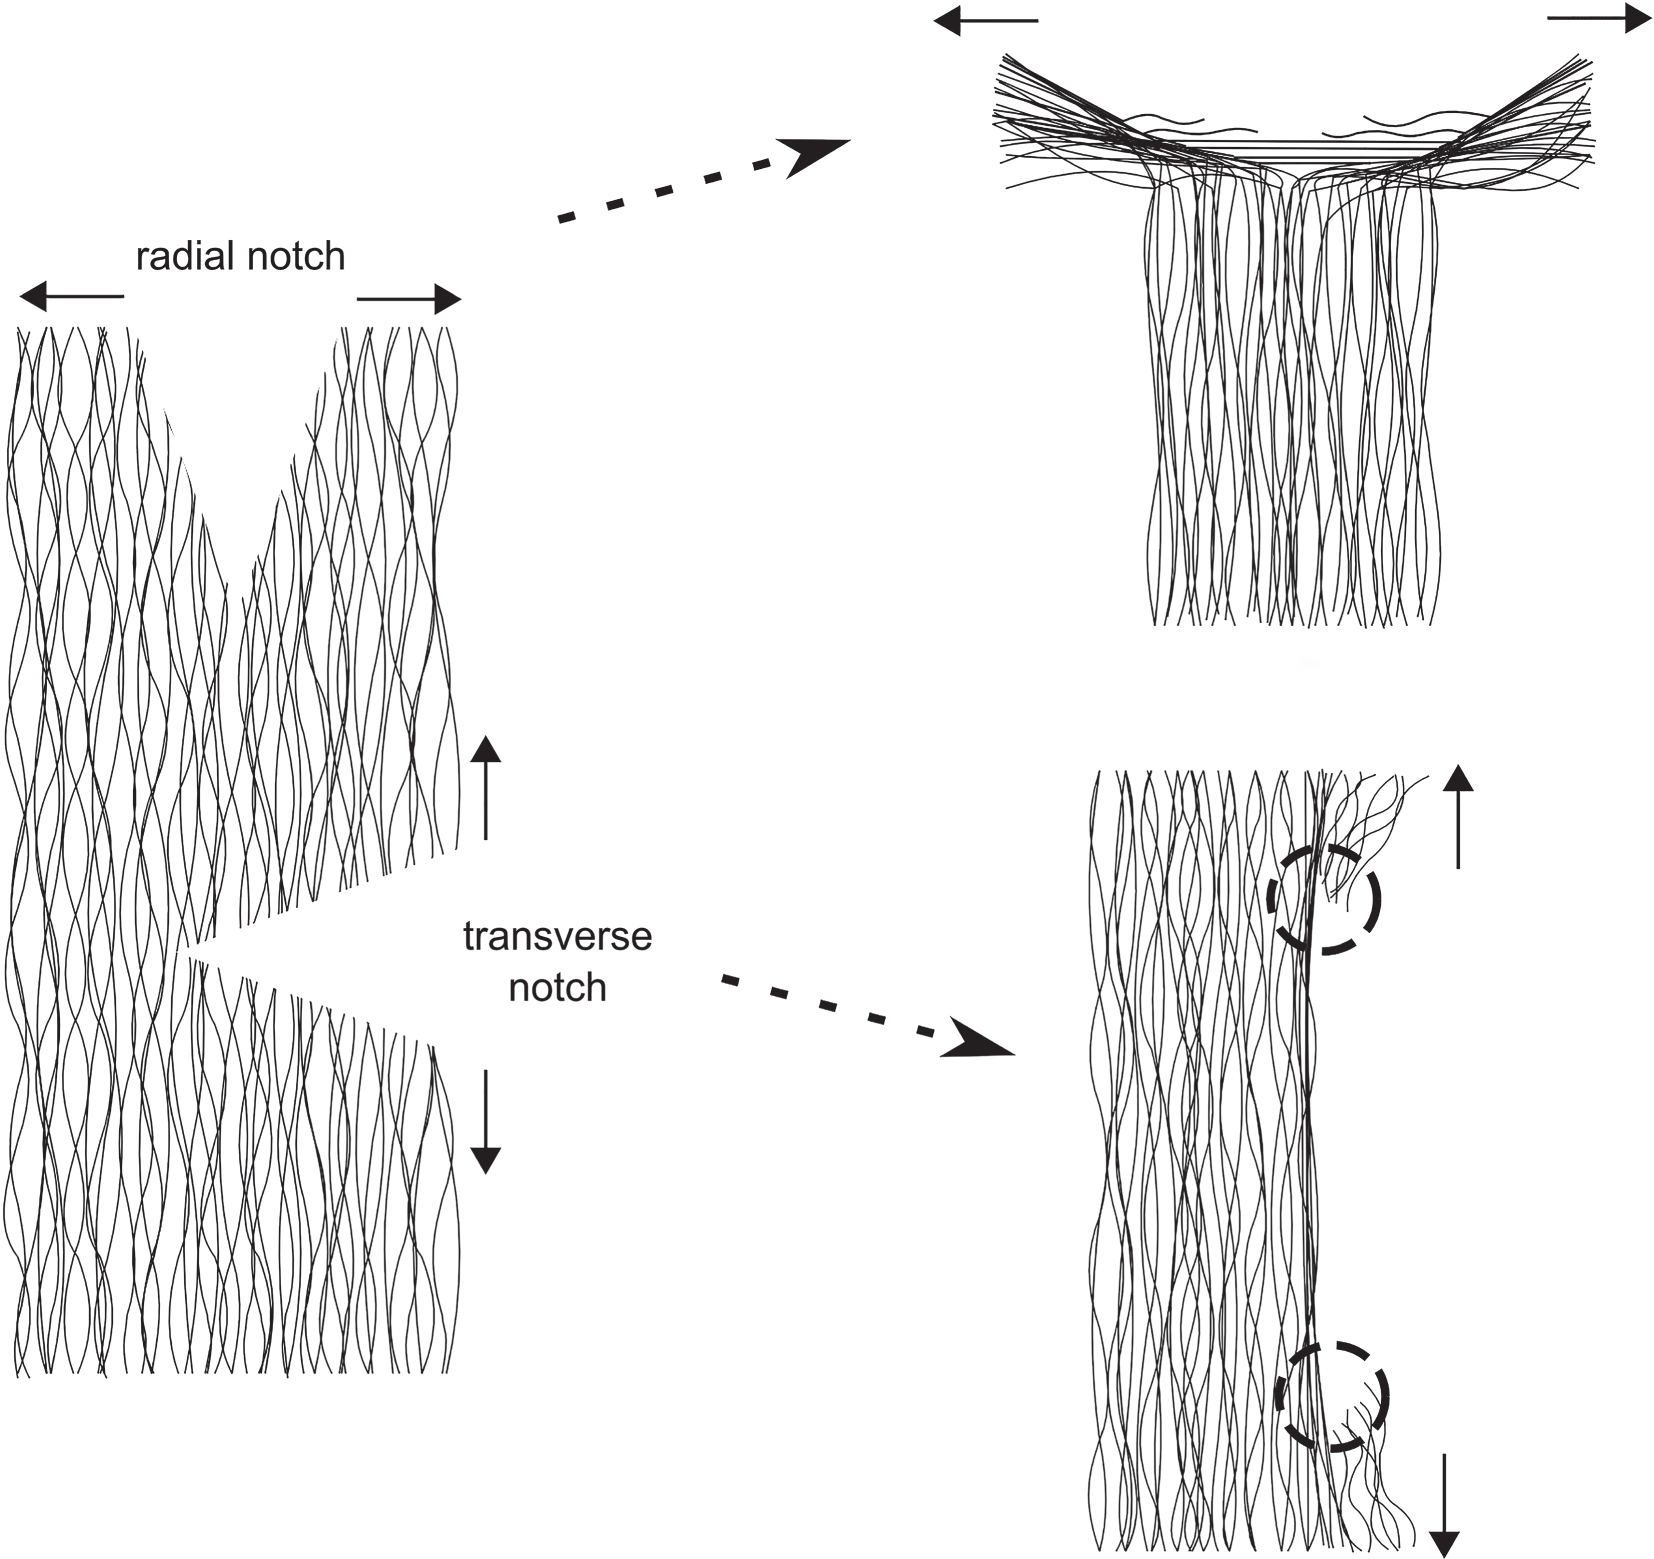
The second piece of evidence in support of the pseudo-random model comes from a series of micro-rupture propagation experiments conducted on full-depth, fully hydrated slices of fresh bovine articular cartilage by Broom (Reference Broom1984a) in which a small cut or notch was introduced such that its tip was located in the mid-zone matrix and either directed radially or transversely (Figure 1.10a). Employing a micro-mechanical tensile device that fitted on the stage of a DIC optical microscope, both the relative rupture forces and the micro-morphology of the matrix undergoing rupture at the tip of the notch in these two orthogonal directions was observed. This study demonstrated that whereas stable rupture propagation in the radial direction was achieved with relative ease when a tensile opening force was applied to the slice (see Figure 1.10b), no equivalent rupture propagation was possible in the transverse direction with the transverse notch. Instead, in the latter the rupture path was always deflected into a skewed radial tear direction and usually at the extremities of the stretched notch tip (see black arrowed sites in Figure 1.10c).
Schematics illustrating technique originally used by Broom (Reference Broom1984a) to propagate either a radially or transversely directed rupture through the general matrix of fully hydrated slices of articular cartilage while simultaneously imaging its response microscopically using differential interference contrast microscopy.
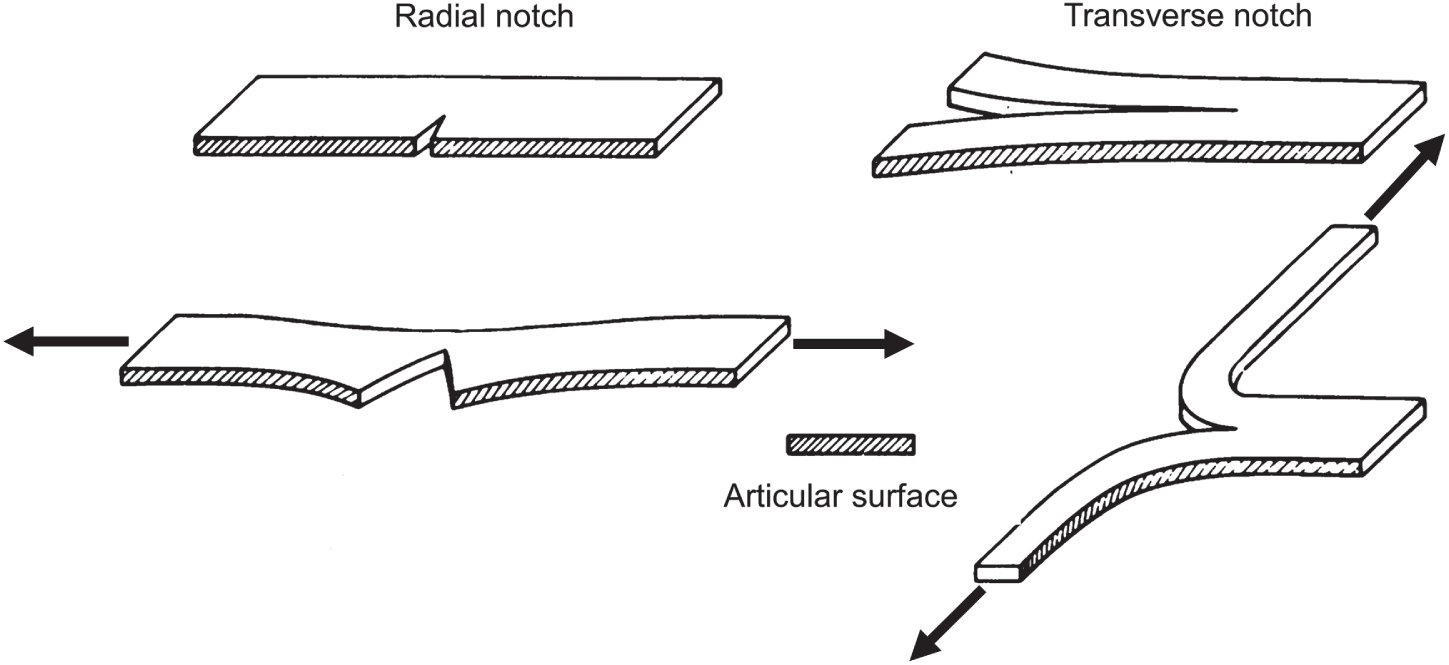
Image illustrating the structural response of the mid-to-deep zone matrix to rupture with propagation in the radial direction. White arrows indicate tensile loading direction. Scale bar is ~100 µm.
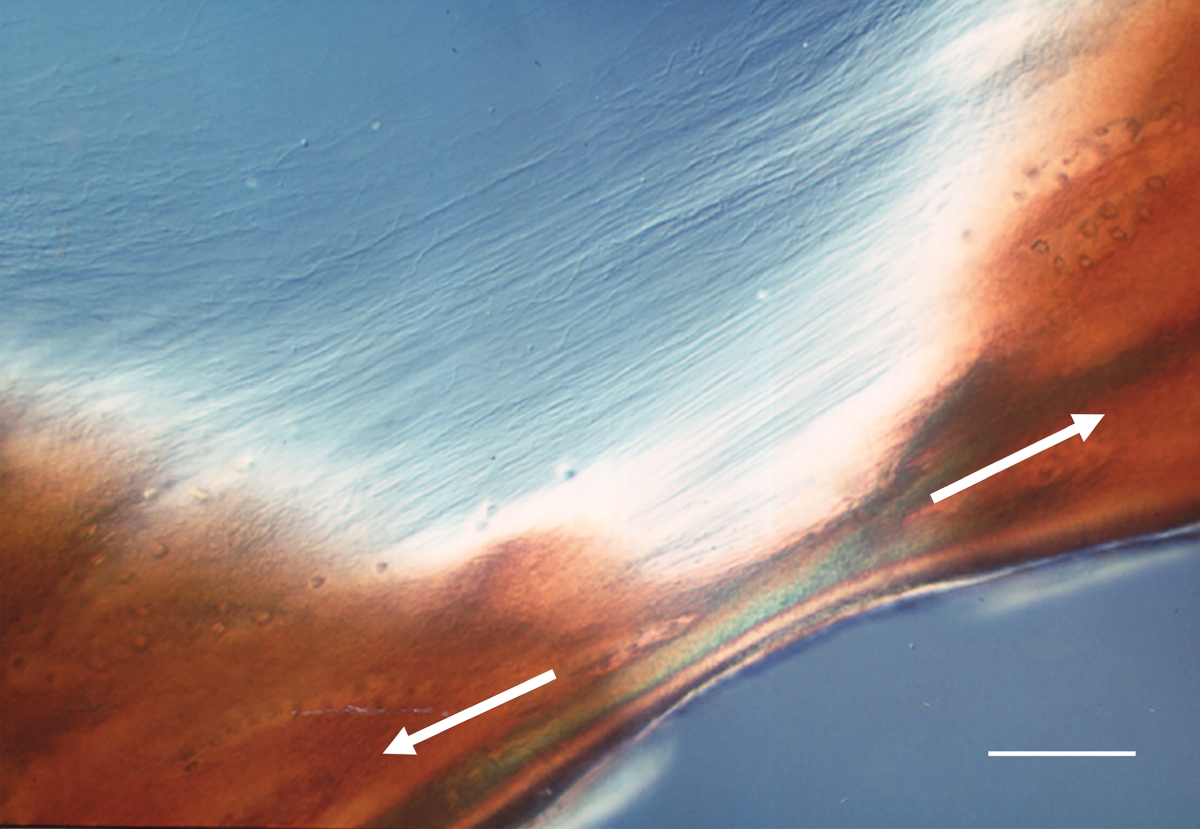
Image illustrating the contrasting structural response to rupture in the mid-zone matrix when propagation is attempted in the transverse direction. White arrows indicate tensile loading direction. Black arrows indicate sites where a skewed form of radial tearing occurs rather than direct transverse propagation. Scale bar is ~100 µm.
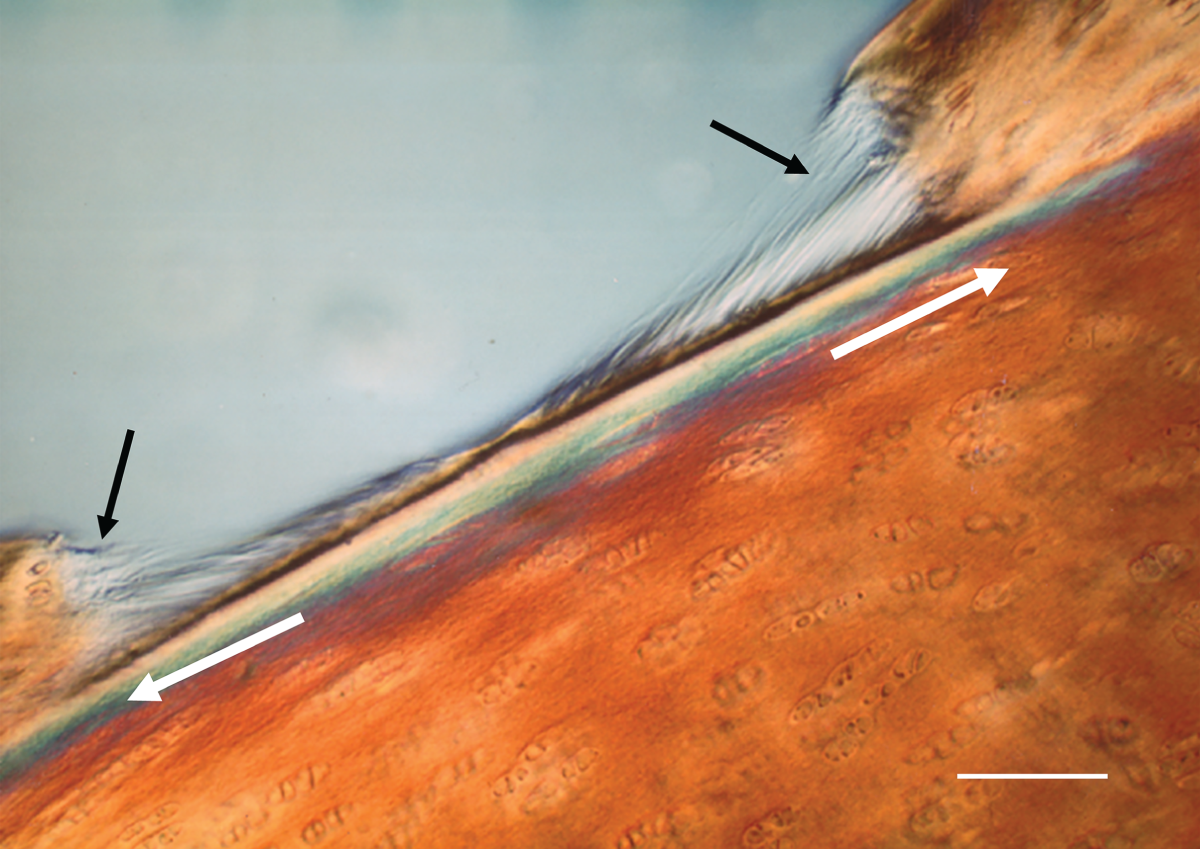
These micro-mechanical experiments established that the general matrix of articular cartilage has highly directional strength and extensivity properties consistent with the pseudo-random model illustrated in Figure 1.9. In this structural scheme the radial notch propagates in a stable manner by effectively splitting the matrix along the primary ‘grain’ direction created by the radially directed fibrils (see RH upper schematic in Figure 1.10d). Where they interconnect they are drawn into a transverse alignment across the propagating notch tip before eventually rupturing (see Figure 1.10b). By contrast, the transverse notch can only propagate transversely if the radial fibrils are actually ruptured and this is very difficult to achieve in the healthy matrix. Instead, we observe a skewed radial tearing at either or both ends of the opened-out notch (see black arrows in Figure 1.10c and circled sites in RH lower schematic in Figure 1.10d).
Schematics providing a fibril-level interpretation of the two very different responses of the mid-zone matrix to rupture in radial and transverse directions.
Interestingly, Broom (Reference Broom1984b) observed a quite different response to transverse rupture propagation in the osteoarthritic general matrix. Instead of the notch reverting to a form of skewed radial tearing as occurred in the healthy matrix, in the degenerate matrix transverse propagation was observed and, thus, indicates that there is a significant reduction in the axial strength of the collagen fibrils in this matrix.
1.9.3 Evidence from Enzymically and Traumatically Induced Structural Transformation
The third piece of evidence supporting the pseudo-random model comes from structural transformation experiments in which the healthy matrix was subjected to two different kinds of disturbance, one biochemical and the other mechanical.
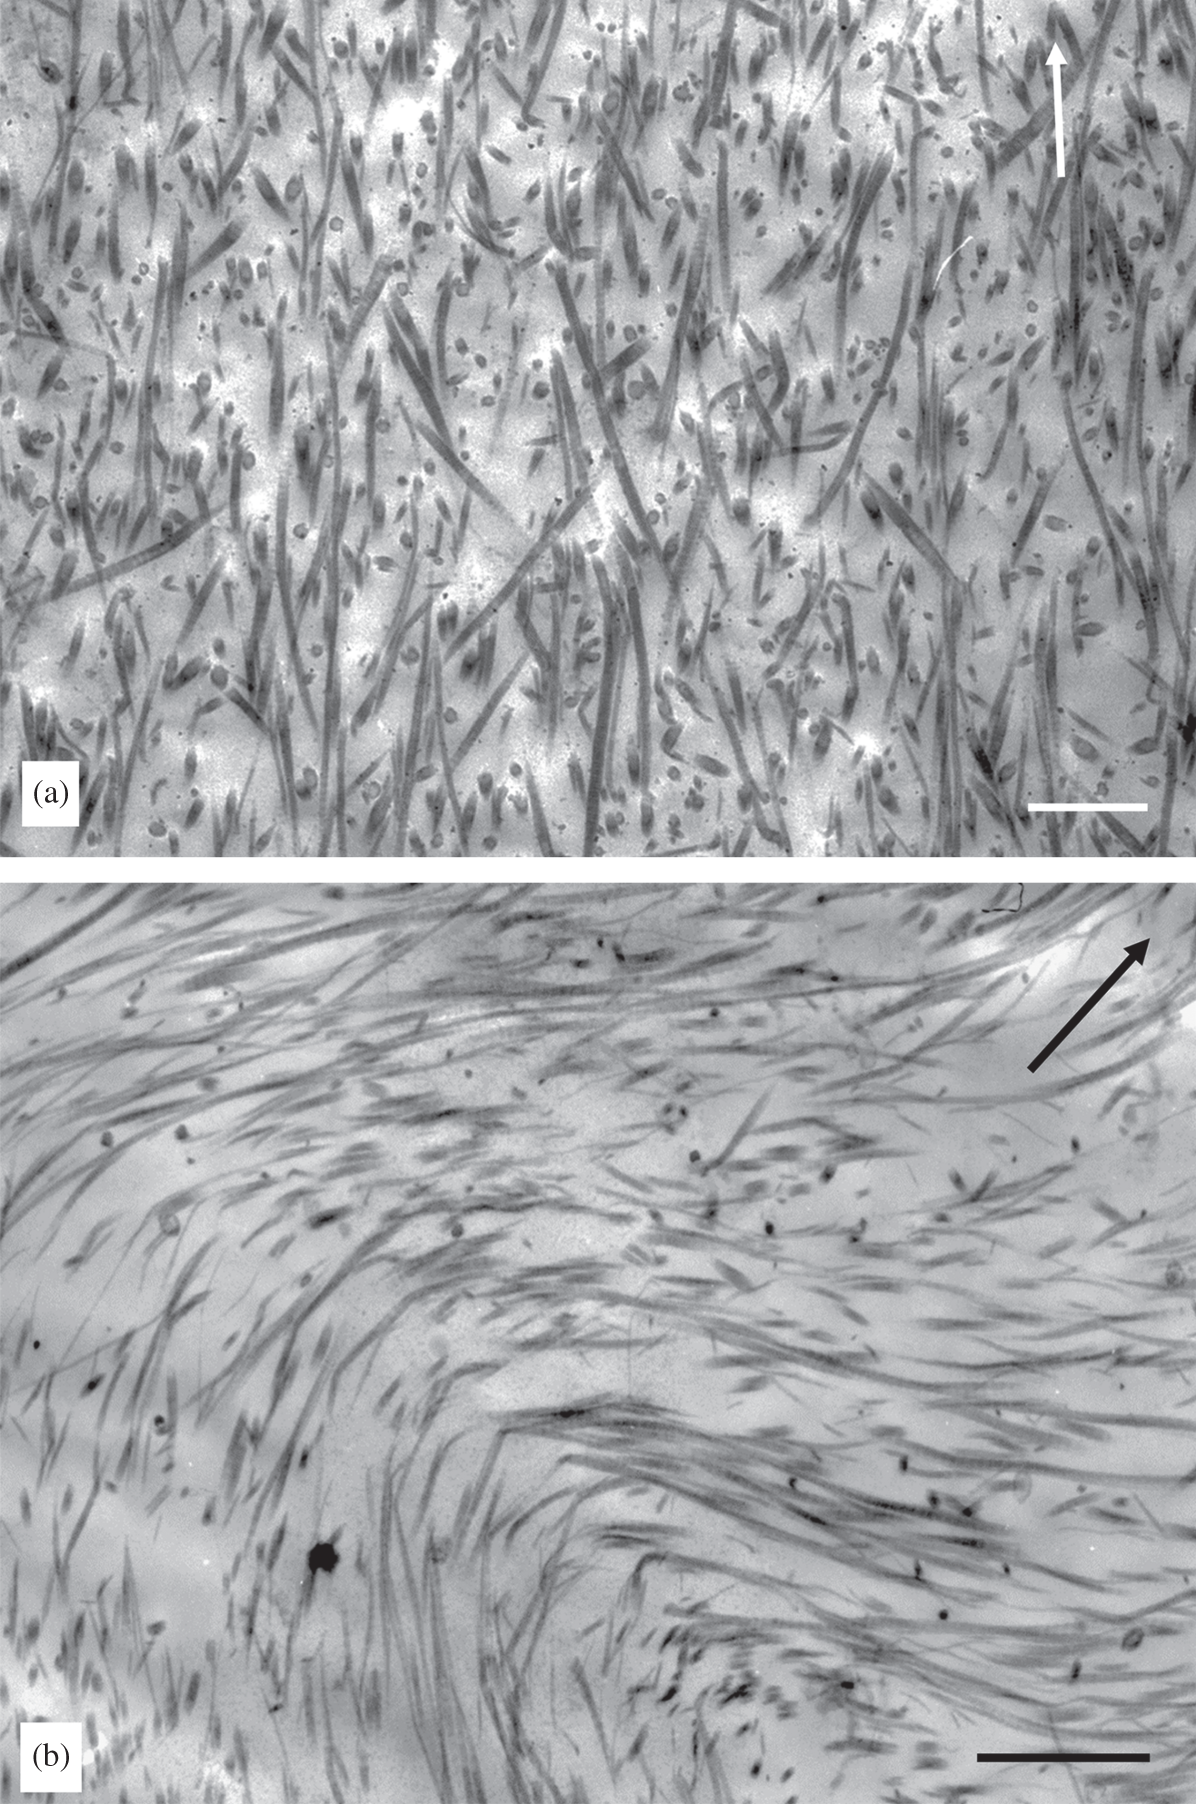
For the biochemical transformation study, Broom (Reference Broom1988) took healthy sections of fully hydrated fresh articular cartilage and first degraded the proteoglycans followed by a limited exposure of the tissue to collagenase digestion. The pseudo-random fibrillar network in the normal matrix was shown to transform into a strongly aligned and crimped radial configuration (Figure 1.11).
(a) Normal mid-zone fibril structure of bovine articular cartilage showing pseudo-random fibrillar structure but with overall radial continuity artificially lost in the TEM thin section. (b) Matrix as in (a) but enzymically treated and illustrating how the fibrillar network has been transformed into a strongly aligned and crimped radial configuration. Arrows indicate approximate radial direction. Scale bars = 1 µm.
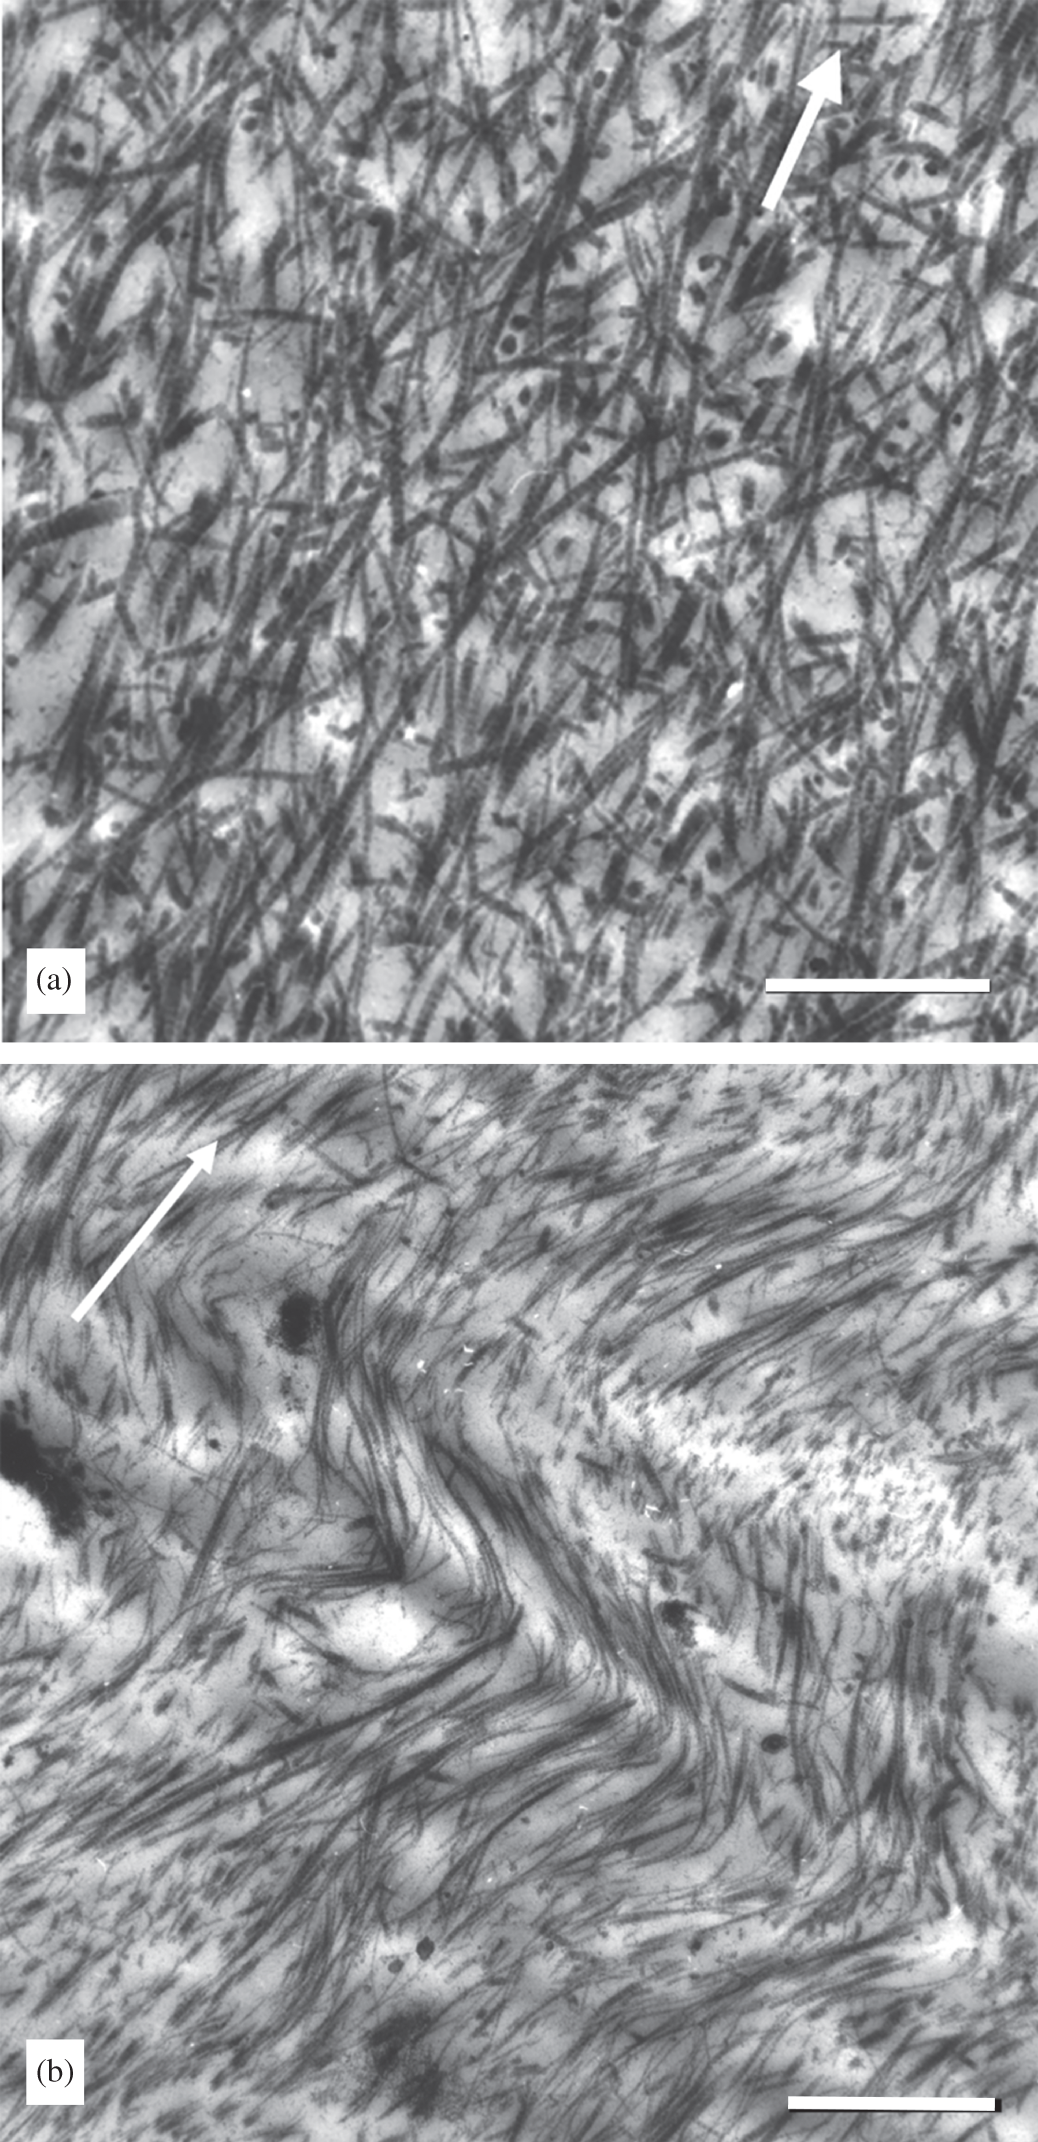
In the mechanical transformation study, Broom (Reference Broom1986) took healthy cartilage-on-bone samples and then repeatedly impacted them until there was evidence of some articular surface disruption. Again, it was demonstrated that a similar fibrillar transformation from the primary pseudo-random configuration to a strongly aligned one could be induced by mechanical means (Figure 1.12).
TEM images illustrating mechanically induced transformation of the normal pseudo-random fibrillar network (see a) into a strongly aligned and crimped configuration (see b). Arrow indicates radial direction. Scale bars are 1 µm and 4 µm respectively.
It is probably impossible to trace ultra-structurally the entire length of the radial fibrils and thus demonstrate their continuity from the calcified cartilage zone right up into the tangential zone as idealised both in the original Benninghoff model (Figure 1.4) and in the pseudo-random model illustrated in Figure 1.9. However, the highly directional strain-limiting and rupture-propagation properties of the general matrix beneath the transition zone (see Figure 1.10), together with evidence from the enzymic and trauma-induced structural transformation studies, is entirely consistent with there being a primary radial array that has the appearance of having varying degrees of randomness due to a repeating segmental obliquity in the individual fibrils, as proposed in Figure 1.9b and c.
1.9.4 Fibrillar Network Connectivity and Implausibility of Fibre Composite Theory
A major difficulty with any discontinuous fibril model concerns how network interconnectivity is achieved so as to provide a level of matrix cohesion that matches the mechanical robustness of cartilage. One approach has been to conceptualise the articular cartilage matrix as a biological example of a fibre-reinforced composite system in which load is transferred from one fibre element to another via a mechanism of shear-stress transfer. This requires a matrix that has an intimate bonding relationship with the fibres, with the strength of this bond determining the level of shear stress that can be transmitted across the matrix-fibre interface and, therefore, from one discontinuous fibre to another.
For a given interface bond strength, the total load that can be transferred across the fibre-matrix interface will be determined by the interface area and will therefore be proportional to the length of the fibre of a given diameter. A higher interface shear bond strength means that a shorter fibre length can used to transfer the same level of load as that for a longer fibre in a fibre-matrix system with a reduced shear bond strength. Thus, the fibres need not be continuous, but only of a length sufficient to permit the transfer of the given level of the applied load. It is important to emphasise that the primary goal in such composite systems is to achieve very high levels of stiffness, strength and resistance to sudden fracture (i.e., high fracture toughness) by combining, in a special way, two quite disparate elements – namely the high strength and high stiffness fibre and the less stiff and more ductile matrix.
In applying the above composite theory to the articular cartilage matrix, it has been suggested that interactions between the proteoglycan complexes and the collagen fibrils will serve as the shear stress transfer mechanism and thus provide the primary cohesive strength in the matrix (see e.g., Hukins et al. Reference Hukins, Aspden and Yarker1984; Hukins and Aspden Reference Hukins and Aspden1985; Parry and Craig Reference Parry, Craig and Nimni1988). However, the shear stress transfer mechanism that generates the high strength in fibre-reinforced composite systems relies on the maintenance of strain compatibility between the fibre (the strong, stiff component) and the weaker, less stiff matrix component, i.e., there should be no relative movement between the two components: any movement will signal interface bond failure – this referred to as de-bonding – and failure of the composite.
The above conditions will hardly be met in the cartilage composite system. The normal functional range of behaviour of articular cartilage involves major reversible shape changes in the collagenous network that will inevitably involve extensive shearing of the non-fibrillar, heavily hydrated, matrix components. In other words, we have a ‘soft’ composite system that has no functional resemblance to the high-modulus, fibre-reinforced composite system described above. The composite nature of articular cartilage is much more akin to a three-dimensional string network embedded in a soft jelly-like matrix – a composite combination that will not produce high modulus properties. Rather, the mechanical properties of such a system will be determined by the considerable extensibility of the string network and the degree of interconnectivity of its individual elements, with its strain response slowed down by the viscous drag in the network created by the embedding jelly.
Experimental demonstration of the inadequacy of fibril-proteoglycan interactions to account for the strength of the cartilage matrix was, in fact, provided in a study by Broom and Silyn-Roberts (Reference Broom and Silyn-Roberts1990) in which they conducted two related micro-mechanical experiments to measure both the compressive stiffness and transverse cohesive strength of 200 µm-thick full-depth slices of normal intact bovine articular cartilage matrix both prior to and following proteoglycan removal. As would be expected, proteoglycan removal resulted in an almost total compressive collapse of the cartilage matrix whereas its transverse cohesive strength was largely unaffected. These authors, therefore, concluded that the cohesive strength of the general matrix results from some form of fibril-to-fibril linkage that is largely independent of the interactions known to exist between the fibrils and the proteoglycans.
1.10 Fibril Interconnectivity: Is It Entwinement or Non-Entwinement Based?
While it can be demonstrated experimentally that the fibrillar network in the cartilage general matrix must incorporate some form of transverse interconnectivity, it is much less clear how this is achieved. The original pseudo-random model proposed by Broom (Reference Broom1982) incorporated a straightforward entwinement mechanism (Figure 1.9) but clearly any large-scale destructuring into near-parallel fibril arrays – as illustrated for example in Figures 1.11 and 1.12 – would be impossible unless this entwinement could be somehow uncoupled.
1.10.1 How Important is Fibril Entwinement as a Mechanism for Interconnectivity?
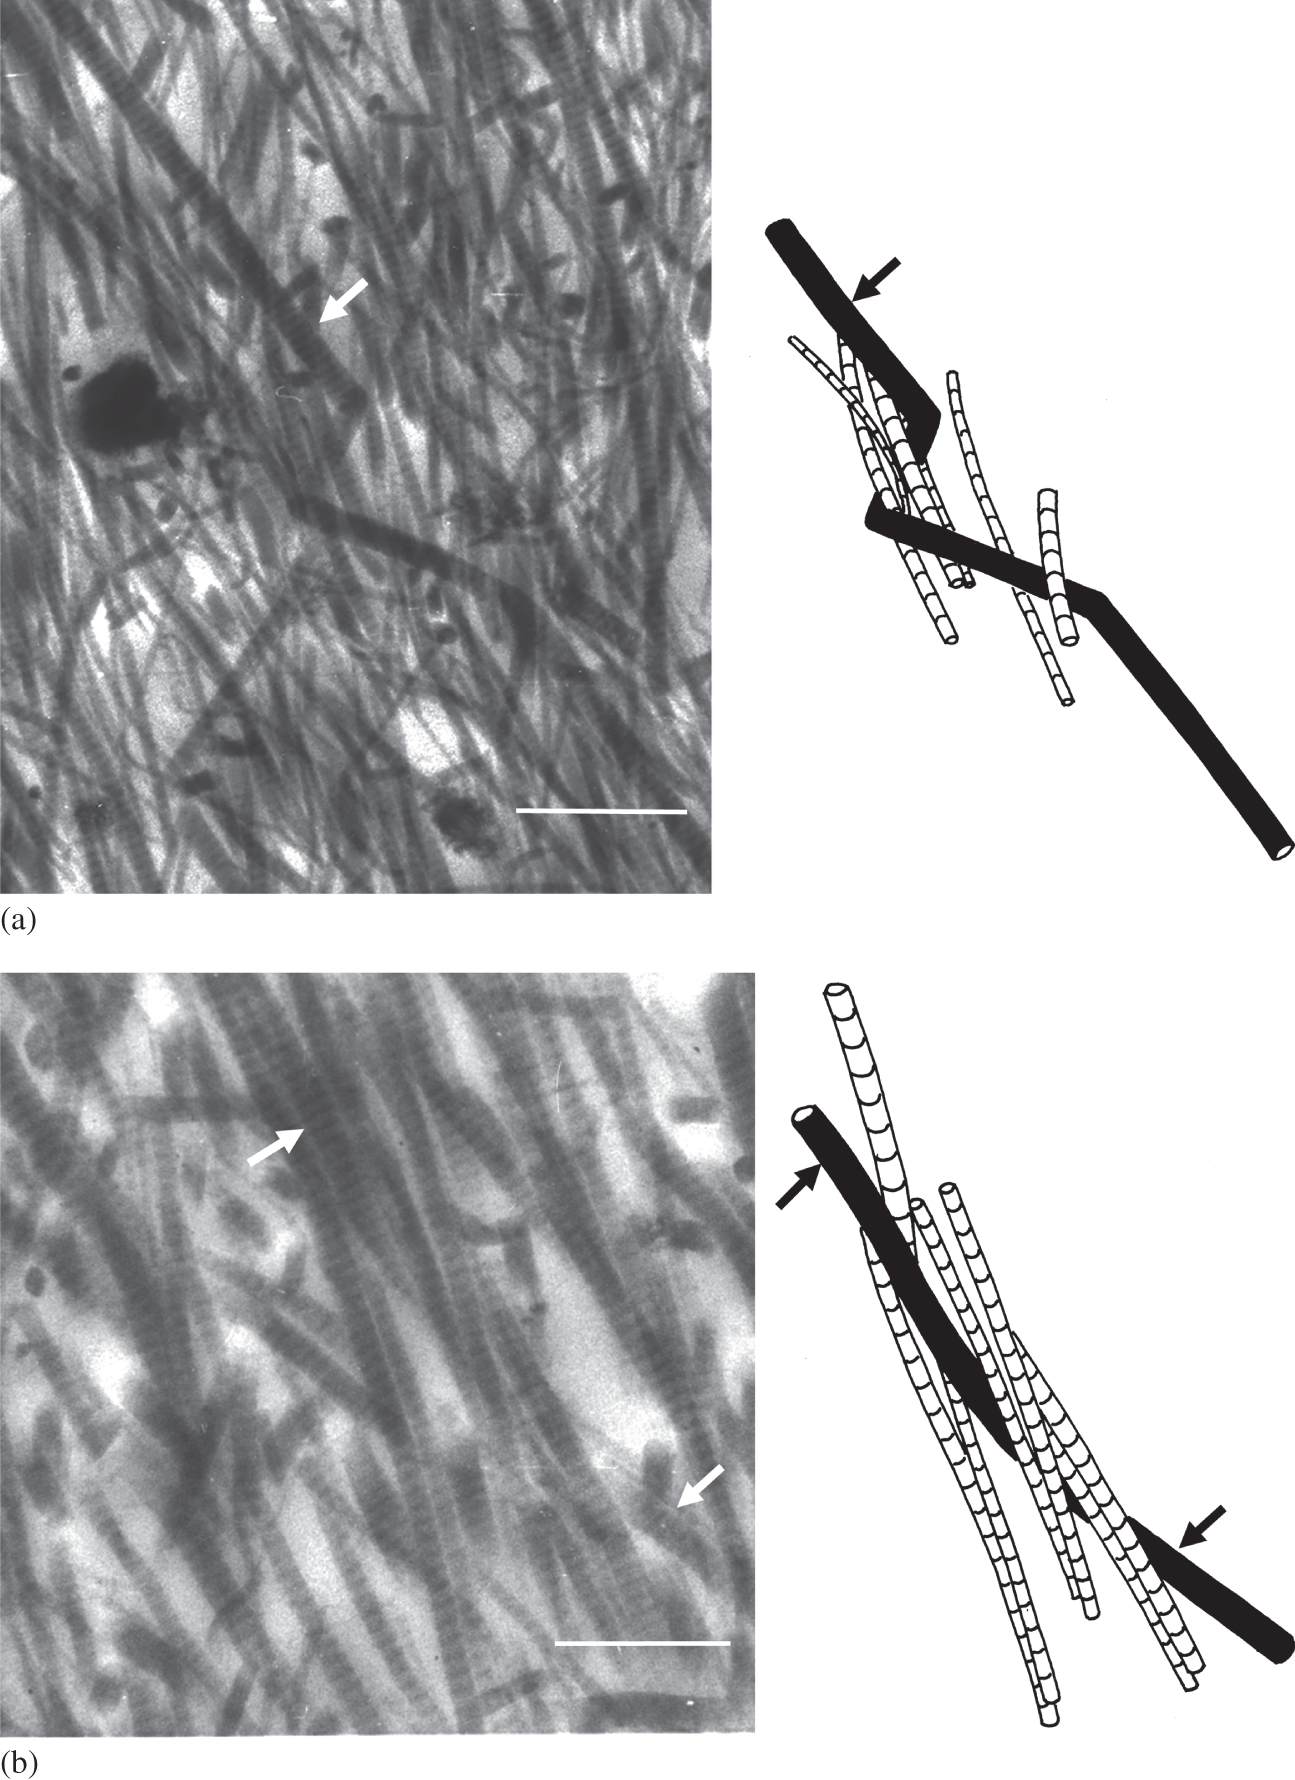
By employing relatively thick sections (2–8 µm) and higher voltage TEM imaging (120 kV) to obtain stereo image pairs Broom and Silyn-Roberts (Reference 357Broom and Silyn-Roberts1989) were able to trace fibrils over a greater distance than would be possible in conventional thin sections (<100 nm). With stereo-image reconstruction they identified a number of inter-fibril relationships in three dimensions. Because a greater amount of fibrillar material was inevitably incorporated within the depth of their thicker TEM sections the task of tracing multiple relationships did pose a significant challenge. However, by using this imaging technique Broom and Silyn-Roberts were able to identify a spectrum of inter-fibril relationships that included both direct physical entwinement between fibrils (see Figure 1.13a–d) as well more complex nodal clusters involving the close, but transient, association of multiple fibrillar elements (see Figure 1.13e). Interestingly, they were unable to establish that entwinement was a major mechanism for achieving transverse interconnectivity in the articular cartilage matrix.
TEM images of the mid-zone matrix of bovine articular cartilage with near-exact schematic reconstructions of specific fibril elements obtained from the analysis of stereo image pairs. Image sets a to d are examples of obvious fibril entwinement. Image set e is an example of complex nodal clusters involving the transient interaction between multiple fibrillar elements. Arrows in each image-set identify corresponding fibrillar features. Scale bar = 1 µm.
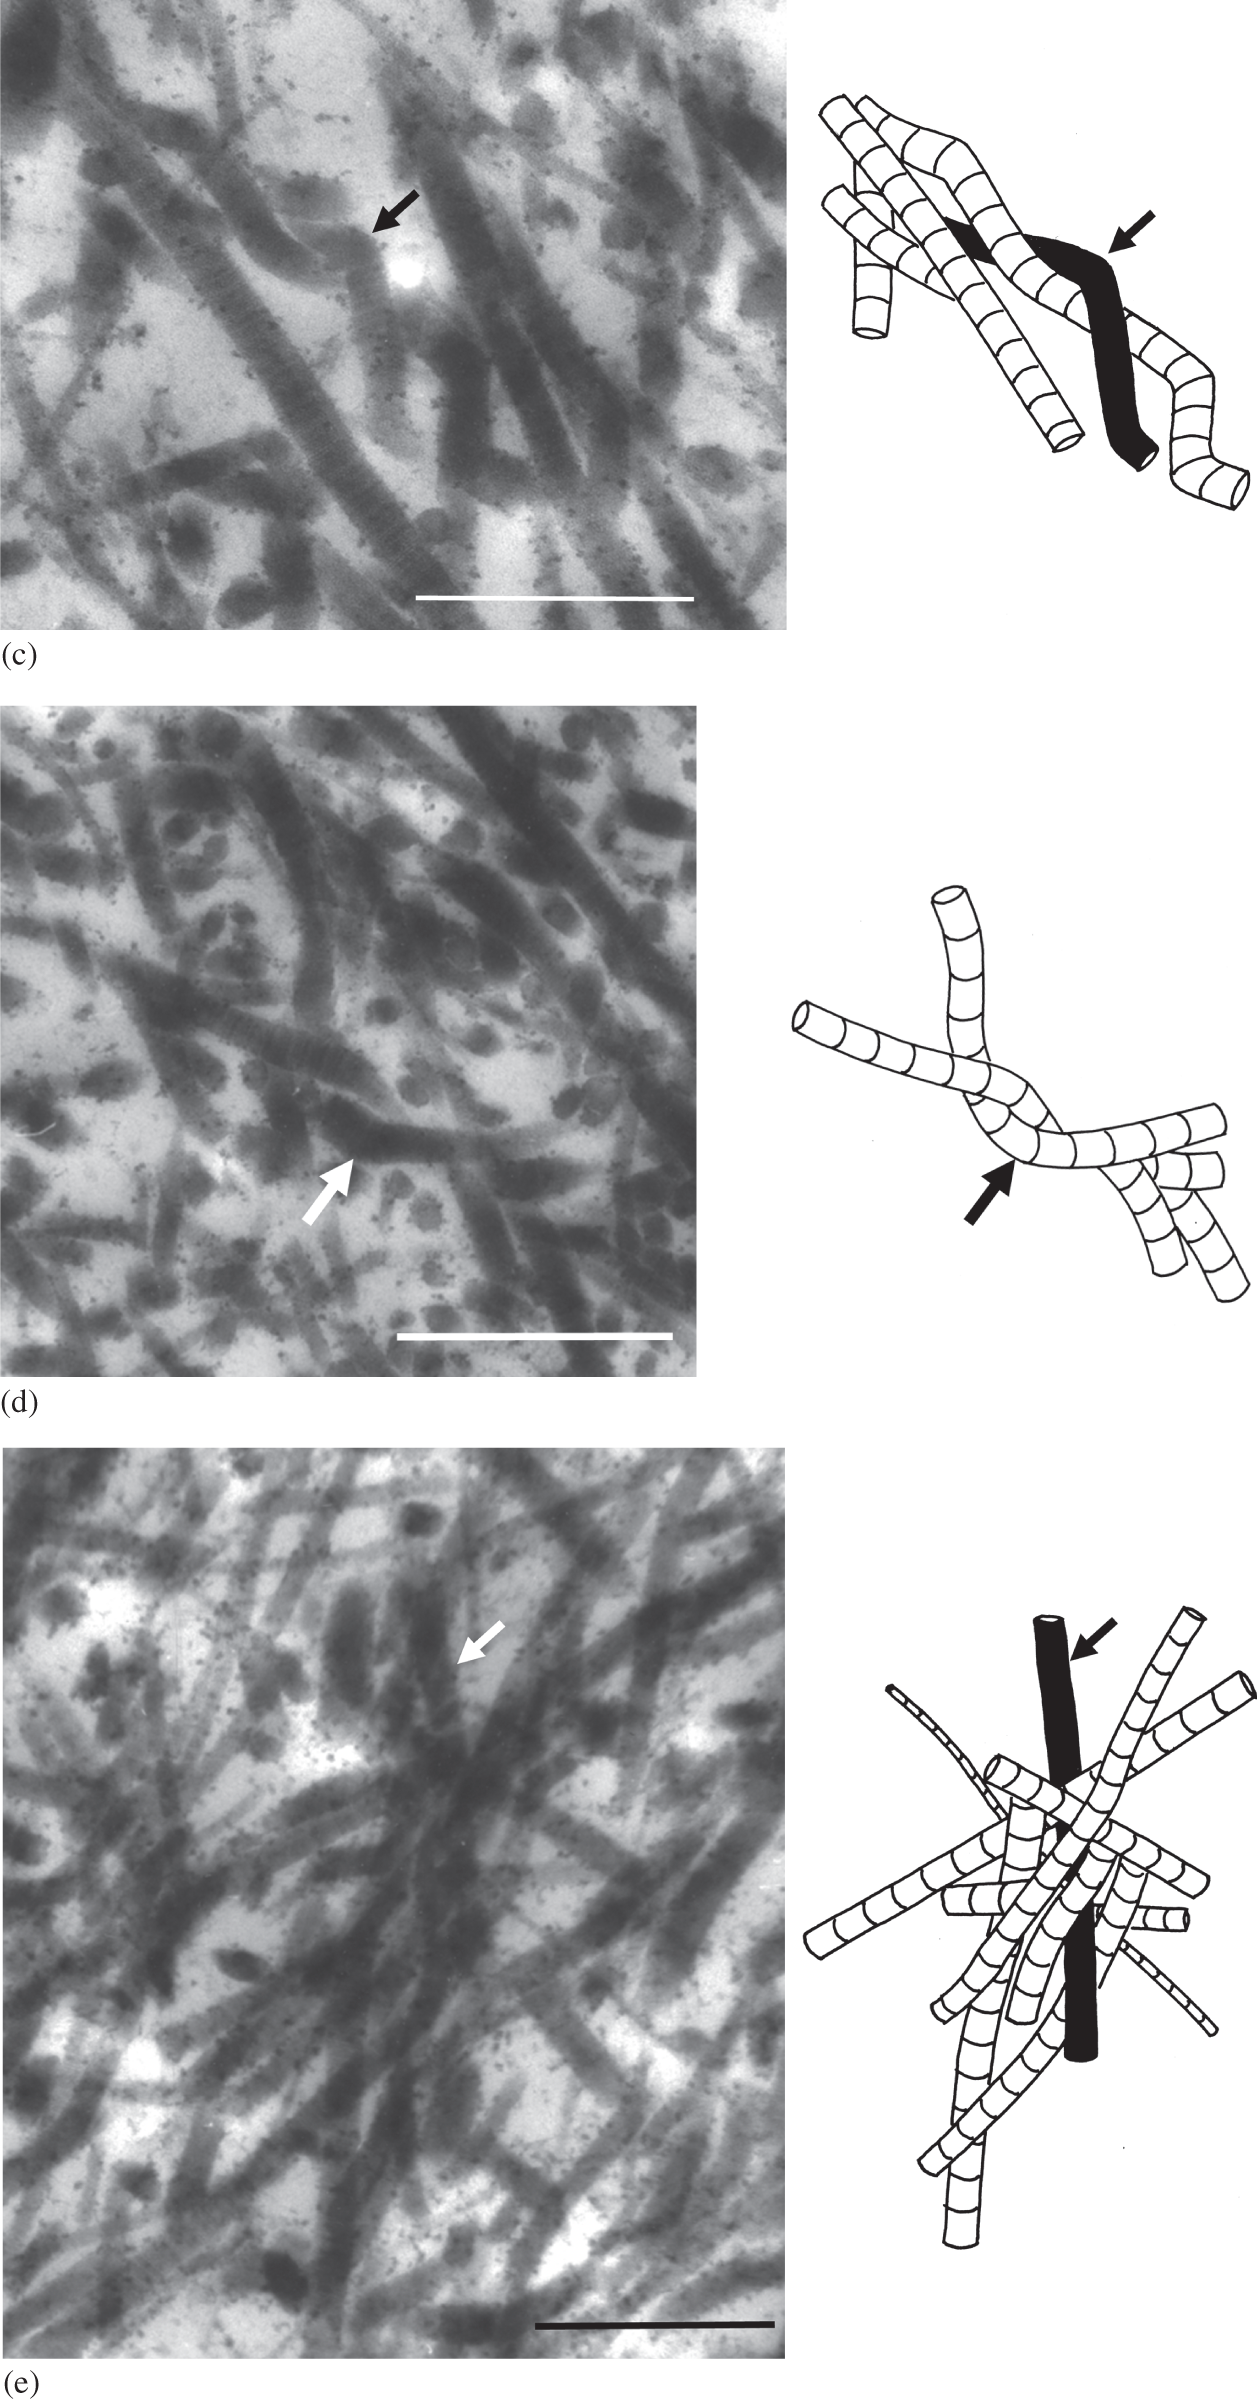
The study did, however, provide added structural support for the pseudo-random fibril model. By transversely stretching samples of the general matrix not constrained by any attachment to either the strain-limiting articular surface or subchondral bone, followed by in situ chemical fixation in this stretched state, Broom and Silyn-Roberts (Reference 357Broom and Silyn-Roberts1989) were able to induce secondary contractile strains in the radial direction and accentuate dramatically the repeating segmental obliquity of the radial fibrils as is illustrated in Figures 1.14a and b. Again, while these TEM thick sections greatly increase the amount of sub-structure imaged, the interpretative advantages of being able to track fibril continuity over moderate ultra-structural distances should be obvious.
Two sets of image-schematic pairs as in Figure 1.13 but from a mid-zone matrix that has been transversely stretched. The resulting radial contraction has accentuated the repeating segmental obliquity of the fibrils along with their primary direction of alignment, the arrows in set a marking this feature in a single fibril element. Set b incorporates a complex nodal interaction. Scale bar = 1 µm.
1.10.2 Fibril-Level Structure Suggests the Pre-Eminence of Non-Entwinement-Based Interconnectivity
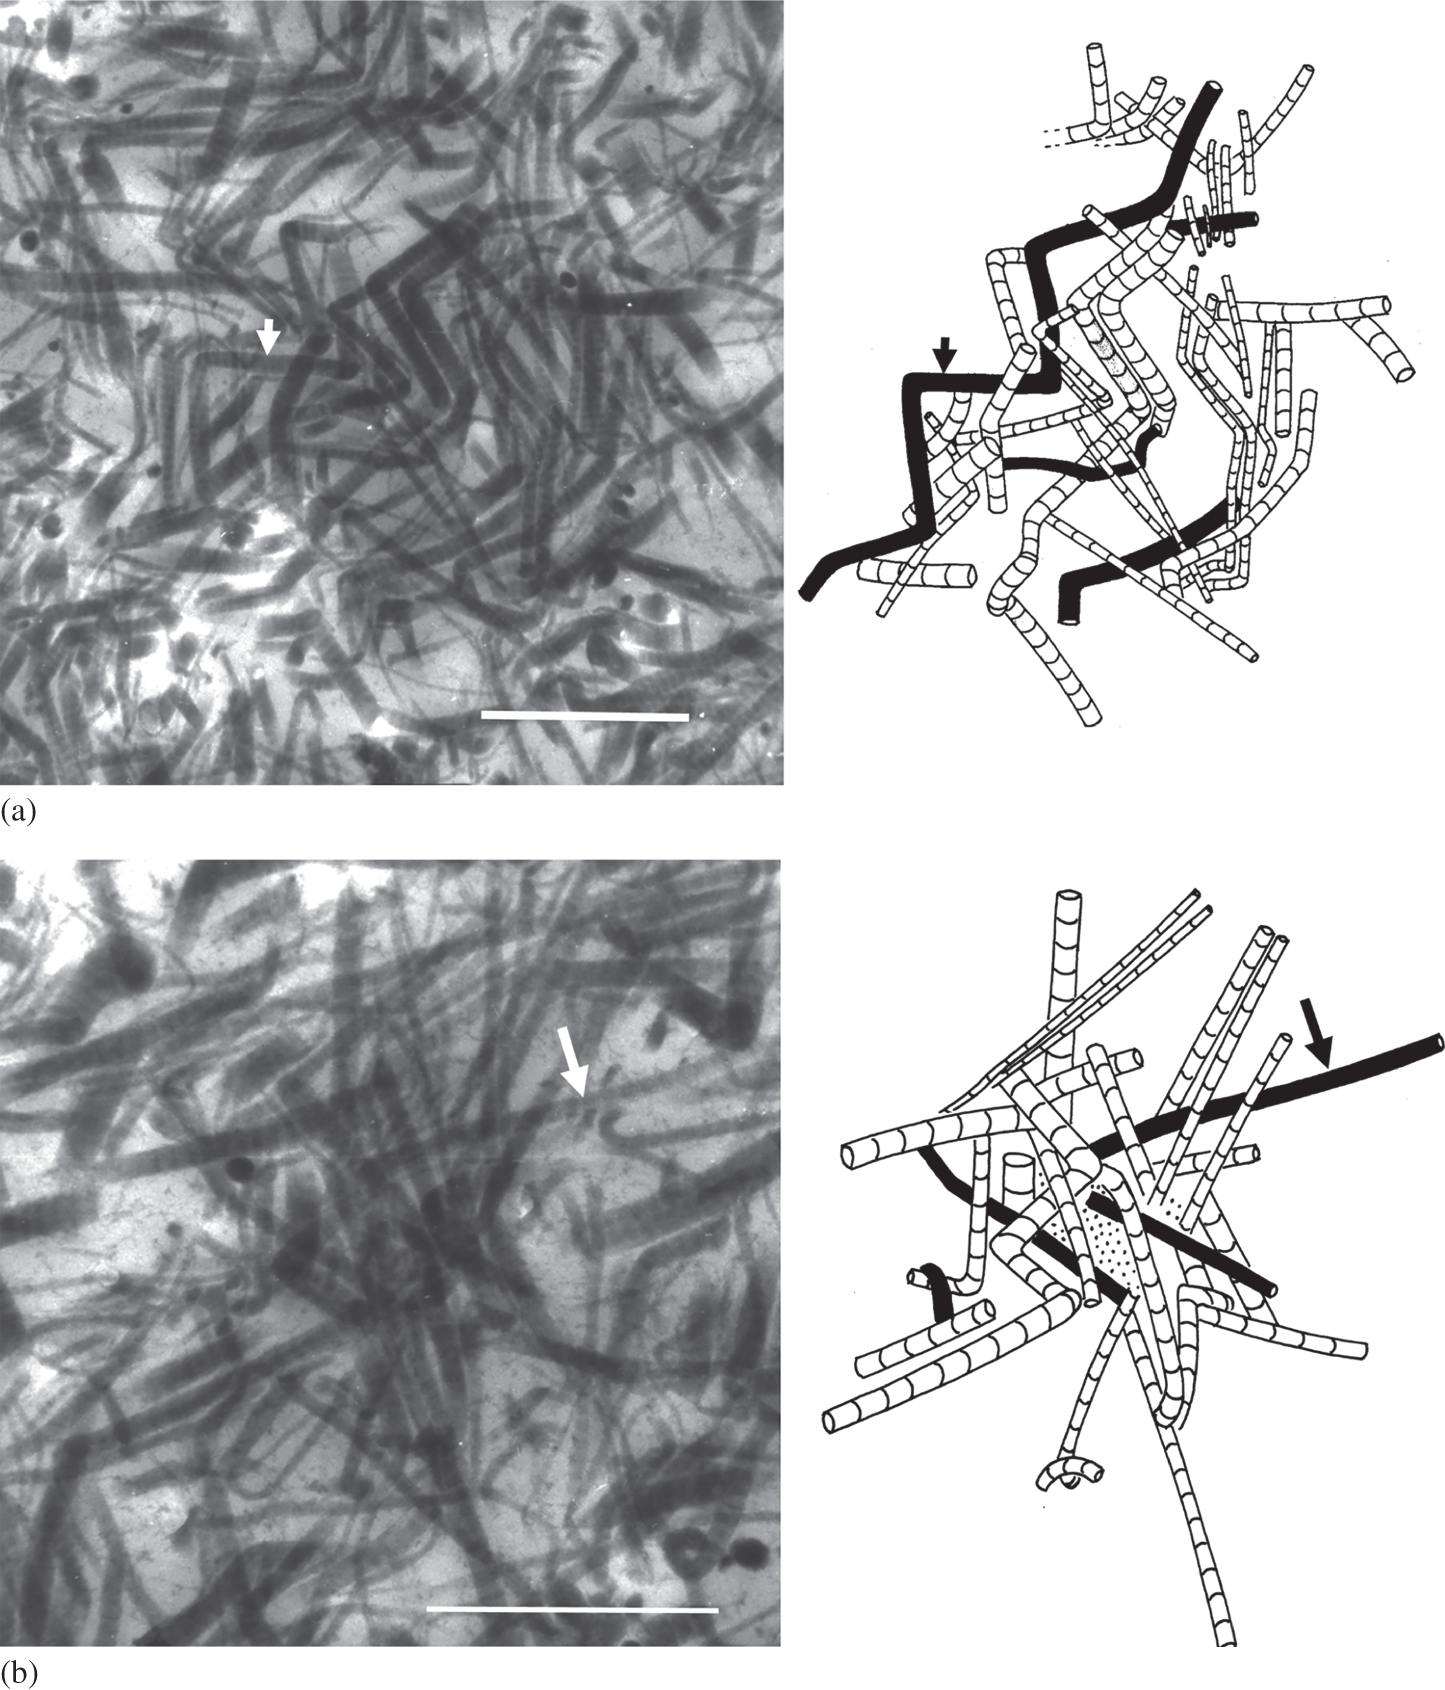
Another TEM-based study by Broom and Marra (Reference Broom and Marra1986) provided additional evidence of fibrils in the general matrix having a close but transient nodal association along their lengths (see Figure 1.15). Although this study did not employ the 3-D image reconstruction technique used by Broom and Silyn-Roberts (Reference 357Broom and Silyn-Roberts1989), these nodes did not seem to involve any extensive element of entwinement. Rather, multiple fibrils appear to come into close association over a relatively short distance along their overall radial direction of alignment before deflecting and exiting the ultra-thin section plane (~100 nm) and losing their imaged continuity.
TEM image of mid-zone articular cartilage matrix showing multiple fibril segments clustering in a transient manner to form nodes. Arrow indicates radial direction; scale bar = 1 µm.
1.10.3 A Fibril-Based Analogue Illustrating Interconnectivity Principles
In a later DIC microscopic and ultrastructure-based investigation Broom et al. (Reference Broom, Chen and Hardy2001) argued that if there were both entwinement and non-entwinement-based interactions between fibrils in the general matrix (these different modes of interaction are illustrated in Figure 1.16) then their relative densities would determine the appearance of the fibril architecture if one of the effects of degradation is to weaken or destroy the component of non-entwinement-based fibril interconnectivity, this created by some kind of mediating (molecular) agent. Such a mechanism would still leave any entwinement-based fibril-to-fibril connections intact.
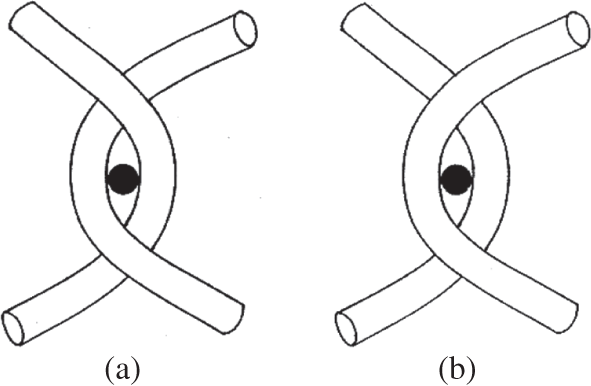
To investigate this hypothesis, Broom et al. (Reference Broom, Chen and Hardy2001) constructed a simple two-dimensional physical model (Figure 1.17) consisting of an array of parallel strings drawn across a uniformly spaced pin-board such that each one could be constrained by a pin into a regular repeating oblique configuration and interacting with its neighbour by means of either a physical entwinement (mode a in Figure 1.16) or a connection created by the pin itself but without entwinement (mode b in Figure 1.16), the latter representing the mediated node-type interaction potentially able to be ‘dismantled’ by some kind of degradative mechanism.
Simple schematic showing two different modes of inter-fibril connectivity employed to develop the 2-D destructuring models illustrated in Figure 1.17. In mode a, removal of the locating pin (black dot) still leaves the connection intact because of physical entwinement. Mode b represents a mediated node-type linkage without physical entwinement whereby removal of the pin dismantles the connection, enabling destructuring of the network to occur.
Simple 2-D ‘string and pin model’ illustrating transformation in fibril network based on a primary radial configuration exhibiting repeating segmental obliquity. Schematics a→b→c illustrate the progressive unravelling behaviour of a network with 100 per cent physical entwinement of the nodal connections whereas in schematics d→e→f the network has only 30 per cent physical entwinement, the remaining 70 per cent are non-entwinement-based and therefore permit complete fibril separation at such sites.
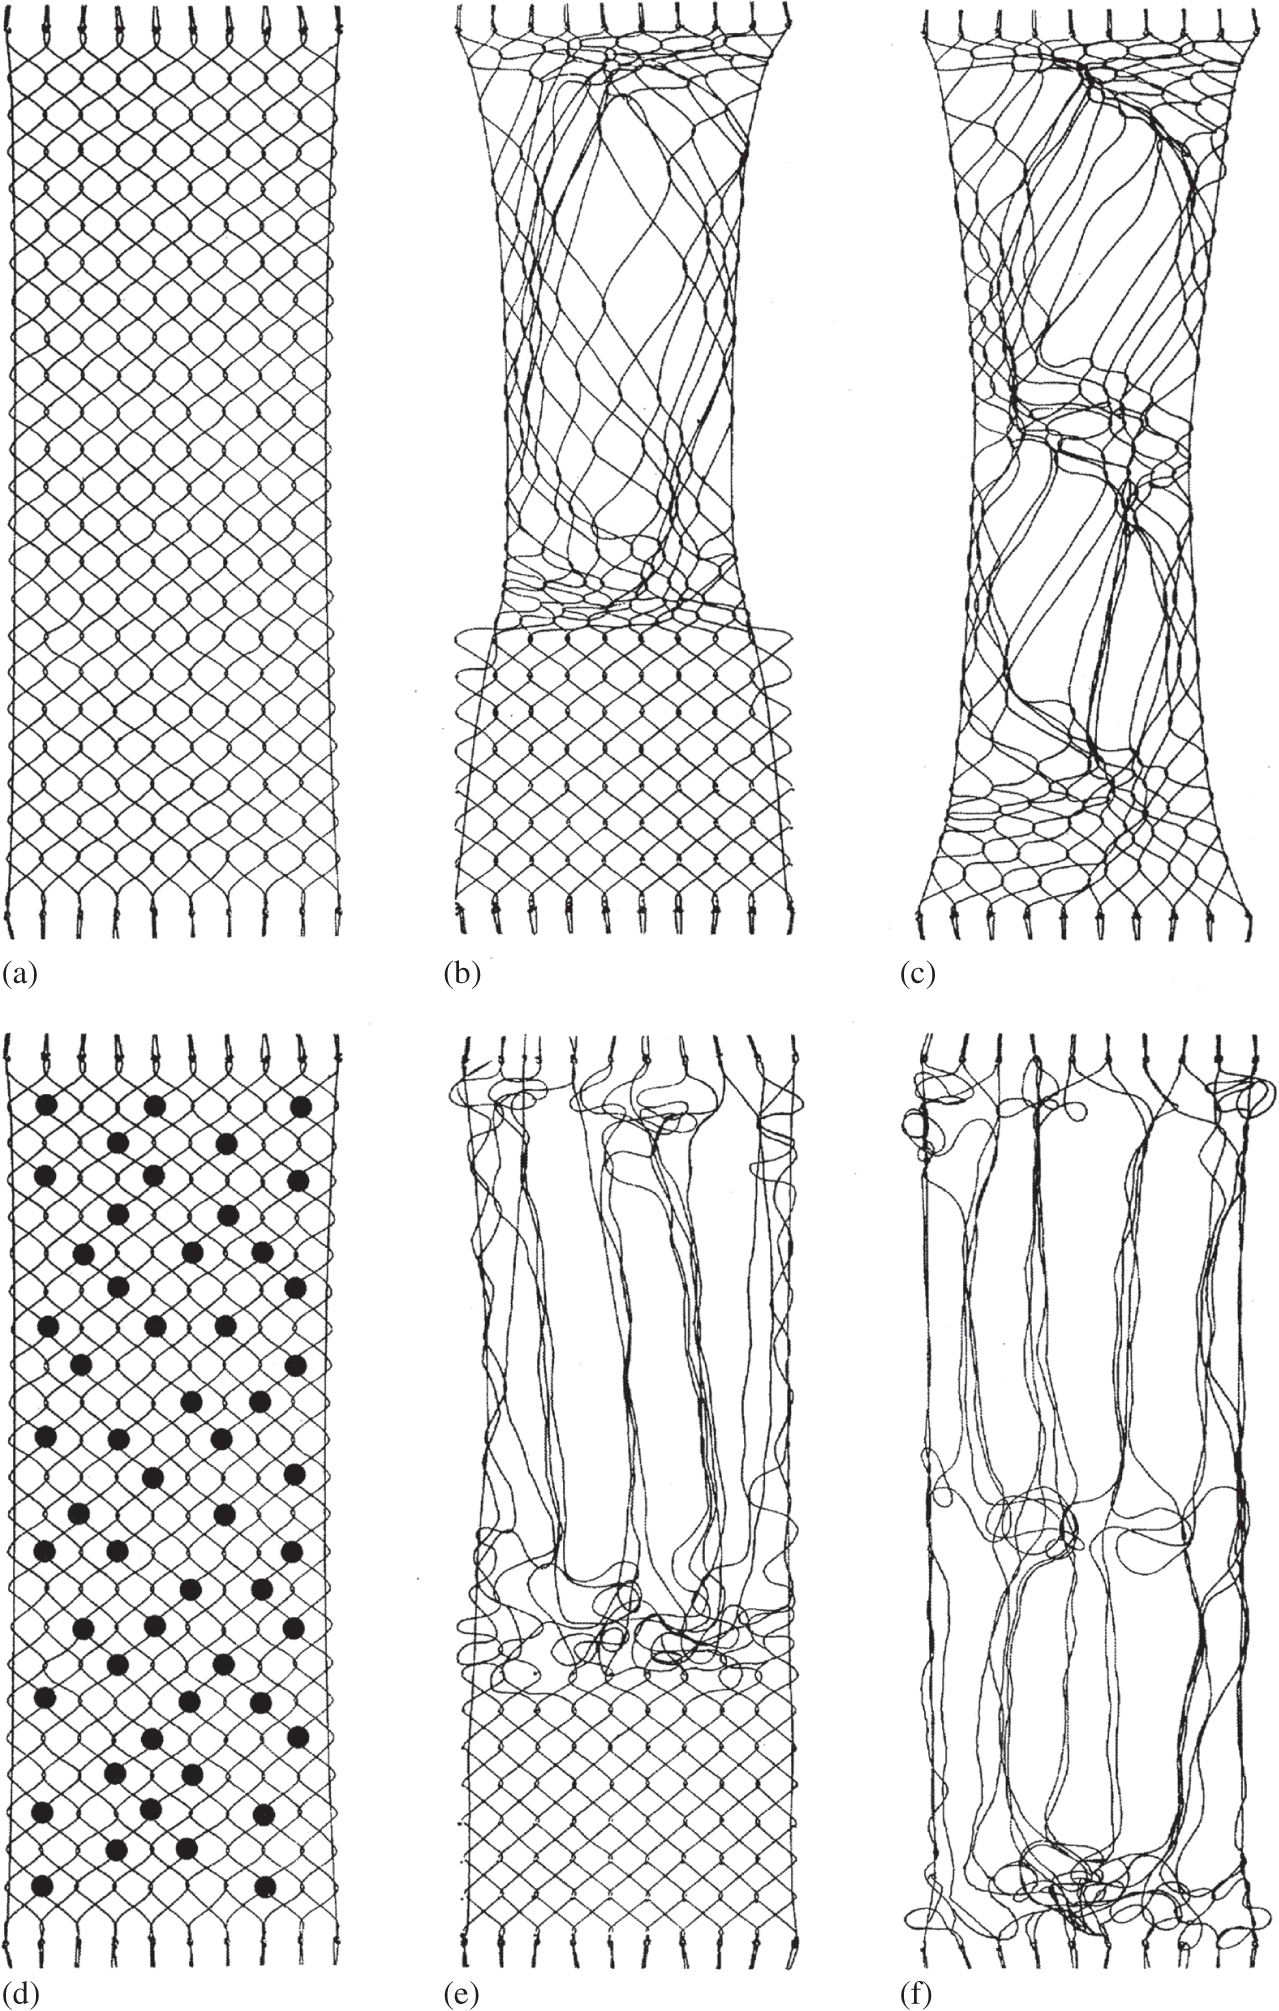
Broom et al. (Reference Broom, Chen and Hardy2001) then explored how the fibril network could be reworked beginning with two identical configurations except that one had 100 per cent entwinement-based connectivity (i.e., mode a in Figure 1.16), the other with only 30 per cent entwinement, the remaining 70 per cent being nodal (i.e., a mix of modes a and b in Figure 1.16). For the 100 per cent entwinement model it was possible to rearrange regions of the array into more parallel, aggregated bundles but only at the expense of creating intense tangling in the immediately adjacent regions (see a→b→c in Figure 1.17). In contrast, for the configuration with a much-reduced level of physical entwinement, once the non-entwinement-based interactions were removed it was possible to rework the structure to create extensive regions of aggregated bundles with much less co-lateral tangling (see schematics d→e→f in Figure 1.17).
1.11 Fibril Interconnectivity and the Abnormal Cartilage Matrix
Despite their overly simplistic representation, the transformation models described in Figure 1.17 demonstrate fibril-level structural features reflecting those seen in a surprisingly wide range of cartilage general matrices. For example, the softened or ‘malacic’ form of articular cartilage (see Figure 1.8) is usually present in the central region of the tibial condyles of larger mammals, that part of the articular surface not covered by the meniscus (e.g., Broom Reference Broom1982; Bullough et al. Reference Bullough, Yawitz and Tafra1985; Clark and Simonian Reference Clark and Simonian1997), and in a less severe form on the distal-lateral regions of the non-degenerate bovine patella (Broom and Flachsmann Reference Broom and Flachsmann2003; Broom et al. Reference Broom, Ngo and Tham2005). Apart from there being varying degrees of disruption to the articular surface in these malacic regions the articular cartilage general matrix exhibits two quite distinctive characteristics, one intrinsically structural and the other a structural feature arising from a physico-chemical swelling effect. We shall now consider these two characteristics in turn:
1.11.1 Correlating Micro- and Fibril-Level Structural Changes in the Malacic Matrix
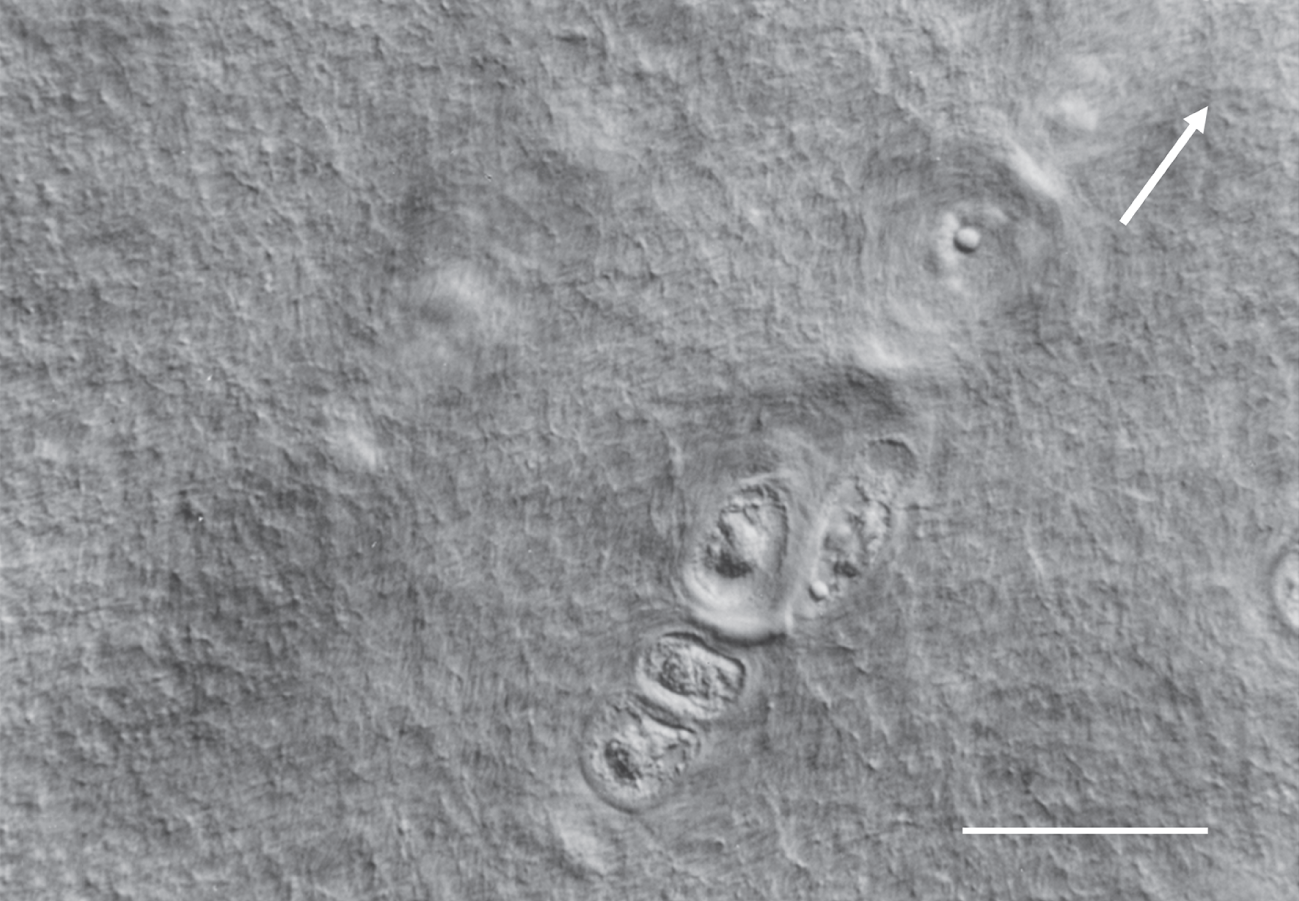
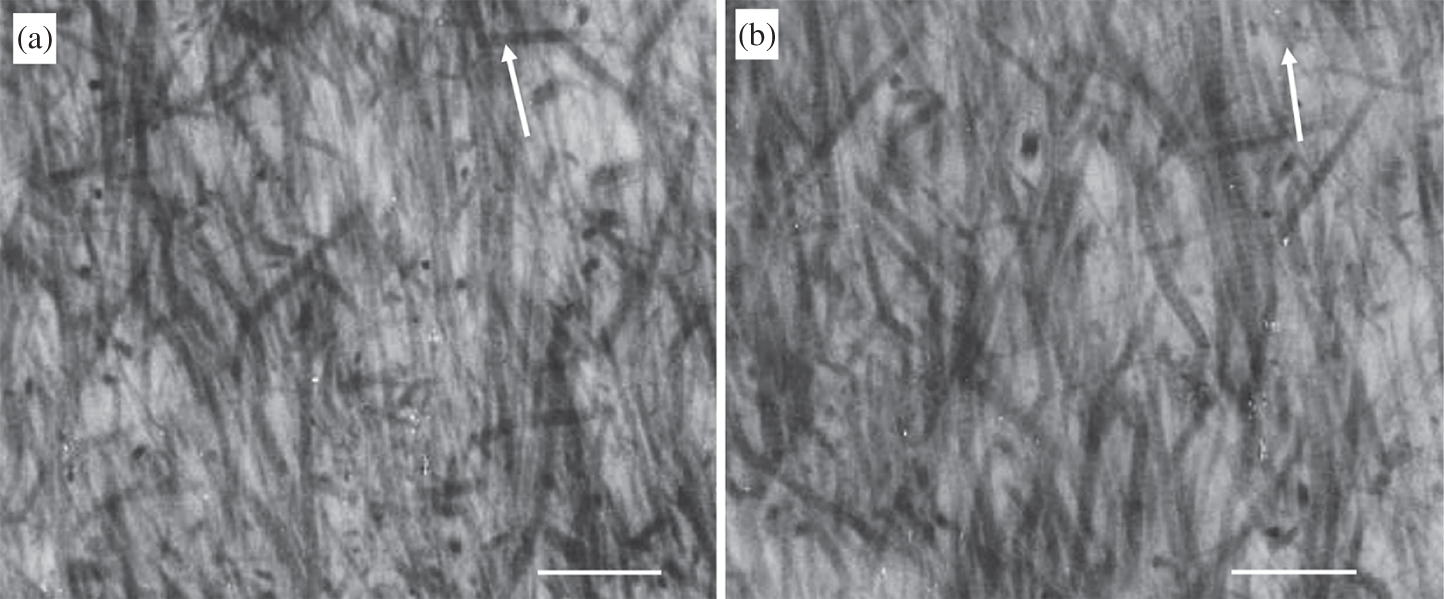
When imaged in its fully hydrated, unstained state using differential interference contrast microscopy (DIC) the completely normal general matrix exhibits little pronounced directional texture or fibrosity (see Figure 1.18a) and is indicative of a relatively normal pseudo-random fibril architecture consistent with both the TEM structures in Figures 1.12a and 1.15, as well as the schematics a and d in Figure 1.17. The increasingly malacic matrix begins to exhibit a distinct, optically resolved radial fibrosity that varies in both its visibility and degree of in-phase crimp as is illustrated in Figures 1.18b and c. Such changes are indicative of an increasing aggregation and radial collapse of the fibrils as they are released from the constraints and interactions previously holding them in a pseudo-random configuration (see especially schematics e and f in Figure 1.17). It is interesting to note that in the mildly fibrous image in Figure 1.18b there are regions that appear free of obvious fibrosity and thus still untransformed.
DIC optical image of the fully hydrated normal general matrix exhibiting minimal directional texture. Scale bar = 50 µm.
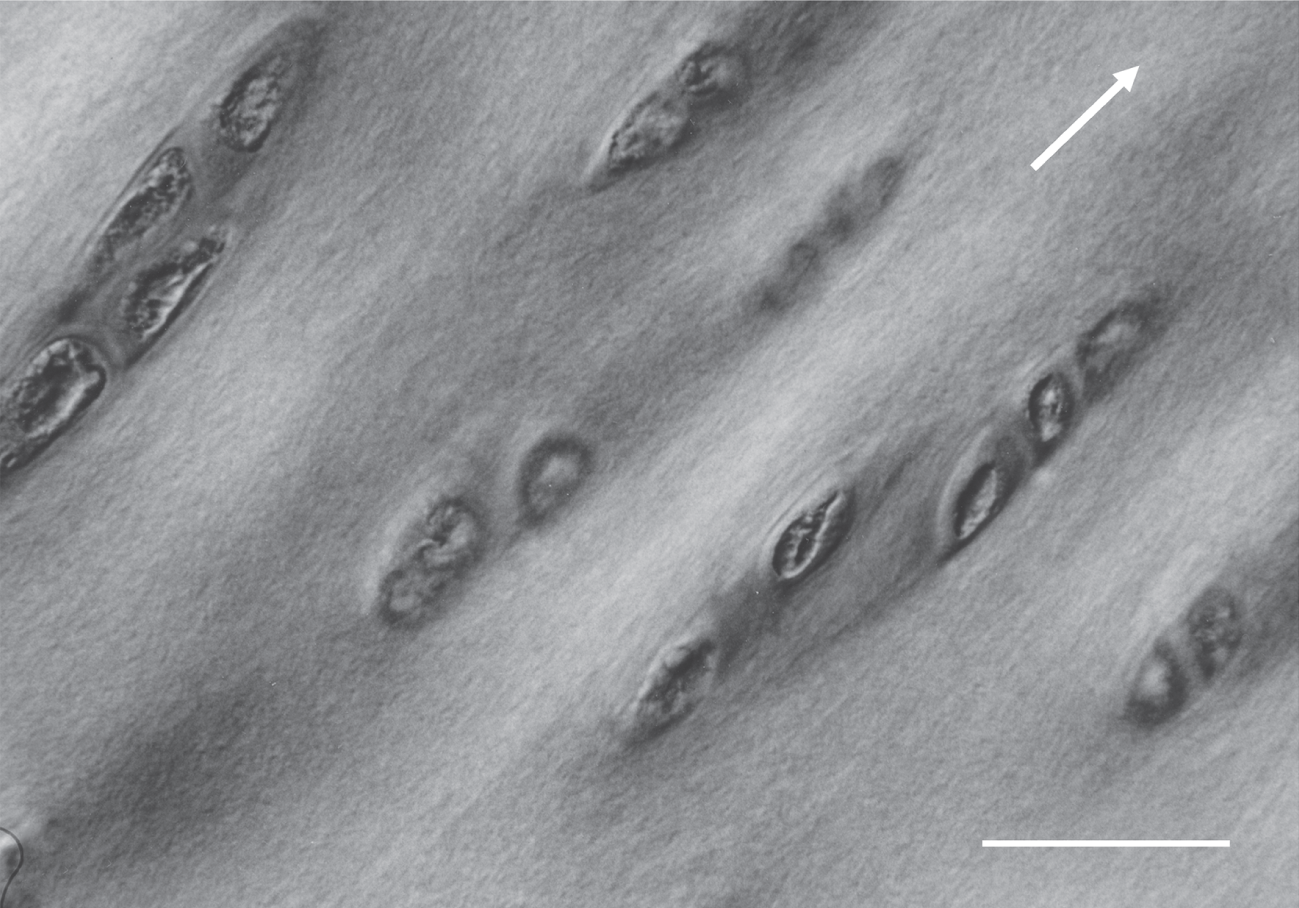
DIC optical image of the mildly malacic general matrix exhibiting a prominent directional fibrosity with a slight degree of waviness especially in the vicinity of the chondrocytes. Note the absence of directional texture in the lower LH region marked with asterisk. Scale bar = 25 µm.
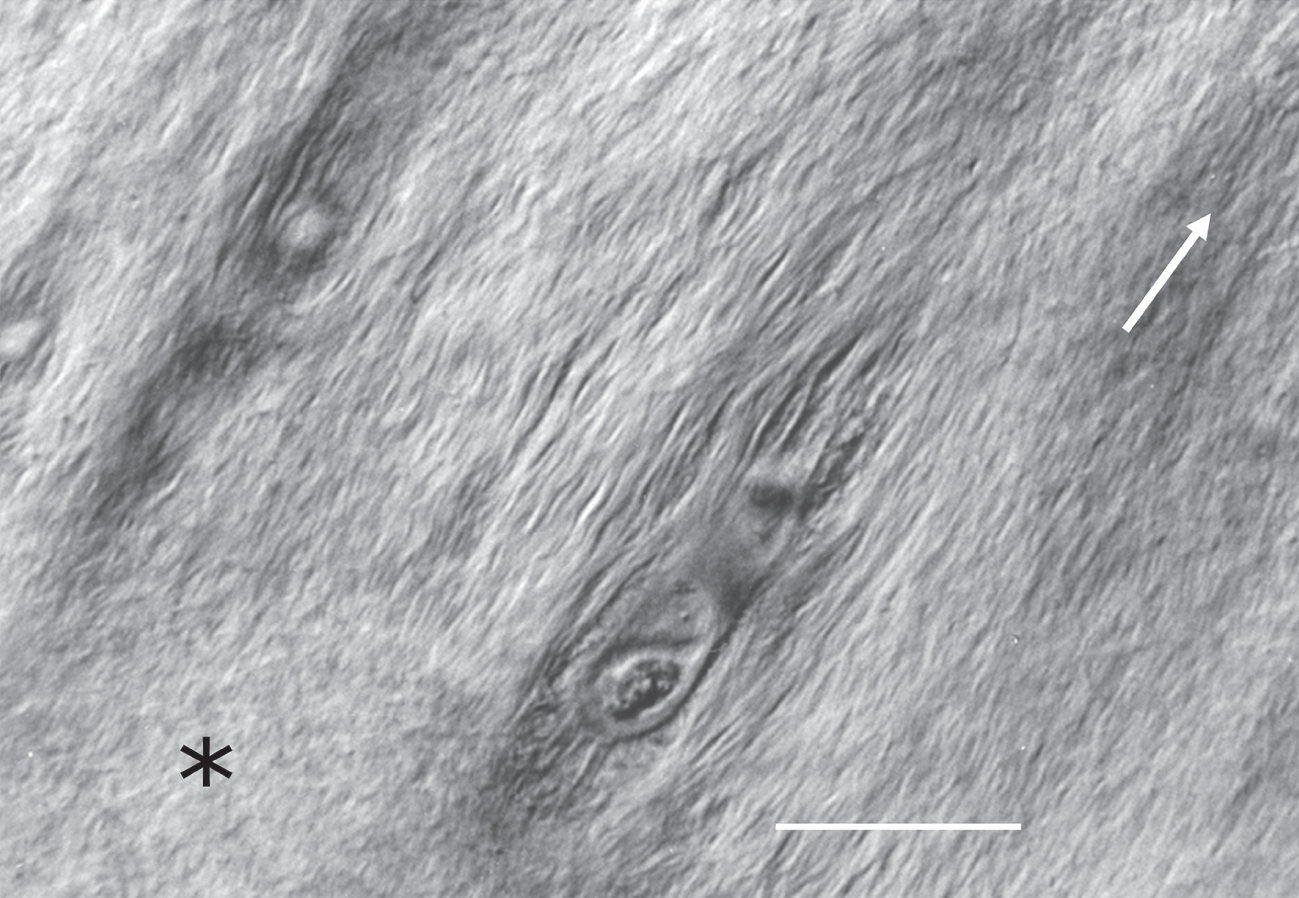
DIC optical image of the malacic general matrix exhibiting significant fibrosity with a prominent in-phase crimp morphology. Scale bar = 12.5 µm.
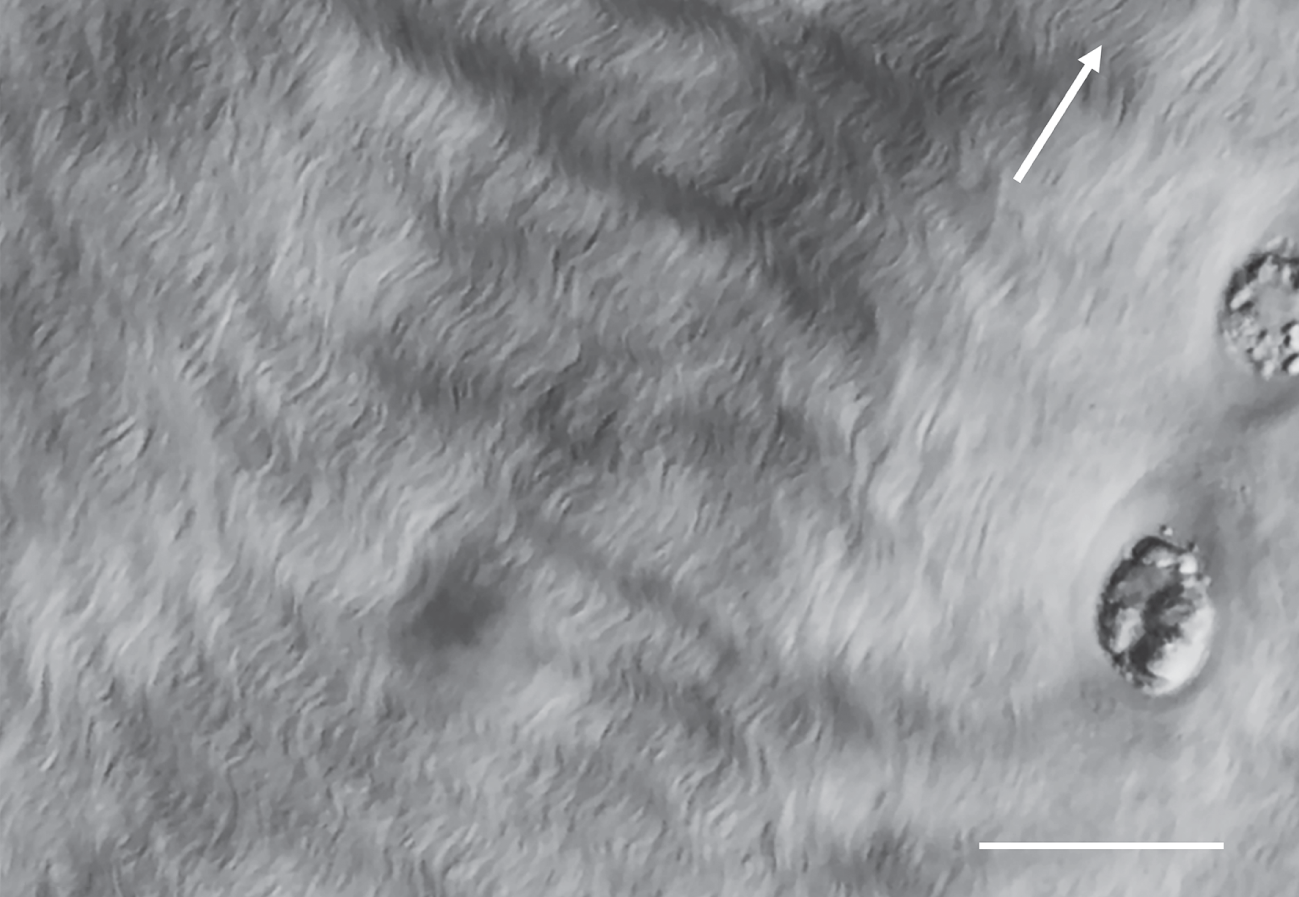
DIC optical image of a highly swollen malacic matrix in which there appears to be no directional texture – this apparent anomaly is explained with reference to the TEM images in Figure 1.22. Scale bar = 25 µm.
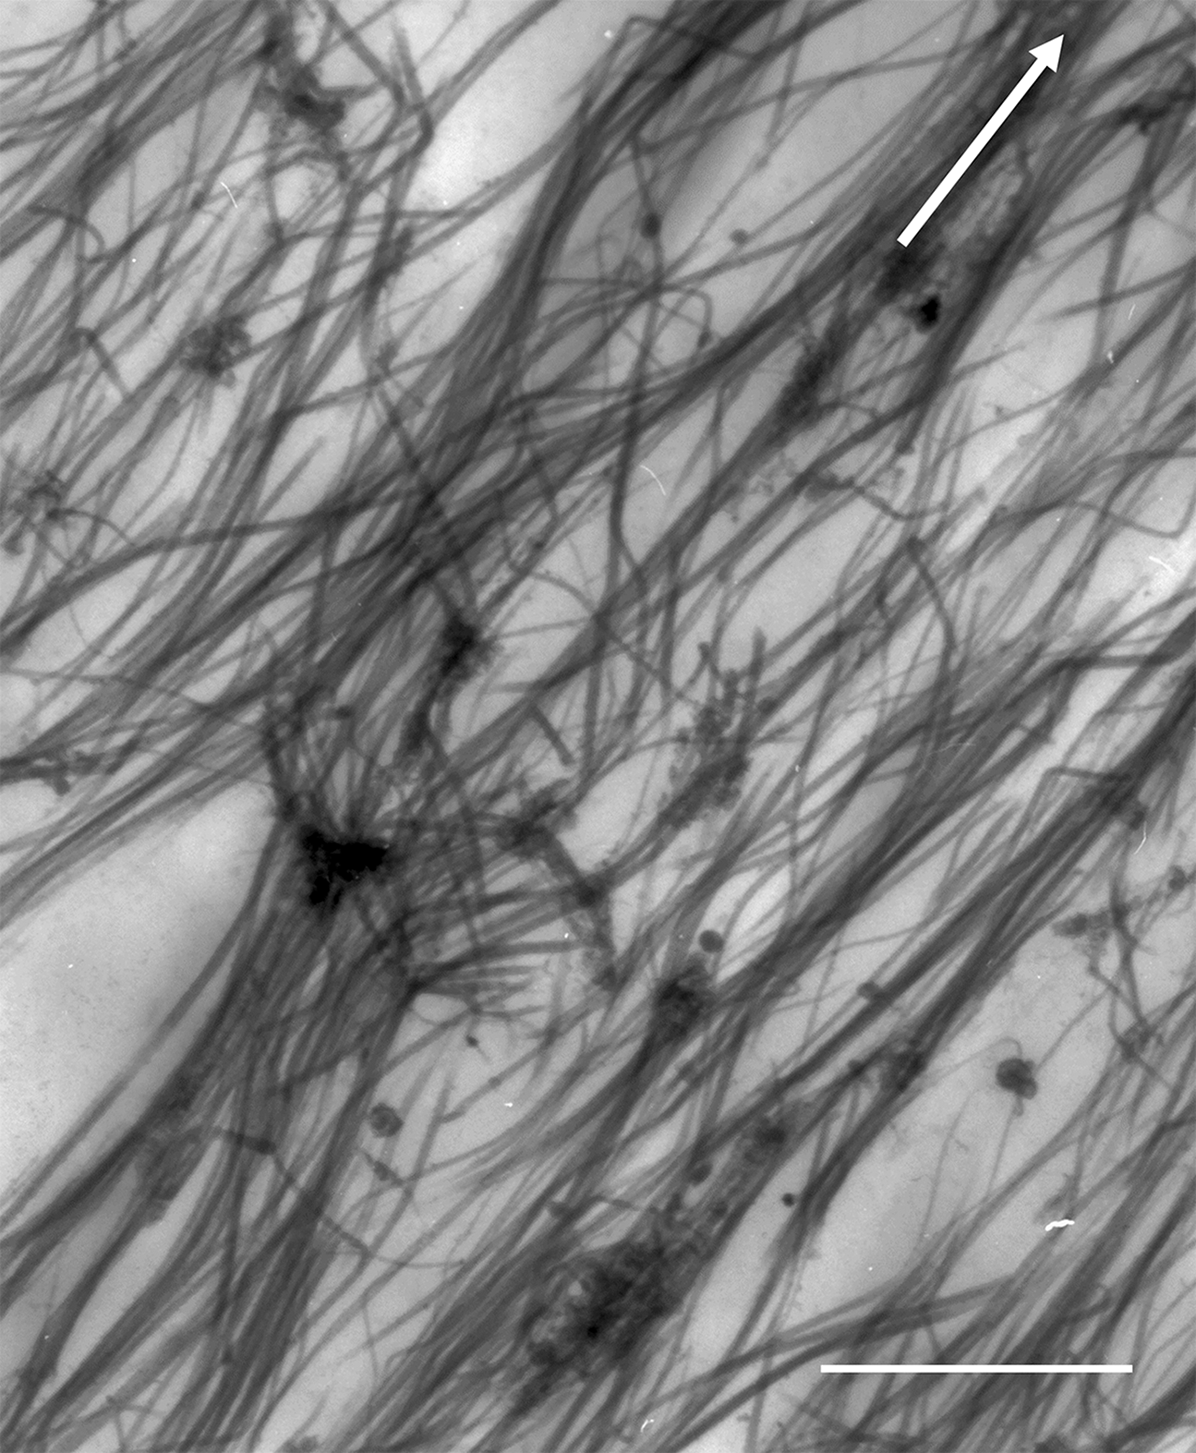
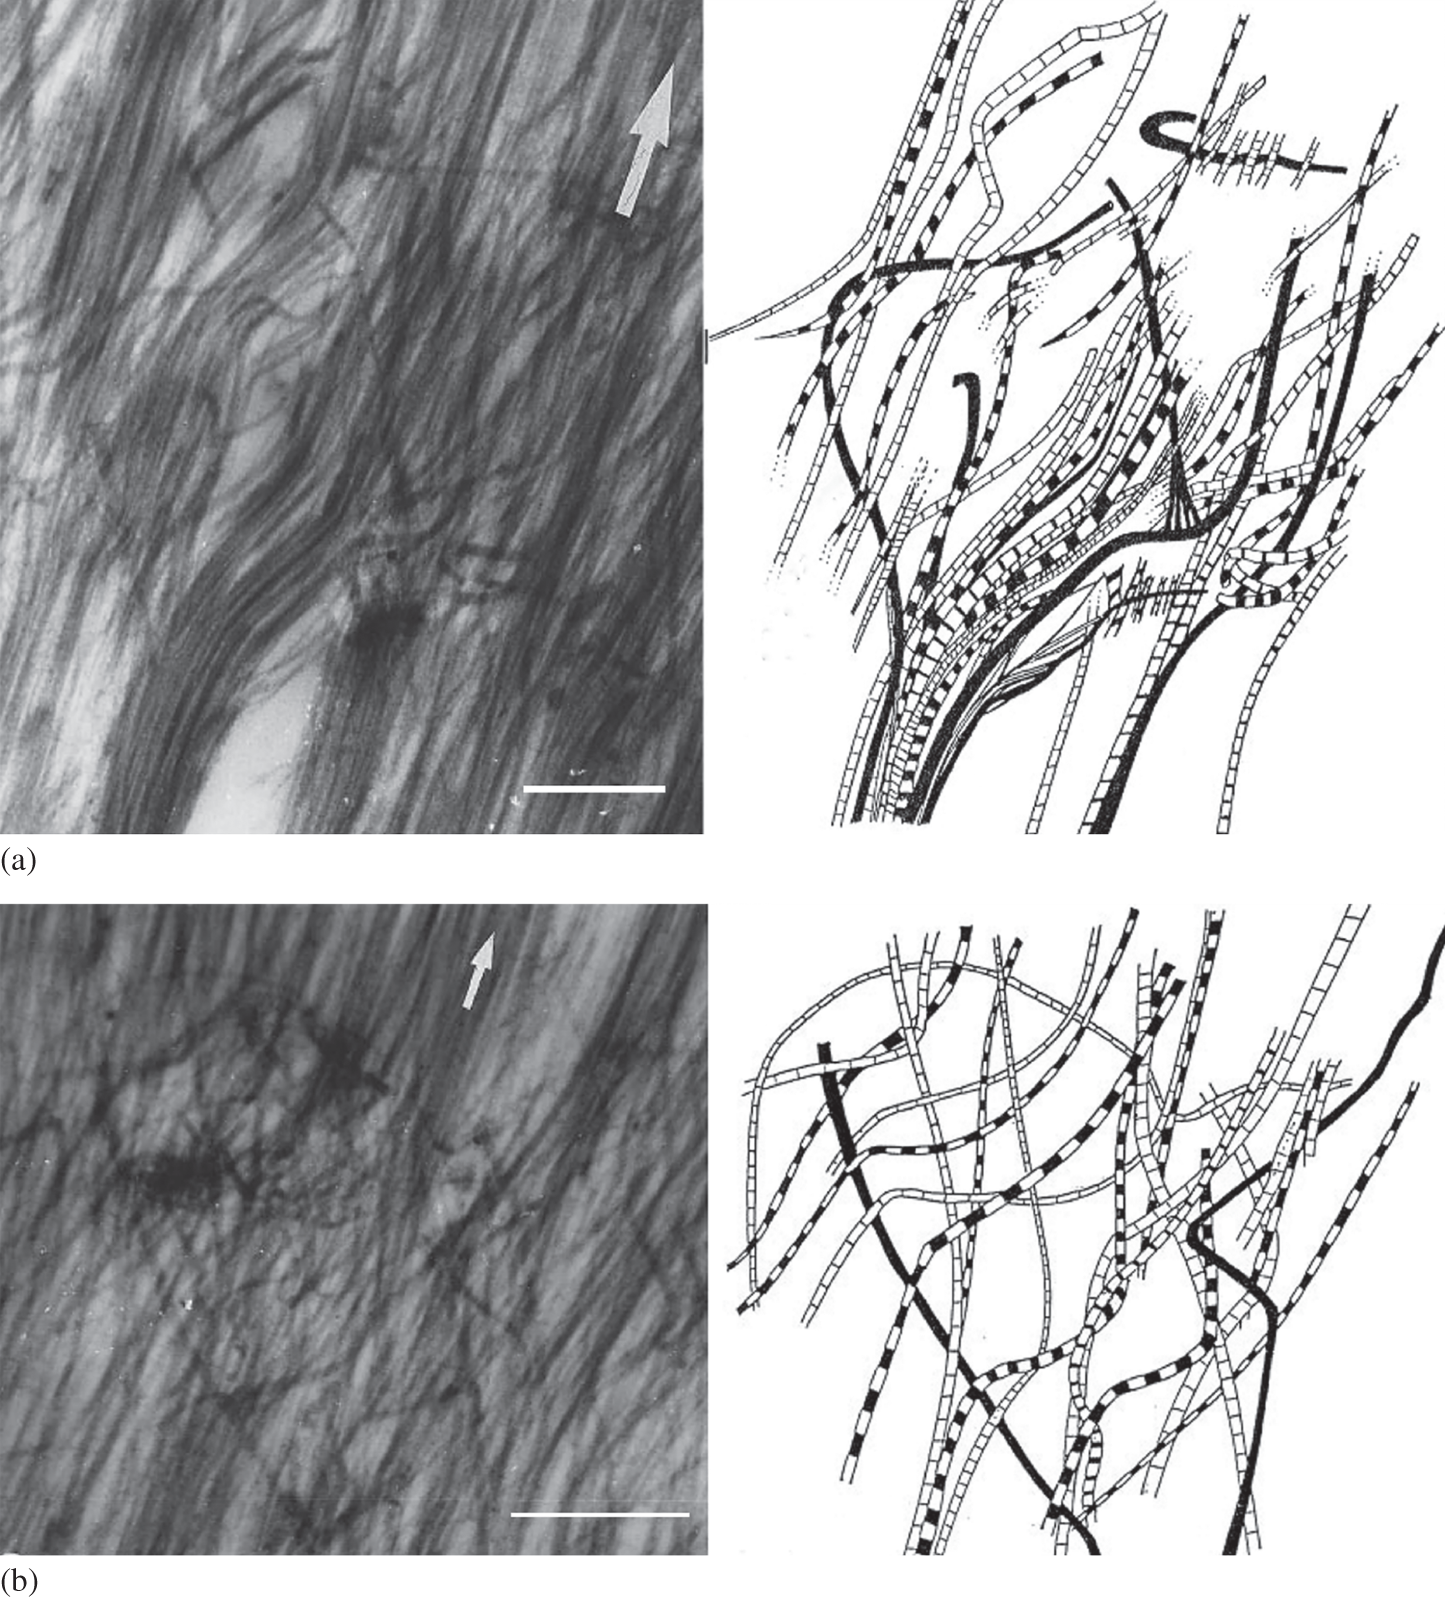
Ultra-structural imaging also confirms that the optically visible fibrosity in the malacic matrix is, in fact, a direct consequence of fibrils aggregating into larger bundles and over varying radial distances as illustrated, for example, in Figure 1.12b. Interestingly, Chen and Broom (Reference Chen and Broom1998) observed that the malacic matrix contained varying amounts of transverse fibril tangling that appears to restrict complete separation of the fibril bundles as is illustrated in Figure 1.19. Their reconstructions of two of these transverse fibril tangles are shown in Figures 1.20a and b. Again, the presence of such discordant transverse tangling is entirely consistent with the transformation models presented in Figure 1.17. If the bulk of interconnectivity between the overall radially aligned fibrils in the general matrix is node-based rather than entwinement based then, following the degradative dismantling of these nodes, the fibrils that were previously constrained in their pseudo-random configuration would now be free to revert to their native radial alignment with weaker interaction between fibrils, enabling them to aggregate into aligned bundles. Importantly, only the entwinement-based component of interconnections would be resistant to this reversion to the native radial form and would, therefore, account for the observed tangling as illustrated in Figures 1.19 and 1.20.
Fibril-level TEM image of softened or malacic mid-zone cartilage matrix illustrating both the aggregation of the radially aligned fibrils into bundles and intense transverse tangling. Arrow indicates radial direction; scale bar = 0.75 µm.
Fibril-level TEM images and matching stereo reconstructions of the malacic general matrix. Both image sets a and b provide examples of transverse tangling restricting the complete re-alignment of the destructured fibrillar network into extended parallel bundles. Arrows indicate radial direction. Scale bar = 0.75 µm.
1.11.2 The Fibrillar Network and Abnormal Matrix Swelling
The second structure-related characteristic of the malacic general matrix is its high-swelling potential when freed from the constraints of both its surface layer and subchondral attachment. Broom and Flachsmann (Reference Broom and Flachsmann2003) were able to quantify this swelling property and correlate it with both matrix fibrosity (as imaged using DIC light microscopy) and compressive stiffness. They extracted mid-to-deep zone transverse macro-sections ~0.6 mm in thickness from fresh bovine patella cartilage–bone blocks using a novel double-bladed sectioning device. By using such large section thicknesses isolated from their adjacent zonal layers the level of structural continuity in the through-thickness (i.e., radial) direction was sufficient to ensure that the extracted sections represented the bulk properties of the general matrix constrained only by the inherent stability and interconnectivity of the fibril architecture contained within.
Broom and Flachsmann (Reference Broom and Flachsmann2003) then compared the aerial dimensions of their sections prior to and following equilibration in hypotonic distilled water, computed the swelling strains and related these to both degree of matrix fibrosity and whole cartilage-on-bone compressive stiffness. Importantly, they were able to show that an increasing degree of transverse swelling correlated with an increase in the level of optically visible fibrosity in the general matrix. Because such matrix swelling is intimately linked to the ease with which the fibrillar network can expand in the transverse plane it can therefore be considered as an indicator of fibrillar interconnectivity and thus a measure of the biomechanical health of the cartilage general matrix.
The normal matrix with its highly interconnected pseudo-random fibrillar architecture is highly resistant to transverse swelling when exposed to the hypotonic medium. This is illustrated in the pair of thick-section TEM images in Figure 1.21. These provide a comparison between the fibrillar architecture in the general matrix as imaged in its fixed in situ ‘on-bone’ state (see image a) and a comparable matrix removed from its subchondral bone and allowed to equilibrate in the high swelling hypotonic medium (see image b) – there is almost no change in the overall compactness of the fibrillar structure.
TEM images demonstrating the striking stability of the fibrillar structure of the normal general matrix structure when exposed to a high-swelling environment of distilled water. Image (a) shows the tightly knitted fibrillar structure of the general matrix that has been chemically fixed-on-bone in its pre-equilibration control state prior to sectioning. Image (b) is from an adjacent portion of the matrix that has been detached from its subchondral bone and then equilibrated in distilled water before chemical fixation – the fibrillar structure has remained similarly tightly knitted. Arrows indicate radial direction. Scale bars = 1 µm.
In contrast to the stability of the normal matrix, the malacic tissue exhibits a dramatic change in its fibrillar architecture when exposed to the same high-swelling environment. Prior to its exposure we typically see significant fibril aggregation in a crimped morphology and with an extended radial alignment as illustrated in Figure 1.22a. Subsequent exposure to the high-swelling medium results produces a fibrillar arrangement in the malacic matrix that can be so dramatically altered that it appears to bear almost no relation to its pre-swollen state (see Figure 1.22b). While there is still evidence of fibril aggregation, the large amount of transverse swelling has almost completely disrupted the imaged continuity of the fibrils. The structure has become considerably more open and irregular, and much of it now lies outside the plane of the TEM thin section.
(a) Fibril-level TEM image of a typically malacic general matrix obtained following its chemical fixation on-bone to preserve its in situ structure. Scale bar = 2 µm. (b) The highly disorganised structure of a typically malacic cartilage matrix that has been released from its subchondral bone and then exposed to a high-swelling environment prior to chemical fixation. Note that the structure is now highly irregular with little obvious continuity captured within the section plane. Scale bar = 0.75 µm. Arrows in both images indicate the radial direction.
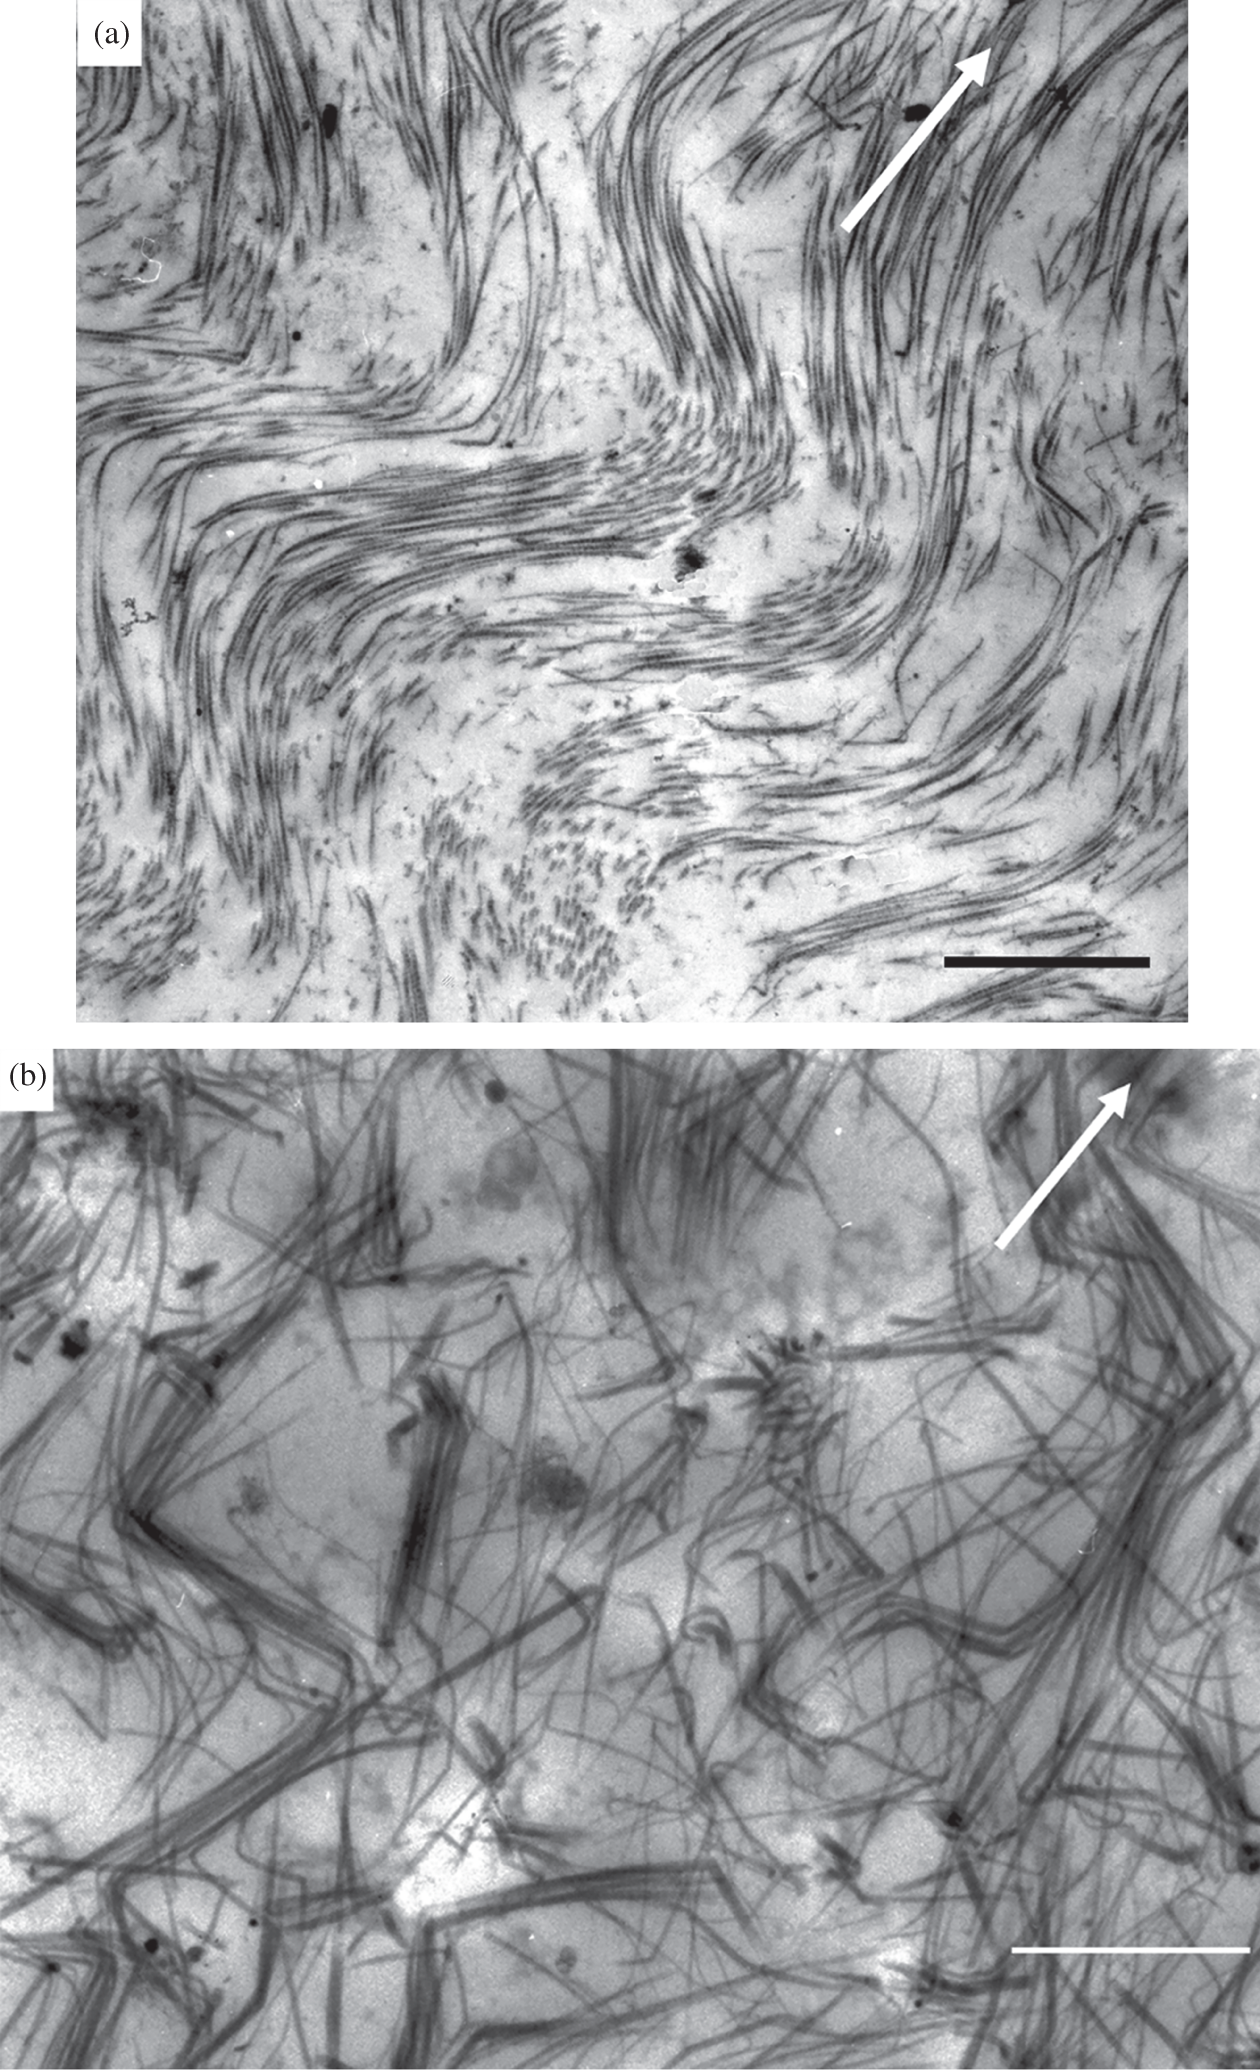
The DIC image in Figure 1.18d is also from a highly swollen malacic matrix, but shows no obvious directional texture even though we would intuitively expect this to be even more pronounced than in the lesser malacic matrices illustrated in Figure 1.18b and c. However, the TEM evidence provides resolution of this apparent anomaly and for the following reason: given that any optically resolved radial texture or fibrosity will be imaged only if the aggregated fibril bundles are of a sufficient size and if they persist radially as bundles over a sufficient distance, we would not expect the highly disrupted and directionally irregular fibril-level structure of the severely malacic matrix shown in Figure 1.22b to be imaged as a directional fibrosity under DIC optical imaging.
We can now see from the above correlation between the DIC optical and TEM structural images that, in contrast to the very time-consuming and technically demanding preparation required to obtain ultra-thin sections for TEM imaging, the former provides a quick and efficient means of assessing the structural integrity of the articular cartilage matrix. The presence of an optically resolvable directional texture under DIC is a very straightforward indicator of fibril aggregation and its related mechanical and swelling properties. However, we must caution against confusing the absence of obvious directional texture as seen in the normal matrix (Figure 1.18a) with that in the excessively swollen malacic matrix (Figure 1.18d). They might appear superficially similar, but they are most certainly not, and a little experience in DIC imaging soon equips a researcher with the ability to discern this difference.
1.11.3 Fibrillar Network Transformability: An Indicator of Type of Interconnectivity
That such a high degree of fibril aggregation is present in the malacic matrix and that this aggregation can also be derived from a transformation of the normal pseudo-random structure by either enzymic means (Figure 1.11) or mechanical trauma (Figure 1.12) suggests that the primary mode of transverse interconnectivity is non-entwinement rather than entwinement based. And this interpretation is entirely consistent with the limited amount of fibril-level tangling that is seen in the malacic matrix and which is assumed to be a direct consequence of this component of entwinement.
We note too that the malacic matrix, prior to its exposure to a high-swelling environment, has a predominantly aggregated and radially aligned fibrillar architecture with a much more limited component of fibril tangling. Following exposure to the high-swelling medium, its high swelling behaviour provides added support for this softened form of matrix having a relatively low component of entwinement-based interconnectivity and that this constitutes the primary restraint against its large-scale transverse swelling. Again, this is supported by the markedly ‘opened out’ ultra-structure of the swollen malacic matrix (Figure 1.22b) compared to its pre-swollen equivalent (Figure 1.22a).
1.11.4 Fibrillar Network Transformation and Cartilage Degeneration
So, if the abnormally softened or malacic ultrastructure really is a degradation-related derivative of the previously normal ultra-structure then it is not unreasonable to conclude that the physical entwinement of fibrils plays a relatively minor role in contributing to transverse interconnectivity in the normal matrix. Importantly, similar structural features have been reported in human OA articular cartilage (see e.g., Ruttner and Spycher Reference Ruttner and Spycher1968; Lothe et al. Reference Lothe, Spycher and Ruttner1973; Vignon et al. Reference Vignon, Arlot, Meunier and Vignon1974) suggesting that this ‘destructuring’ of the collagenous network is a generalised phenomenon relating to abnormally soft and mechanically damaged cartilage matrices.
Accounting for the fibrillar alterations in the OA matrix in terms of the destructuring principle also accords with studies reporting abnormal matrix swelling in both experimental animal models of OA (Pond and Nuki Reference Pond and Nuki1973; Brandt Reference Brandt1994) and in human OA (Maroudas and Venn Reference Maroudas and Venn1977; Maroudas et al. Reference Maroudas, Ziv and Weisman1985). Significantly, such swelling behaviour has been attributed to collagen degradation and a weakened or altered fibrillar architecture (Maroudas Reference 368Maroudas1976; Maroudas et al. Reference Maroudas, Mizrahi, Katz, Kuettner, Schleyerbach and Hascall1986; Muir Reference 370Muir, Muir, Hirohata and Shichikawa1989; Hwang et al. Reference Hwang, Li and Jin1992; Bank et al. Reference Bank, Soudry and Maroudas2000). It seems reasonable to assume that any degradative process able to bring about such a major destructuring of the collagen network via some form of assault on the inter-fibril links will also have some deleterious effect on the fibrils themselves.
1.11.5 Potential Linking Agents for Achieving Non-Entwinement-Based Fibril Interconnectivity
What seems clear is that the fibrillar network of the extra-cellular matrix of normal cartilage is held together by fibril-to-fibril connections or links that are mostly non-entwinement based. While this network is developed from a primary radial configuration of fibrils, its pseudo-random architecture is assumed to arise from the constraints created by these repeating connections which, when degraded either mechanically, biochemically or pathologically, leads to fibrillar destructuring.
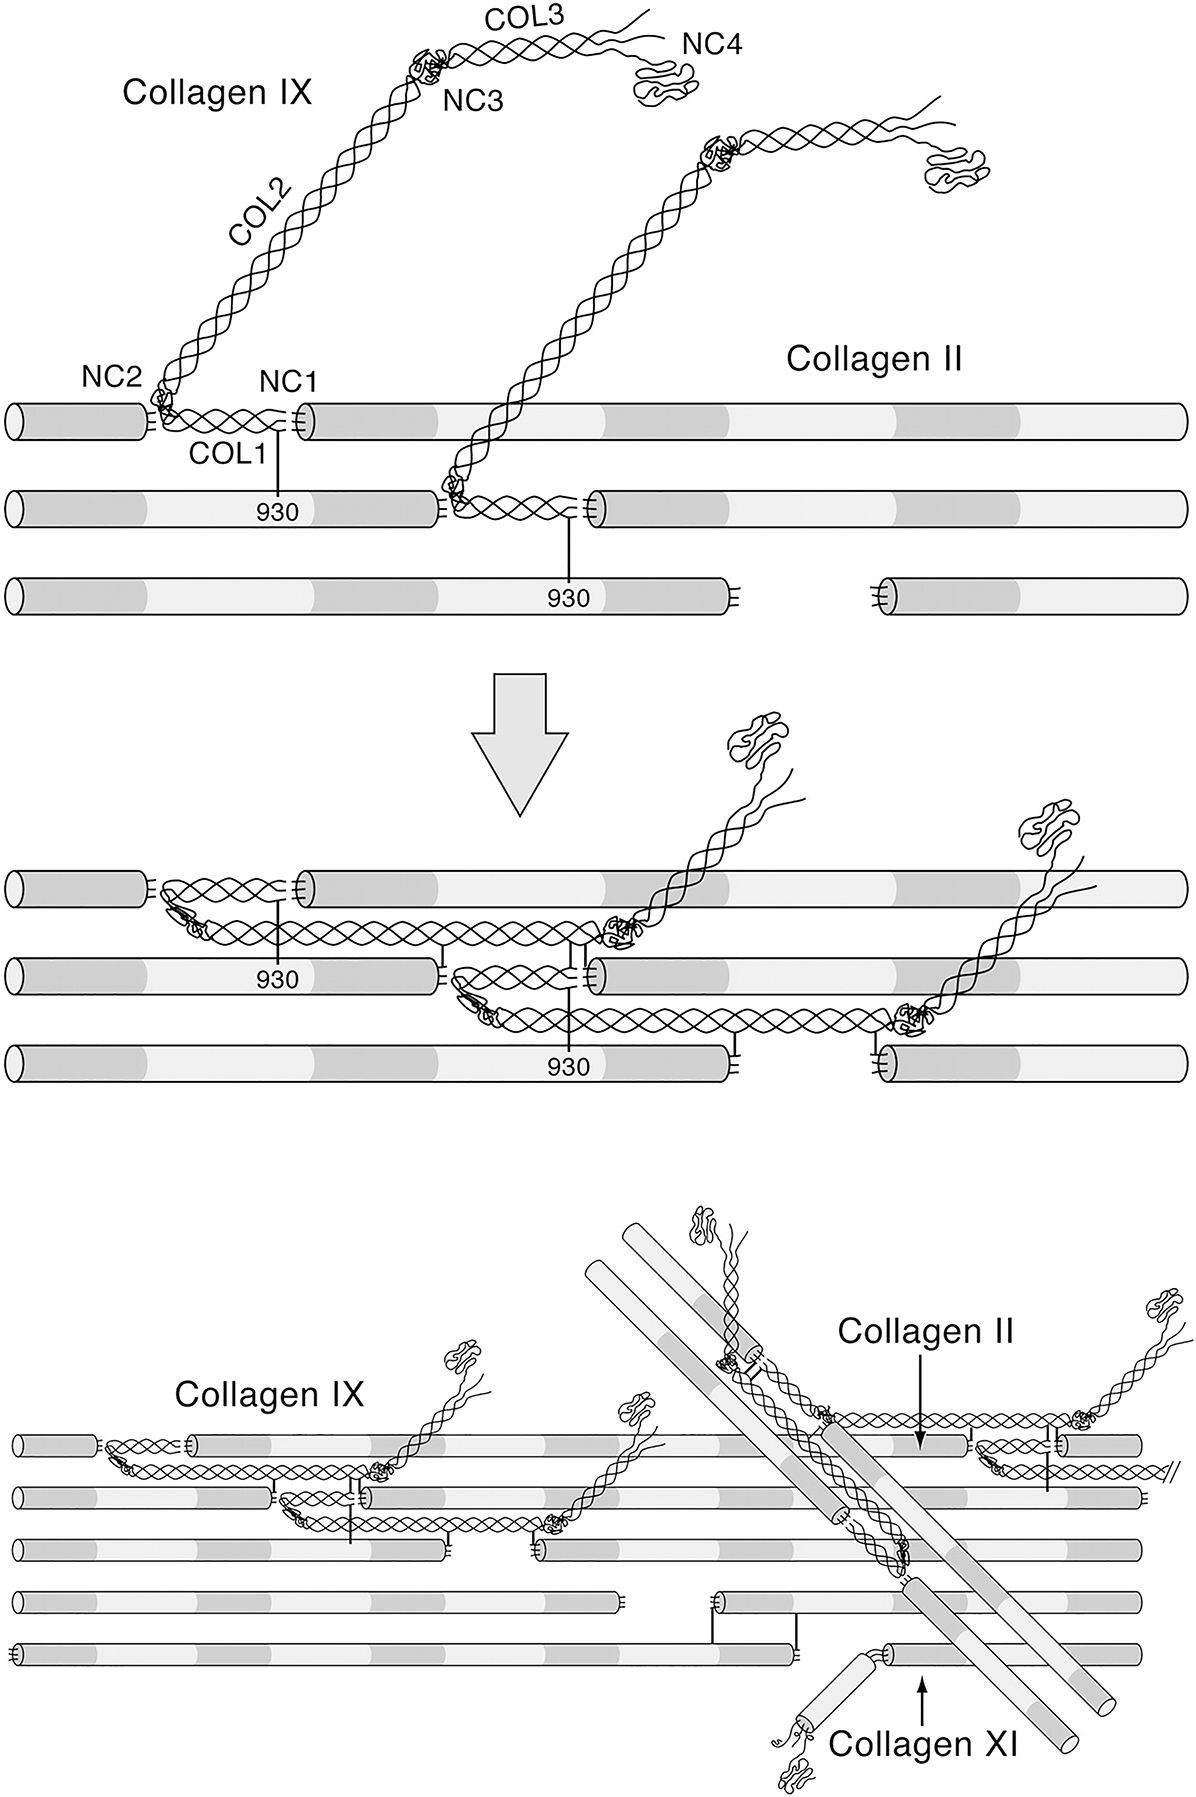
So, the question arises as to how such non-entwinement-based interconnectivity is achieved in the normal matrix and is of sufficient robustness to create the level of strength required to meet the demands of normal load-bearing. There are some potential molecular candidates that might act as a mediating link between fibrils. It is known, for example, that there is a close bonding relationship between type II collagen and the minor type IX (non-fibril forming) and type XI (fibril forming) collagens (Muller-Glauser et al. Reference Muller-Glauser, Humbel and Glatt1986; Wu et al. Reference Wu, Woods and Eyre1992; Eyre et al. Reference Eyre, Weis and Wu2006; Eyre et al. Reference Eyre, Weis and Wu2008). The type XI collagen molecule forms a filamentous template within the type II fibril and is thought to control its lateral growth (Blaschke et al. Reference Blaschke, Eikenberry and Hulmes2000) whereas the type IX is crosslinked to the surface of the type II fibril and primarily those smaller diameter fibrils that form the basket-like weave around the chondrocytes (Hagg et al. Reference Hagg, Bruckner and Hedbom1998). Eyre et al. (Reference Eyre, Pietka and Weis2004) have proposed a model whereby intersecting type II fibrils are bonded by hydroxy-lysyl pyridinoline crosslinks between the type IX molecules on each fibril (Figure 1.23).
Molecular model proposed by Eyre et al. (Reference Eyre, Pietka and Weis2004) to show how collagen type IX molecules might initially interact with nascent collagen type II fibrils and fold to accommodate known crosslinking interactions.
Heinegard and Saxne (Reference Heinegard and Saxne2011) in their review of potential degradative events in OA suggest various scenarios that could account for the breakdown of the fibrillar network in articular cartilage. They make reference to molecular agents that might play a role in maintaining network integrity by virtue of being bound to the fibril surfaces and thus be involved in creating fibril-to-fibril interconnectivity. As well as type IX collagen they suggest potential linking roles for fibromodulin (Heathfield et al. Reference Heathfield, Onnerfjord and Dahlberg2004), decorin (Cs-Szabo et al. Reference Cs-Szabo, Roughley and Plaas1995; Hagg et al. Reference Hagg, Bruckner and Hedbom1998; Melrose et al. Reference Melrose, Fuller and Roughley2008), cartilage oligomeric matrix protein or COMP (Dickinson et al. Reference Dickinson, Vankemmelbeke and Buttle2003; Arai et al. Reference Arai, Misumi and Carter2005), together with more indirect linking roles for the matriline family of non-collagenous proteins (Budde et al. Reference Budde, Blumbach and Ylostalo2005).
Added support for the idea that the fibrillar network in articular cartilage could be stabilised by specific cross-links between the type II, IX and XI collagen molecules comes from a study by Murdoch et al. (Reference Murdoch, Hardingham and Eyre2016) in which they analysed the collagen network produced in cartilage-like constructs cultured from human bone marrow mesenchymal stem cells. These investigators were able to show that as the stem cells undergo chondrogenesis there is an extra-cellular processing of the collagen in which type II collagen molecules become inter-molecularly cross-linked to other type II molecules and to type XI and type IX molecules, leading to the formation of a highly organised and crosslinked collagen network.
We therefore conclude this chapter by emphasizing the critical role that the interconnected fibrillar network plays in maintaining the strength of the articular cartilage matrix and that a reduction in the level of this interconnectivity is associated with increased swelling, softening and degeneration-related changes. While we now have on offer several plausible models of fibril-to-fibril connectivity, there still remains uncertainty as to their applicability, especially in the wider extra-cellular matrix.


