I. INTRODUCTION
Inconel 625 is a solid-solution or/and precipitation strengthened nickel-based superalloy which can work in high temperature and under stress for long term stability. Inconel 625 has been developed to meet the demand of high strength of the steam pipe material since the 1950s. Reference Shankar, Rao and Mannan1 Thanks to its extraordinary and excellent properties such as high temperature strength, toughness, ductility, Reference Abioye, Folkes and Clare2,Reference Cooper, Slebodnick and Thomas3 oxidation resistance, and corrosion resistance. Reference Bi, Dong, Zheng and Xie4 Inconel 625 has found extensive use in aviation, aerospace, military, marine, chemical, and petrochemical industries where the environments involve a wide variety of corrosion, oxidation, wear, and abrasion, typically elevated temperatures. Reference He and Lavernia5 Nickel based superalloy is currently the most widely used material of aeroengine hot-end component. One of the most important performance parameters of aeroengine is thrust weight ratio. With the high-speed development in aviation, aeroengine is in pursuit of higher thrust weight ratio, which inevitably leads to the turbine inlet temperature of high performance aeroengine further improved. Consequently, the issue about heat resistance of aeroengine hot-end components material is urgent to solve. The existing property of Inconel 625 cannot meet the increasing requirement of aeroengine for serviceability temperature. Hence, Inconel 625 superalloy with higher performance is in enhanced demands as aeroengine hot-end components especially in harsher high-temperature environment. Previous investigations showed that ceramic particles reinforced composites can significantly improve the high temperature mechanical properties of the matrix alloy. Reference Cooper, Blundell, Maggs and Gibbons6 Particles reinforced metal matrix composites have outstanding performances such as superior specific strength, fatigue properties, fracture toughness, wear resistance, and a low coefficient of thermal expansion that are unachievable with conventional materials. Reference Ibrahim, Mohamed and Lavernia7,Reference Li and Tandon8 TiC particle is a refractory compound exhibiting the characteristics of high hardness, outstanding thermal stability, wear resistance, and corrosion resistance, and hence being used as a promising reinforcement particles. Reference Lei, Ouyang, Pei and Zhou9,Reference Mei, Yuan and Duan10 The incorporation of TiC particles into the Inconel 625 can obtain even comprehensive improved properties, especially high-temperature properties, e.g., high-temperature creep behavior, hot corrosion property. Reference Jiang, Hong, Zhong, Alkhayat, Weisheit, Gasser, Zhang, Kelbassa and Poprawe11–Reference Hui, Yang, Wang, Yuan and Chen13 Conventionally, the particulate reinforcements in the metal matrix composites are in micrometer scale. The experiments in recent years have proved that when the particle reinforcement size is reduced to the nanometer range, the nano-particles reinforced composites demonstrate even better properties such as higher hardness, strength, wear resistance, creep resistance, and especially excellent fracture toughness. Reference Casati and Vedani14,Reference He, Han and Jackson15 The conventional micrometer particles reinforced metal matrix composites are far away from possessing such superior performances. Therefore, in this paper, nano-sized TiC particles were incorporated into the metal matrix as reinforcements.
Conventional methods, including casting and powder metallurgy techniques, have been used for manufacturing of ceramic particles reinforced composites. However, the conventional manufacturing processes still exist following key technical problems: (i) ceramic material has a high melting point which can't be completely melted, resulting in coarsening grain; (ii) interfacial bonding problems (e.g., interfacial microcracks) may be caused by the limited wetting characteristics and large differences in coefficient of linear expansion between metal matrix and ceramic particles; (iii) ceramic particles have large differences with the metal matrix in density, which is prone to generate large agglomerations of reinforced particles, thus decreasing the microstructural homogeneity and resultant mechanical properties. Reference Gu, Hagedorn, Meiners, Wissenbach and Poprawe16 Therefore, to overcome these shortcomings, a new fabrication technique, i.e., laser metal deposition (LMD), has been introduced for the forming of TiC/Inconel 625 components. LMD is an advanced computer-aided additive manufacture, which combines rapid prototyping technology and laser cladding process and has been a promising manufacturing method in recent years. Reference Shah, Pinkerton, Salman and Li17,Reference Qua, Li, Zhang, Li and Wang18 Different to the conventional material removal method, LMD is based on a novel materials incremental manufacturing philosophy. LMD can produce net-shape components in a manner of layer-by-layer, directly from the computer aided design model of a desired component by using a computer controlled high power laser as energy source. Powders are simultaneously delivered into the melt pool via a specially designed coaxial nozzle. The nozzle is designed in order that the powder streams converge at the same point on the focused laser beam. Reference Dindaa, Dasgupta and Mazumderb19–Reference Rolink, Vogt, Sencekova, Weisheit, Poprawe and Palm21 LMD provides a powerful way in preparing complex components and allows a high degree of flexibility in the control of the deposited components' geometry, composition, microstructure and performance. Reference Zhang, Sun, Huang and Li22 During LMD process, the material experiences a rapid heating and cooling cycle, which induces a fine microstructure that differs substantially from that of conventional methods processed material. Reference Rombouts, Maes, Mertens and Hendrix23 This process has illustrated important prospects in field of aviation, aerospace, and defense, and aroused wide concerns from research and application departments. Reference Zhang, Shi, Li and Xi24 Recently, the application of LMD process technology is supposed to produce nanocomposites with sound mechanical property performance. However, a vast amount of research is still in demand to study the metallurgical mechanism and microstructural development. The complicated physical nature of LMD, including multiple modes of heat, mass and momentum transfer, was induced by a dynamic laser scanning. Reference Gu25
In the present investigation, LMD process was applied to prepare the TiC/Inconel 625 composites in bulk-form, with different LMD process parameters. The influence of the laser energy input per unit length on the constituent phases and microstructural evolutions of LMD-processed TiC/Inconel 625 composites was investigated and the mechanical performance including densification level, microhardness and wear resistance were evaluated. The relationship between LMD processing condition, microstructural characteristics, and mechanical performance was established and elucidated.
II. EXPERIMENTAL PROCEDURES
A. Powder materials
The gas atomized, spherical Inconel 625 powder with the particle size distribution of 15–45 μm and the irregular-shaped TiC nano-powder with an average particle size of 40 nm were utilized as raw materials in this investigation. The chemical compositions of Inconel 625 powder are 20–23 Cr, 8–10 Mo, 5 Fe, 3.15–4.15 Nb, 1 Co, 0.5 Mn, 0.5 Si, 0.4 Ti, 0.4 Al, 0.1 C, 0.015 S, 0.015 P and balance Ni (wt%). According to a weight ratio of 97.5:2.5, the Inconel 625 and TiC components were homogeneously mixed using a Fritsch Pulverisette 6 planetary ball mill (Fritsch, Idar-Oberstein, Germany) with a ball-to-powder weight ratio of 5:1, a rotation speed of the main disc of 200 rpm and a milling time of 4 h. The shielding gas Argon was added to avoid the powder being oxidized. The uniformly mixed powder was obtained ultimately.
B. LMD process
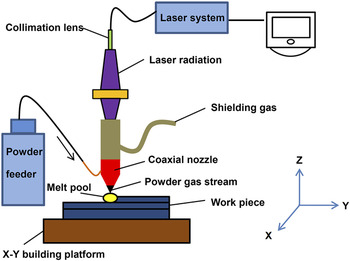
The schematic of the experimental devices is plotted in Fig. 1. LMD processing was carried out with a 5-axis computerized numerical control (CNC) system, a Trumpf Nd:YAG laser system (Trumpf, Stuttgart, Germany) with a maximum output power of 3 kW and a focused spot diameter of 0.6 mm, integrated with a powder feeder system, and a coaxial powder nozzle. The C45 carbon steel was taken as the substrate material. Subsequently, the premixed powder was injected into the melted pool through the coaxial nozzle with a powder feeding rate of 2.4 g/min. At the same time, Argon acted as carrier gas. The laser scan speed (v) was set at 900, 700, 500, and 500 mm/min, and the laser power (P) was set at 500, 700, 600, and 800 W, respectively. Therefore, four different “laser energy input per unit length (E)” of 30, 60, 70, and 100 kJ/m, which was defined by Reference Gu and Shen26 :
 $$E = {P \over v}\quad ,$$
was obtained. The E was applied to assess the effect of different processing parameters on the layer-by-layer deposition process as well as the microstructures and mechanical properties of the composites.
The schematic of LMD experimental devices.

C. Characterization of microstructures and mechanical properties
Cross-sections of LMD-processed TiC/Inconel 625 composite parts were cut, ground, polished and etched with the standard procedures to prepare the samples for metallographic observation. Phase identifications of LMD-processed TiC/Inconel 625 composites were performed by a D8 advance X-ray diffractometer (XRD; Bruker AXS GmbH, Karlsruhe, Germany) with Cu Kα radiation, wave length of λ = 0.15 and 418 nm, at 40 kV and 40 mA, utilizing a continuous scan mode. Microstructures were characterized with an optical microscope and a Hitachi S-4800 field emission scanning electron microscopy (FE-SEM; Hitachi, Tokyo, Japan) at an accelerating voltage of 3 kV. The relative density values were obtained as a result of the density measurements performed by Archimedes principle. The Vickers hardness was measured utilizing a HXS-1000A microhardness tester (AMETEK, Shanghai, China) at a load of 0.2 kg and an indentation time of 20 s. Dry sliding wear tests on the cross-sections of LMD-processed composites were conducted in a HT-500 ball-on-disk tribometer at room temperature. A bearing steel GCr15 ball of 3 mm diameter with a mean hardness of HRC 60 was taken as the counterface material, utilizing a test load of 430 g. The friction unit was rotated at a speed of 560 rpm for 15 min and the rotation radius was 2 mm. The coefficient of friction (COF) was recorded during the wear tests. The wear volumes (V) of samples were determined gravimetrically using
 $V = {{{M_{{\rm{loss}}}}} \over \rho }$
, where M
loss was the weight loss of samples after tests and ρ was the density. The wear rates (ω) were calculated by
 $\omega = {V \over {WL}}$
, where W was the contact load and L was the sliding distance.
III. RESULTS AND DISCUSSION
A. Phase identification
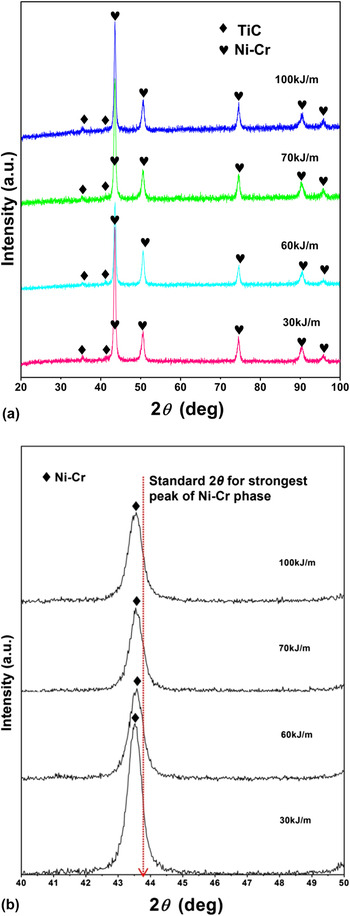
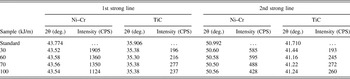
The typical XRD patterns of LMD-processed TiC/Inconel 625 composite parts using different laser energy input per unit length (E) are depicted in Fig. 2(a). As viewed in Fig. 2(a), the strong diffraction peaks corresponding to face-centered cubic γ Ni–Cr matrix and the TiC phase of weak diffraction peak intensities were detected. The 2θ locations and intensities of the detected γ and TiC peaks are listed in Table I for ease of observation and discovery. The greatly weak peak intensities for TiC phase confirmed that though TiC was exist in the composite parts, its volume ratio was very low (Table I). Moreover, the standard diffraction peaks for γ and TiC were taken in Table I for a comparison. As shown in Table I, the 2θ locations of γ matrix phase in LMD-processed composite parts shifted to lower Bragg angles. According to the Bragg's law Reference Zhou and Wu27 :
 $${\rm{2}}d\,{\rm{sin}}\,\theta = n\lambda \left( {n{\rm{\ }} = {\rm{1,\ 2,\ 3,}} \ldots } \right)\quad ,$$
the decreased 2θ values implied an increase in the distance between adjacent lattice planes (d). It may be induced by the distortion of lattice owing to a small amount of alloying element (Mo, Mn, Nb, etc.) producing solid solution with the γ matrix. Furthermore, a careful comparison revealed that the diffraction peaks for Ni–Cr γ phase became considerably broadened with the elevated E [Fig. 2(b)], meanwhile, the overall tendency of the intensities of Ni–Cr γ phase showed a significant decrease (Table I). Since the phase identifications were all performed by a D8 advance XRD with Cu Kα radiation (wave length, λ = 0.15 and 418 nm) at 40 kV and 40 mA, utilizing a continuous scan mode with the same scan speed and other parameters, we can infer the formation of refined crystals and microstructures of γ phase in LMD-processed composites. When the applied E is increased to 100 kJ/m, the intensity of detected γ diffraction peaks became considerably weakened (Table I), verifying the formation of significantly refined microstructures in this case.
XRD spectra of LMD-processed TiC/Inconel 625 composites at different laser energy input per unit length (E): (a) obtained over a wide range of 2θ; (b) obtained within small 2θ in the vicinity of the standard strongest diffraction peaks of Ni–Cr γ phase (2θ = 43.774°).

Identified peaks for Ni–Cr and TiC in LMD processed composites in the vicinity of the 1st and 2nd strong lines for standard diffraction peak of Ni–Cr and TiC.

CPS = counts per second.
B. Densification behavior
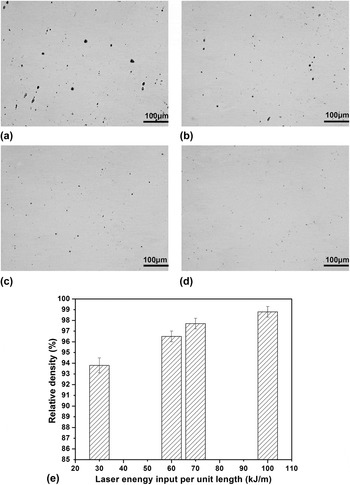
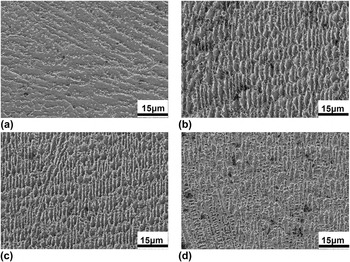
Figures 3(a)–3(d) depict the optical microscopy images showing low-magnification polished cross-sectional microstructures of LMD-processed TiC/Inconel 625 composites using various laser energy input per unit length (E). Meanwhile, effect of E on densification response of LMD-processed TiC/Inconel 625 composites is showed in Fig. 3(e). The microstructures of LMD-processed parts experience significant changes with different applied E, as illustrated in Figs. 4(a)–4(d). Generally, the surfaces of the LMD-processed composite parts had coherently bonded interfaces and free of any apparent micro-cracks. As a relatively low E of 30 kJ/m was used, considerable amount of uneven-distribution and irregular-shape micropores with poor-continuity liquid solidification structures were clearly observed [Fig. 3(a)], and a relative density of merely 93.8% was obtained [Fig. 3(e)]. On increasing the E to 60 kJ/m, the continuity of solidification structures was improved in a certain extent, micropores were found to be diminished and dispersed [Fig. 3(b)] and a higher densification rate of 96.5% was achieved [Fig. 3(e)]. As the applied E is increased to 70 kJ/m, lower porosity volume fraction was observed [Fig. 3(c)] and an increased relative density of 97.7% was attained [Fig. 3(e)]. Furthermore, at an even higher E of 100 kJ/m, almost no pore could be found easily, and the obtainable densification rate of LMD-processed parts generally approached 98.8%, indicating the near-full densification response of TiC/Inconel 625 composites during LMD process [Figs. 3(d) and 3(e)].
Optical microscopy images showing low-magnification cross-sectional microstructures of LMD-processed TiC/Inconel 625 composites using various laser energy input per unit length (E): (a) P = 500 W, v = 900 mm/min, E = 30 kJ/m; (b) P = 700 W, v = 700 mm/min, E = 60 kJ/m; (c) P = 600 W, v = 500 mm/min, E = 70 kJ/m; (d) P = 800 W, v = 500 mm/min, E = 100 kJ/m. Effect of laser energy input per unit length (E) on densification response of LMD-processed TiC/Inconel 625 composites (e).

SEM images showing typical microstructures on the etched cross-sections of in LMD-processed TiC/Inconel 625 composites using laser energy input per unit length (E): (a) P = 500 W, v = 900 mm/min, E = 30 kJ/m; (b) P = 700 W, v = 700 mm/min, E = 60 kJ/m; (c) P = 600 W, v = 500 mm/min, E = 70 kJ/m; (d) P = 800 W, v = 500 mm/min, E = 100 kJ/m.

Because the metallurgical mechanism of LMD-processed TiC/Inconel 625 composites is full melting/solidification forming mechanism, the operating temperature, the attendant liquid spreading, the viscosity, the wettability, and rheological properties influence the densification of the SLM-processed parts.
At an insufficient E, few energies are absorbed within the molten pool. Therefore, the operating temperature in molten pool is relatively low. Consequently, the melting liquid volume is not sufficient and then it solidifies immediately as laser beam moves away, thereby restricting the complete spreading of the melting liquid on the previously deposited layers. It accordingly results in the formation of residual pores in the LMD-processed composites. When an appropriate E is applied, the operating temperature is high enough, resulting in sufficient melting liquid spreading out smoothly. As a result, an improved densification behavior is obtained.
As we all know, the dynamic viscosity (μ) of a molten pool composed by almost a complete liquid formation is strongly temperature-dependent and can be defined by Reference Takamichi and Roderick28 :
 $$\mu = {{16} \over {15}}\sqrt {{m \over {kT}}} \gamma \quad ,$$
where m is the atomic mass, k is the Boltzmann constant, T is the temperature of the molten pool and γ is the surface tension of the liquid. As shown in Eq. (3), the dynamic viscosity is increased at a low operating temperature, which inhibits the melting liquid from spreading out smoothly and hinders forming coherent solidification structures. As a result, a large number of pores form in the specimen and the relative density level reduces. Due to the elevated applied E, resultant increase of temperature in molten pool and liquid volume of melting powder, dynamic viscosity subsequently decreases, which in turn improves rheological properties of the liquid flow in conjunction with solid particles and, accordingly, an enhanced solidification structure densification. As the optimum laser parameters are used, the E is high enough, resulting in an elevated flow speed of the melt in the molten pool. Consequently, liquid spreads out smoothly and the metallurgical bonding between the neighboring layers and scanning tracks are both well developed, hence significantly improving the specimen densification.
Besides, the wettability between the TiC particles and the Inconel 625 matrix are also crucial for the densification behavior of LMD-processed parts. For the completely melted LMD systems, the wetting behavior between the molten system and the solidified preprocessed layer prevails. Wettability can be defined by the contact angle θ
 $${\rm{cos}}\,\theta = {{{\gamma _{{\rm{sv}}}} - {\gamma _{{\rm{sl}}}}} \over {{\gamma _{{\rm{lv}}}}}}\quad ,$$
where γlv, γsv, and γls are the surface tension of liquid–vapor, solid–vapor, and liquid–solid, respectively. γlv may vary during reaction as the reaction product may diffuse into the liquid while γls were normally in linear negative correlation with the operating temperature. Reference Yuan, Ke and Li29 As an increasing E was applied, the elevated operating temperature and decreased γls were obtained, which accordingly decreased the contact angle [Eq. (4)]. Therefore, the improved liquid wettability led to an increment of densification response.
C. Microstructural characteristics evolution
The FE-SEM images showing the microstructure evolutions of LMD-processed TiC/Inconel 625 composites under various laser energy input per unit length (E) of 30–100 kJ/m are exhibited in Fig. 4. Generally, the directional solidified columnar dendrites exhibited distinct variations and were refined with the increase of specific E, as illustrated in Fig. 4. At the relatively low input E of 30 kJ/m, the columnar dendrites were obviously coarsened with the width of 3.80 μm. Moreover, the dendrites were intermittent and fragmentized [Fig. 4(a)]. However, as the E is increased to 60 kJ/m, the typical epitaxial growth columnar dendrites of favorable bonding were formed in this instance. The average width of columnar dendrites decreased below 1.76 μm, which demonstrated a preliminary refined microstructure [Fig. 4(b)]. On increasing the applied E to 70 kJ/m, columnar dendrites showed a further refinement with a mean width of 1.58 μm [Fig. 4(c)]. Furthermore, when the E of 100 kJ/m was used, the slender columnar dendrites exhibited a considerably refined microstructure, meanwhile, the average width of columnar dendrites declined to 1.30 μm [Fig. 4(d)].
As is known, when the laser beam in high energy scans over the powder bed, the energy is rapidly absorbed by the powder. Then, a majority of the heat produced by laser irradiation in LMD process is dissipated through previously solidified materials or the substrate, hence leading to a significant thermal temperature gradient along the building direction. This contributes to the nucleation and epitaxial growth of the representative columnar dendrite structure along the opposite thermal transmission direction. Reference Li, Shi, Wang, Liu and Wang30–Reference Yan, Zhang, Yu, Li and Li32 The reasons of refined microstructure can be summarized in two aspects. On the one hand, the varied internal energy and thermodynamic potentials are induced by heat accumulation and elevated temperature as the applied E increases, which accounts for the microstructure variety. On the basis of previous investigation, the high G/v is treated as the driven force for the nucleation and growth of columnar dendrites with crystallographic orientation, where G is the temperature gradient and v is the solidification speed of crystals. Reference Erukhimovitch and Baram33 With the enhancement of E, more energy is absorbed within the molten pool. Therefore, the operative temperature increases while the liquid cooling time becomes comparatively prolonged. In this instance, the elevated temperature gradient and the resultant decrease of crystal solidification speed supply the strengthened thermal kinetic prerequisite for the orientated growth of columnar dendrites. On the other hand, undercooling also influences the driven force for the nucleation and growth of columnar dendrites. More specifically, the driven force improves with the degree of undercooling increases. Consequently, a larger degree of undercooling of the melt resulting from an increased intensity of laser energy input per unit length, Reference Boccalini and Goldenstein34,Reference Simchi and Asgharzadeh35 facilitates the rapid growth of columnar dendrites in a refined microstructure during solidification process.
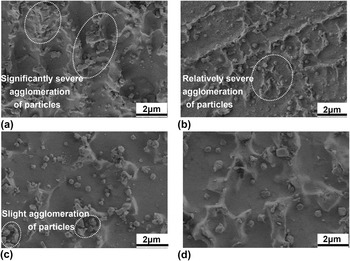
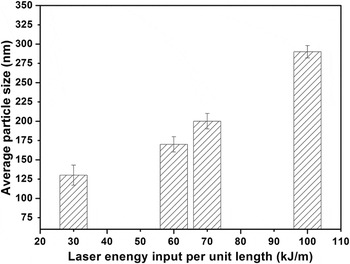
Higher magnifications FE-SEM images on specific positions were used, as revealed in Fig. 5, to investigate the influence of applied E on the microstructural feature evolutions (e.g., characteristic morphology and distribution) of TiC reinforcing particles in LMD-processed TiC/Inconel 625 composites. Figure 6 depicts influence of E on the average sizes of TiC reinforcing particles. Compared with the starting particulate morphology before LMD, entirely different TiC particles with near spherical shaped microstructures were obtained. However, the dispersion state and particle size of TiC reinforcing particles were significantly affected by the applied E. At a relatively low E of 30 kJ/m, the TiC reinforcing particles were unevenly distributed within the matrix, and typically exhibit a high tendency to aggregate into cluster, leading to the formation of severe micrometer-sized agglomerations which were composed of massive TiC particles, as selectively demonstrated in Fig. 5(a). The sizes of the reinforcing particles were measured and the average value reached 130 nm in this instance (Fig. 6). On increasing the applied E to 60 kJ/m, the distribution of TiC reinforcing particles was slightly improved, which could be revealed from the decreased number of particle agglomerations [Fig. 5(b)]. Meanwhile, the mean size of the reinforcing particles was obviously increased to 170 nm (Fig. 6). Moreover, a further increase in applied E to 70 kJ/m led to a slight enhancement in the average size of TiC reinforcing particles to 200 nm, and its distribution was significantly improved, with only several TiC reinforcing particles aggregating into small clusters [Figs. 5(c) and 6]. As the applied E increased to 100 kJ/m, a homogeneous distribution of the TiC reinforcement throughout the matrix was obtained [Fig. 5(d)]. However, TiC reinforcement showed apparently coarsening and the mean particle size increased markedly to 290 nm (Fig. 6). Generally, it could be concluded that the LMD-processed TiC/Inconel 625 composite parts with uniformly distributed submicrometer sized TiC reinforcements was obtained in this case.
High-magnification SEM images showing the microstructural features of TiC reinforced particles using laser energy input per unit length (E): (a) P = 500 W, v = 900 mm/min, E = 30 kJ/m; (b) P = 700 W, v = 700 mm/min, E = 60 kJ/m; (c) P = 600 W, v = 500 mm/min, E = 70 kJ/m; (d) P = 800 W, v = 500 mm/min, E = 100 kJ/m.

Influence of laser energy input per unit length (E) on the average sizes of TiC reinforcing particles.

On the basis of the numerical simulation and experimental investigation of thermal transmission in coaxial laser melting, the powder temperature can reach very high degrees centigrade. Reference Qi, Mazumder and Ki36 Meanwhile, the significantly high activity of nanoparticles is induced by the extremely large specific surface area. As a result, the TiC reinforcing particles are likely to dissolve and reform via a dissolution/precipitation mechanism by means of the heterogeneous nucleation of TiC nuclei and subsequent crystal development.
At a relatively high scan speed v and attendant low applied E, the solidification rate of the liquid front within the molten pool is high enough. Due to the insufficient time provided for grain coarsening, the grain growth of precipitated TiC nuclei is inhibited effectively, hence remaining refined microstructure. The increase of the applied E leads to an elevated thermalization of the energy and attendant thermal accumulation with a higher LMD temperature. The activity of the grains within the TiC reinforcements in the molten pool becomes obviously improved with a slower cooling rate and, thus, the TiC grains have a tendency to grow rapidly. Consequently, the TiC grains become coarsened as the applied E increases to 100 kJ/m.
The distribution of the TiC reinforcing particles mostly depends on the interactions between the solid particles and the dynamic Marangoni flow within the molten pool. Reference Simchi and Pohl37 As we all know, the spatial intensity profile of a laser beam follows a Gaussian distribution. When laser scans over a powder bed, a steep thermal gradient is developed between the center and edge of melt pool at the surface. As the surface tension is a function of temperature, the presence of a temperature gradient and chemical concentration gradient cause a corresponding variation of the surface tension between the center and edge of the melt pool, resulting in the formation of Marangoni convection and resultant liquid capillary force. Reference Niu and Chang38–Reference Lei, Murakawa, Shi and Li40 The liquid flows and wets the solid particles by the action of the Marangoni effect. Subsequently, the liquid capillary force acts on the TiC reinforcing particles and accelerates their movement and rearrangement. As is known, the intensity of Marangoni flow can be estimated using the dimensionless Marangoni number (M a) Reference Arafune and Hirata41 :
 $${M_{\rm{a}}} = {{\Delta \sigma L} \over {\mu {v_{\rm{k}}}}}\quad ,$$
where Δσ is the surface tension difference of Marangoni flow, L is the length of the free surface, μ is the dynamic viscosity, and v k is the kinematic viscosity. The conclusion can be obviously summarized that the intensity of the Marangoni flow is inversely proportional to the dynamic viscosity within the molten pool. As the applied E increases, the intensified Marangoni flow which is induced by the reduced viscosity effectively promotes the rearrangement of TiC reinforcing particles. Consequently, the aggregation of TiC particles is avoided and the formation of uniformly distributed TiC reinforcements is facilitated throughout the finally solidified matrix.
D. Microhardness and wear performance
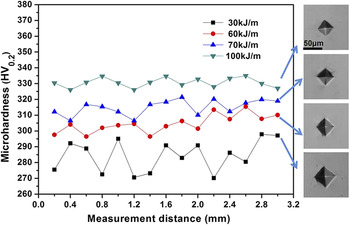
Figure 7 depicts the effect of laser energy input per unit length (E) on the microhardness, its distribution and the formed indentation morphologies after hardness test of LMD-processed TiC/Inconel 625 composites. When using a relatively low E of 30 kJ/m, the average microhardness was ∼285 HV0.2. Meanwhile, the microhardness distribution demonstrated an intensive fluctuation. For a comparison purpose, the pure Inconel 625 part without any reinforcement was prepared using the same LMD parameters and the obtained mean microhardness was generally below ∼280 HV0.2. On increasing the applied E from 60 to 70 kJ/m, the mean microhardness is increased from ∼305 to ∼315 HV0.2, as the size of indentation became small. Meanwhile, the distribution state of microhardness values became steady especially when 70 kJ/m was applied. At an even higher E of 100 kJ/m, uniform distribution of the microhardness with a considerably high average value of ∼330 HV0.2 was achieved. Although the TiC reinforcement was significantly coarsened in this instance, the highest microhardness was obtained. It can conclude that refined crystalline strengthening of TiC reinforcement did not dominate the strengthening mechanisms. Obviously, uniform distribution of TiC reinforcing particles was the main contributions for the microhardness enhancement of LMD-processed TiC/Inconel 625 composite parts.
Effect of laser energy input per unit length (E) on the microhardness, its distribution and the formed indentation morphologies after hardness test of LMD-processed TiC/Inconel 625 composites.

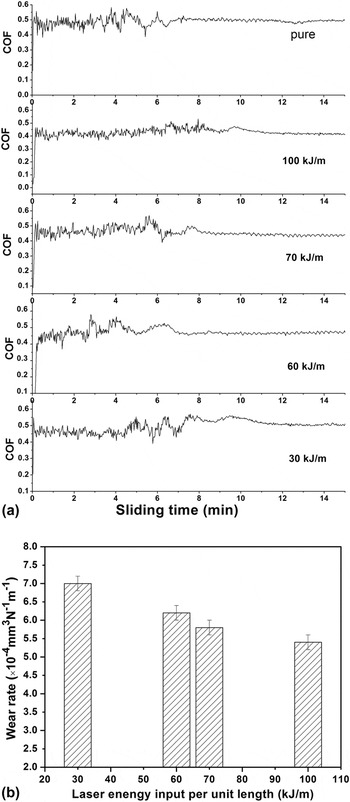
The changes of COF and wear rates of LMD-processed TiC/Inconel 625 composite parts induced by laser energy input per unit length (E) were illustrated in Figs. 8(a) and 8(b), respectively. A comparative study revealed that the incorporation of TiC reinforcements into the Inconel 625 matrix generally demonstrated lower COF and wear rate than that of the pure Inconel 625 part with an average value of ∼0.50 [Fig. 8(a)] and ∼12.8 × 10⁻⁴ mm3/(N m), respectively. It verified that the wear resistance of the LMD-processed TiC/Inconel 625 composite parts was improved obviously. As the given E is increased from 30 to 60 kJ/m, a decrease in the average COF from 0.50 to 0.46 and the attendant wear rate from 7.0 × 10⁻⁴ to 6.2 × 10⁻⁴ mm3/(N m) were gained. When a higher E of 70 kJ/m was applied, the average COF and wear rate of composite part decreased slightly to 0.44 and 5.8 × 10⁻⁴ mm3/(N m), respectively. At an even higher E of 100 kJ/m, the superior wear property was achieved. A uniform distribution of COF with a considerably lower mean value of 0.41 was obtained, leading to the lowest wear rate of 5.4 × 10⁻⁴ mm3/(N m). Furthermore, it was observed that at the initial stage of the wear tests, the COF values were relatively high and exhibited an apparent fluctuation for each specimen. It is believed to be induced by the existence of hard passivation film Reference Bellina, Kargol and Fiore42 on the surface of specimens. However, with the sliding prolongs, the passivation film can be broken easily and shift by the direct sliding with the counterface. As a result, the COF values exhibites a slightly decrease and a relatively steady-state behavior.
Effect of laser energy input per unit length (E) on (a) COFs and (b) wear rates of LMD-processed TiC/Inconel 625 composites.

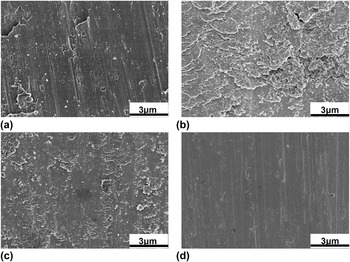
To further ascertain the microstructural characteristics accounting for the wear properties, the morphologies of corresponding worn surfaces are illustrated in Fig. 9. Meanwhile, higher magnifications of typical worn surface microstructure are also investigated for a better understanding of wear mechanisms, as shown in Fig. 10. At a relatively low E of 30 kJ/m, the worn surface was considerably rough [Fig. 9(a)], consisting of deep parallel grooves and granular wear debris [Fig. 10(a)]. Meanwhile, the wear debris mainly consists of ultrafine TiC grains. In this situation, it is believed that the dominant mechanism is abrasive wear, which in turn contributes to the severe friction coefficient fluctuations. The limited wear performance is ascribed to the insufficient densification response of the LMD-processed composite parts due to the formation of micropores [Fig. 3(a)]. Moreover, the agglomerated TiC reinforcing particles [Fig. 5(a)] are prone to split from the coarsened and fragmentized columnar dendritic [Fig. 4(a)]. Consequently, the plowing between the segregated TiC reinforcing particles and the matrix has a tendency to happen under the function of the tangential force, therefore inducing the deep parallel grooves on the worn surface with a limited wear property. As the applied E is increased to 60 kJ/m, the surface of the worn part was relatively rough with the presence of material delamination and spallation, which induced material loss and resultant wear rate [Fig. 9(b)]. Figure 10(b) illustrated that the flake-like wear scars which were adherent on the worn surface, were supposed to be the typical features of adhesive wear. In this situation, the wear mechanism is believed to change from abrasive wear to adhesive wear. The slight delamination and spallation were observed on the worn surface of LMD-processed TiC/Inconel 625 composite at E of 70 kJ/m, resulting in a spot of material loss and slightly lower wear rate [Figs. 9(c) and 10(c)]. In this instance, the favorable relative density [Fig. 3(c)], the formation of the refined columnar dendrites of matrix metal [Fig. 4(c)] combined with the increased microhardness contribute to the improvement of wear performance. When an increased E of 100 kJ/m was settled properly, dense and smooth sliding tracks were achieved ultimately, showing the continuously adherent strain-hardened tribolayer with no apparent local plowing or fracturing on it [Figs. 9(d) and 10(d)]. The hard TiC reinforcements with uniform distribution [Fig. 5(d)] protrude above the matrix in the composite and can play a role of supporting net to help protect the matrix from wear. Meanwhile, the nearly full densification response [Fig. 3(d)], the considerably refined matrix microstructures [Fig. 4(d)] and the enhancement of hardness also favor the improvement in wear property.
SEM images showing worn surfaces morphologies of LMD-processed TiC/Inconel 625 composites using laser energy input per unit length (E): (a) P = 500 W, v = 900 mm/min, E = 30 kJ/m; (b) P = 700 W, v = 700 mm/min, E = 60 kJ/m; (c) P = 600 W, v = 500 mm/min, E = 70 kJ/m; (d) P = 800 W, v = 500 mm/min, E = 100 kJ/m.

High-magnification SEM images showing typical worn surface morphologies in LMD-processed TiC/Inconel 625 composites using laser energy input per unit length (E): (a) P = 500 W, v = 900 mm/min, E = 30 kJ/m; (b) P = 700 W, v = 700 mm/min, E = 60 kJ/m; (c) P = 600 W, v = 500 mm/min, E = 70 kJ/m; (d) P = 800 W, v = 500 mm/min, E = 100 kJ/m.

It can be concluded that densification, microhardness, distribution and microstructure of matrix and reinforcement particles all have important effects on the wear performance.
IV. CONCLUSION
The LMD process has been applied to prepare Inconel 625 matrix composites reinforced with nano-TiC particles successfully. The main conclusions are drawn as follows:
-
(1) The densification levels of LMD-processed TiC/Inconel 625 composites were influenced by the applied laser energy input per unit length (E). When the E of 100 kJ/m was properly settled, a near-full 98.8% relatively density was gained. Nevertheless, other applied E resulted in different degrees of decrease, which was ascribed to the formations of micropores.
-
(2) The columnar dendrites of Ni–Cr γ matrix underwent a series of successive changes: an insufficiently developed, fragmentized, and coarsened microstructure—a preliminary refined microstructure—a considerably refined microstructure, with the increase of the applied E. The TiC reinforcements experienced a successive change in its microstructures from agglomeration to uniformly distribution and coarsening as the applied E increased.
-
(3) When the applied E was properly settled in 100 kJ/m, the TiC/Inconel 625 composites ultimately gained the highest microhardness with a mean of 330 HV0.2. Meanwhile, a uniformly distributed COF with a considerably low mean value of 0.41 was gained during the sliding wear tests, decreasing the wear rate to 5.4 × 10⁻⁴ mm3/(N m). The phenomenon can be ascribed to the improved densification level, the elevated microhardness, the refined columnar dendrites of Ni–Cr matrix, and the uniformly dispersed reinforcements.
ACKNOWLEDGMENTS
The authors gratefully appreciate the financial support from the National Natural Science Foundation of China (Nos. 51322509 and 51575267), the Outstanding Youth Foundation of Jiangsu Province of China (No. BK20130035), the Program for New Century Excellent Talents in University (No. NCET-13-0854), the Science and Technology Support Program (The Industrial Part), Jiangsu Provincial Department of Science and Technology of China (No. BE2014009-2), the 333 Project (No. BRA2015368), Science and Technology Foundation for Selected Overseas Chinese Scholar, Ministry of Human Resources and Social Security of China, the Program for Distinguished Talents of Six Domains in Jiangsu Province of China (No. 2013-XCL-028), the Fundamental Research Funds for the Central Universities (Nos. NE2013103 and NP2015206), the Funding of Jiangsu Innovation Program for Graduate Education (No. SJLX15_0126), and the Priority Academic Program Development of Jiangsu Higher Education Institutions.