Introduction
Deficits in social cognition are a major cause of psychosocial disability in schizophrenia, but the underlying mechanisms remain incompletely understood (Green, Horan, & Lee, 2015, Reference Green, Horan and Lee2019). In addition to the perception of auditory cues and cognitive processing speed, visual scanning of social scenes – the exploration of the scenes with saccadic eye-movements – is an important component of social cognition (Green, Horan, & Lee, Reference Green, Horan and Lee2015; Zaki & Ochsner, Reference Zaki and Ochsner2009). Visual scanning patterns are driven in part by variation in low-level visual features, such as luminance, contrast, and motion speed (Kusunoki, Gottlieb, & Goldberg, Reference Kusunoki, Gottlieb and Goldberg2000; Marsman et al., Reference Marsman, Cornelissen, Dorr, Vig, Barth and Renken2016; Shepherd, Steckenfinger, Hasson, & Ghazanfar, Reference Shepherd, Steckenfinger, Hasson and Ghazanfar2010; White et al., Reference White, Berg, Kan, Marino, Itti and Munoz2017), as well as by as-yet unexplained cognitive factors (Wilming et al., Reference Wilming, Kietzmann, Jutras, Xue, Treue, Buffalo and König2017). Disturbances in the processing of all of these visual features have been reported previously in schizophrenia patients (SzP) (Butler et al., Reference Butler, Abeles, Weiskopf, Tambini, Jalbrzikowski, Legatt and Javitt2009; Calderone et al., Reference Calderone, Martinez, Zemon, Hoptman, Hu, Watkins and Javitt2013; Chen et al., Reference Chen, Palafox, Nakayama, Levy, Matthysse and Holzman1999; Javitt, Reference Javitt2009; Martinez et al., Reference Martinez, Gaspar, Hillyard, Andersen, Lopez-Calderon, Corcoran and Javitt2018; Taylor et al., Reference Taylor, Kang, Brege, Tso, Hosanagar and Johnson2012) and have been linked to social cognitive deficits (Green et al., Reference Green, Horan and Lee2015, Reference Green, Horan and Lee2019; Javitt, Reference Javitt2009). However, how processing of visual features affects visual scanning and in turn social cognition in SzP has not been studied.
To examine the relationship between visual processing, visual scanning, and social cognition, we used a validated naturalistic test of social cognition – The Awareness of Social Inference Test (TASIT) (McDonald, Flanagan, Rollins, & Kinch, Reference McDonald, Flanagan, Rollins and Kinch2003) – while tracking eye-movements. Unlike the static stimuli in traditional tests of social cognition, such as ER-40 or Reading the Mind in the Eyes Test (Pinkham, Penn, Green, & Harvey, Reference Pinkham, Penn, Green and Harvey2015), TASIT contains the motion dynamics of real-word social situations, which are the strongest predictors of visual scanning in naturalistic scenarios (White et al., Reference White, Berg, Kan, Marino, Itti and Munoz2017).
The TASIT consists of a series of video-based vignettes in which 2–3 individuals interact. In each vignette, the main actor is either being sarcastic or lying to another character. In the sarcasm videos, the main actor uses exaggerated facial expressions and auditory prosody to indicate that the intended meaning is counterfactual to the plain meaning of his utterance. Correctly answering the questions about the sarcasm videos, then, requires the viewer to optimally detect both the visual and auditory social cues. By contrast, lies are detected by comparing the content of what the actor is saying to information conveyed elsewhere in the video, so that auditory prosody and facial expression are not critical factors.
SzP show reliable deficits in this task and are particularly impaired in the detection of sarcasm (Pinkham et al., Reference Pinkham, Penn, Green and Harvey2015; Sparks, McDonald, Lino, O'Donnell, & Green, Reference Sparks, McDonald, Lino, O'Donnell and Green2010). Furthermore, TASIT deficits correlate significantly with real-world social functioning, supporting its ecological relevance (Pinkham et al., Reference Pinkham, Penn, Green and Harvey2015). This test thus serves as a potentially powerful platform to use for investigating underlying mechanisms related to social cognition. We hypothesized that visual scanning patterns would differ in SzP compared to HC, and that visual scanning would predict TASIT performance in both groups independent of other relevant factors, such as the detection of sarcasm in spoken sentences, recognition of facial expressions, and cognitive processing speed (Holdnack, Prifitera, Weiss, & Saklofske, Reference Holdnack, Prifitera, Weiss, Saklofske, Weiss, Saklofske, Holdnack and Prifitera2015).
During visual scanning, each saccade represents a decision to move the eyes from the current location to another visual feature that may provide additional information about the social scene (Corbetta, Patel, & Shulman, Reference Corbetta, Patel and Shulman2008; Patel, Sestieri, & Corbetta, Reference Patel, Sestieri and Corbetta2019). Given that faces are a key visual feature used to make inferences about the mental states of the people in the scene, we hypothesized that the divergent visual scanning patterns in SzP would result in decreased viewing of faces.
Sometimes the faces are near the current focus (in central vision, <5° from the fovea or center of the retina) and sometimes they are further away in peripheral vision (>5° from the fovea). In general, SzP are impaired in the processing of low-level visual features that depend on magnocellular visual processing pathways, in particular motion (Butler et al., Reference Butler, Zemon, Schechter, Saperstein, Hoptman, Lim and Javitt2005; Javitt, Reference Javitt2009; Martinez et al., Reference Martinez, Gaspar, Hillyard, Andersen, Lopez-Calderon, Corcoran and Javitt2018). Facial expressions in the real world involve slow subtle movements (Sowden, Schuster, & Cook, Reference Sowden, Schuster and Cook2019), and SzP seem particularly impaired in processing moving facial expressions (Arnold, Iaria, & Goghari, Reference Arnold, Iaria and Goghari2016; Johnston et al., Reference Johnston, Enticott, Mayes, Hoy, Herring and Fitzgerald2010; Kohler et al., Reference Kohler, Martin, Milonova, Wang, Verma, Brensinger and Gur2008). Since magnocellular processing dominates peripheral vision, SzP may have greater deficits in the processing of peripheral v. central moving facial expressions (Dias et al., Reference Dias, Van Voorhis, Braga, Todd, Lopez-Calderon, Martinez and Javitt2020; Javitt, Reference Javitt2009; Martinez et al., Reference Martinez, Gaspar, Hillyard, Andersen, Lopez-Calderon, Corcoran and Javitt2018). Therefore, we examined the visual scanning of faces in peripheral vision relative to low-level visual features (motion, contrast, and luminance), hypothesizing that the likelihood that SzP make saccades to moving facial expressions in peripheral vision would be reduced compared to healthy controls (HC).
However, methods for comparing visual scanning patterns between groups and linking them to the visual features in a video largely do not exist, thus requiring us to adapt or create a number of analytical techniques for this study. A key principle underlying our approach was to use the HC visual scanning pattern as the ‘gold standard’ by which to compare SzP patterns, and then to examine the intervals during which SzP visual scanning patterns diverged from the HC. This approach takes advantage of previous observations that HC show highly convergent scan patterns of naturalistic scenes despite the lack of explicit instruction where to look (Marsman et al., Reference Marsman, Cornelissen, Dorr, Vig, Barth and Renken2016; Wilming et al., Reference Wilming, Kietzmann, Jutras, Xue, Treue, Buffalo and König2017).
We then used neurophysiologically based models of the visual field and saccade generation to examine the relationship of what visual features fell into central v. peripheral vision and visual scanning. Combined with automated detection and classification of visual features, these techniques allowed us to model the processing of the visual scene for each individual in a way that mimics their experience of the visual scanning of real-life social situations, thus allowing us to test our hypotheses about the link between divergent visual scanning patterns and social cognition.
Materials and methods
Participants
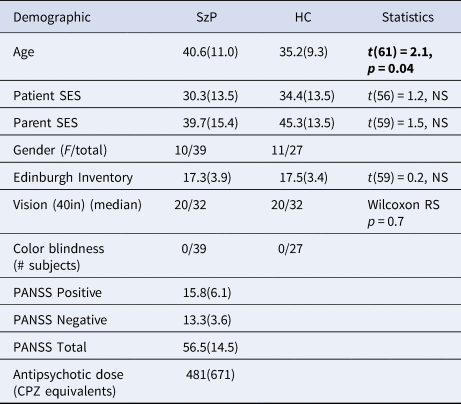
Forty-two SzP and 30 HC were recruited with informed consent in accordance with New York State Psychiatric Institute's Institutional Review Board. Three SzP and three HC were excluded from further behavioral analyses because of problems with the eye-tracking data, such as gross errors in calibration, leaving 39 SzP and 27 HC in the analyses. SzP were moderately ill, domiciled, recruited from the community, and stabilized on medication. HC were demographically matched to SzP with no history of major psychiatric disorders. See online Supplementary Materials for more details.
Behavioral testing
In multiple separate sessions, participants were evaluated on a combination of standard neuropsychological assessments, symptomology scales, and other behavioral tests, including the processing speed index (PSI) in the WAIS-III (Weschler, Reference Weschler1997), Attitudinal Prosody (auditory sarcasm) (Leitman, Ziwich, Pasternak, & Javitt, Reference Leitman, Ziwich, Pasternak and Javitt2006; Orbelo, Grim, Talbott, & Ross, Reference Orbelo, Grim, Talbott and Ross2005), Penn Emotion Recognition (ER-40) (Heimberg, Gur, Erwin, Shtasel, & Gur, Reference Heimberg, Gur, Erwin, Shtasel and Gur1992), and TASIT (McDonald et al., Reference McDonald, Flanagan, Rollins and Kinch2003) with eye-tracking. PSI was chosen to represent cognitive processing speed as it best reflects full-scale cognitive capabilities in SzP and consists of visual search tasks that require visual scanning (Bulzacka et al., Reference Bulzacka, Meyers, Boyer, Le Gloahec, Fond, Szöke and Schürhoff2016). SzP also performed the MATRICS Cognitive Consensus Battery (MCCB) (Nuechterlein et al., Reference Nuechterlein, Green, Kern, Baade, Barch, Cohen and Marder2008).
Group comparisons and correlations
All group and condition comparisons (except for those detailed in Saccades to Visual Features below) were performed using repeated-measures ANOVAs and post-hoc t tests with a threshold of p < 0.05. All correlations between conditions were performed using linear regression, with group co-variance assessed with ANCOVAs. To assess the relative contributions of the various neuropsychological measures to predicting TASIT performance, the z-transformed measures were entered into a linear regression model predicting TASIT performance (also z-transformed) to give their partial correlations. These relative weights were then used to create a composite score to serve as a univariate predictor of TASIT performance. Since HC performance was near the maximum for TASIT, TASIT performance was arcsin transformed to perform Normal statistics.
Visual scanning measures and analyses
To compare variability in visual scanning patterns between groups, we first calculated the mean eye-position and the standard deviation (s.d.) elliptical boundary on each video frame for each group. The elliptical boundary axes were determined by s.d. of the mean x and the mean y positions. We then compared group differences in the ellipse area averaged across frames, correcting for autocorrelation (number_of_frames* = number_of_frames/2T e, where T e is the number of frames the autocorrelation takes to drop to 1/e). We also counted, for each group, the percentage of individuals that fell outside of the HC 2 s.d. elliptical boundary. Each individual HC's eye position was compared to the leave-one-out average and 2 s.d. elliptical boundary derived from all of the other HC.
To assess the degree of divergence of each individual's eye position from the mean HC position, we calculated the z-transformed distance for each individual for each video frame. The z-transformed distance is the distance between the individual's eye position and the mean HC position divided by the standard deviation of the HC eye position distribution (again individual HC were compared against a leave-one-out average of the other HC). This measure (log transformed for Normal statistics) emphasizes divergence by more heavily weighting eye positions that are distant from the HC mean during intervals when HC eye positions are relatively convergent, or when the HC standard deviation is small.
Visual features within the visual field
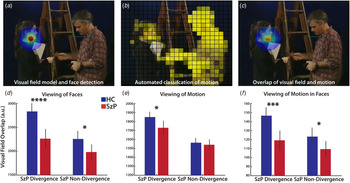
To quantify which visual features each individual looked at, we simulated the visual processing of the video frame using algorithms designed to mimic the processing by visual cortex. We first applied automated detection and outlining of faces to generate binary face masks (Zhu & Ramanan, Reference Zhu and Ramanan2012) (Fig. 3a). Then each video frame was divided into 1°×1° cells and the strength of low-level visual features (motion speed, contrast, and luminance) was quantified for each cell in each video frame (Russ & Leopold, Reference Russ and Leopold2015) (Fig. 3b). These visual features were then temporally smoothed and normalized to the maximum intensity to mimic processing in the visual cortex, and the low-level visual features were multiplied by the face masks to generate maps of visual features within faces.
Viewing of visual features during intervals when SzP eye positions are divergent. (a) Modeling of where in the video frame each participant was looking by centering a visual field model on their eye position (rainbow halo). Green squares represent automated face detection boundaries. (b) Example visual feature map for motion speed, normalized by maximum motion and averaged over previous 133 ms interval. Each visual feature cell was approximately 1° × 1°, with the size rounded to represent each video frame as 25 × 21 cells. (c) The motion map (b) was filtered through the visual field model (a), creating a map of which visual feature the participant was viewing on each frame, weighted by distance from the center of the visual field. Face-masked visual feature maps (f) masked the non-normalized versions of these visual field feature maps with a face mask (square outlines). (d) Faces viewed during SzP divergence v. non-divergence intervals (SzP mean z-transformed distance >2 or <2, respectively; black dotted line in Fig. 1c). The ‘visual field overlap’ measure represents the combination of the time spent viewing a visual feature and the proximity of that visual feature to the center of the visual field. The greater viewing of faces by HC v. SzP during the divergence intervals demonstrates that HC were often viewing faces during these intervals and SzP were not. (e) Viewing of motion during SzP divergence and non-divergence intervals. (f) Viewing of motion within faces during SzP divergence and non-divergence intervals. *p ⩽ 0.05, **p ⩽ 0.01, ***p ⩽ 0.001, ****p ⩽ 0.0001.

To determine which visual features each participant was seeing, we modeled the visual field with a 2D representation of the V4 cortical magnification factor (Sereno et al., Reference Sereno, Dale, Reppas, Kwong, Belliveau, Brady and Tootell1995) centered on the eye position for each video frame and smoothly weighted by its proximity to the center of the visual field (Fig. 3a). This visual field model was then multiplied by each visual feature map to generate a salience map (Fig. 3c). The surface integral of this salience map summarizes how much each visual feature is represented in the visual field for that participant on each video frame. To compare what each group was viewing, these summary measures were averaged across frames and individuals. See online Supplementary Materials for further details.
Saccades to visual features
We next examined the number of saccades made to faces as a function of saccade amplitude in each group. For every saccade made to a face, saccade amplitude was binned by 0.25° intervals for each individual across sarcasm or lie trials before group averaging. To then examine which visual features (motion, contrast, luminance) drove saccades to faces in peripheral vision, we quantified the intensity of the visual feature within that face in the 133 ms interval prior to the saccade. We then plotted the density of saccades as a function of both saccade amplitude and visual feature strength for each group, and then searched the group difference map for significant clusters of saccades. Saccade amplitudes ⩾5° were defined as saccades to peripheral faces, as that amplitude approximates the boundary between foveal and peripheral processing (Nieuwenhuys, Voogd, & van Huijzen, Reference Nieuwenhuys, Voogd and van Huijzen2008) (see online Supplementary Materials for details). False-positive rates were determined by permutation testing, shuffling group labels, and repeating the analysis 10 000 times.
Results
TASIT performance
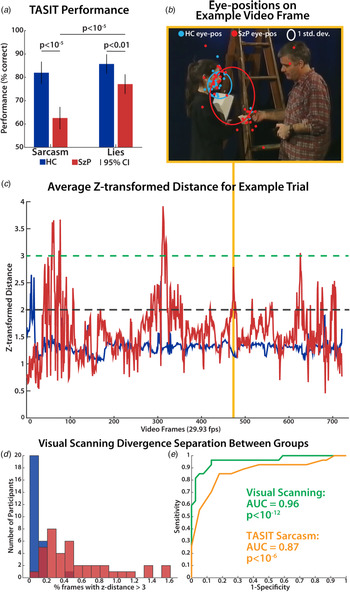
Demographically, SzP were matched to HC, with a small increase in mean age [40.6(11.0) v. 35.2(9.3), p = 0.04] in SzP (Table 1). As predicted, SzP were highly impaired in the comprehension of TASIT clips (group: F 1,64 = 25.63, p < 10−5, Cohen's d = 1.3), with a greater impairment in the comprehension of sarcasm v. lies (group × sarcasm/lie: F 1,64 = 9.43, p = 0.003, Fig. 1a).
TASIT and visual scanning performance. (a) TASIT performance by group where 50% is chance. (b) Example video frame of gaze positions of HC (blue) and SzP (red). HC eye positions in blue are tightly clustered v. the scatter of the red eye positions of the SzP, as demonstrated by the difference in the area of the elliptical boundary representing 1 standard deviation for each group. (c) SzP and HC visual scanning divergence time-course. Divergence measured as average z-transformed distance. Dotted lines mark thresholds for various analyses: green for ROC analyses (Figs 1d and e) and black for visual feature analyses (Fig. 3). (d) Histogram showing the distribution of participants in each group of % video frames with eye position z-transformed distance >3. (e) ROC curves for group segregation based on visual scanning (z-transformed distance >3) and TASIT.

Demographics

The bold text marks the significant results.
Eye position variability and visual scanning performance
Across trials, SzP as a group made more saccades than HC [1009.1(242.1) v. 970.8(233.2), t 15 = 4.6, p = 0.0003] with no difference between sarcasm and lie trials, resulting in a lower mean fixation duration of 536 v. 560 ms. SzP eye positions overall were also more variable across all TASIT video frames compared to HC: the average area of the ellipse representing the standard deviation of the x and y eye position across video frames was 32.5% larger in SzP v. HC (t 880 = 5.0, p < 10−6, ellipses in Fig. 1b).
We further quantified visual scanning variability of each group as the percentage of participants that fell outside the HC 2 s.d. elliptical boundary on each video frame. SzP visual scanning variability was substantial, with an average of 18.7(10.7)% of eye positions more than 2 s.d. from the HC mean eye position, while the HC eye positions rarely deviated [6.1(2.3)%, consistent with a Normal distribution]. Reversing the analysis (comparing all participants to the SzP mean eye position) resulted in 8.7(3.2)% of HC eye positions falling outside the SzP 2 s.d. elliptical boundary compared to SzP [6.2(5.2)%], further supporting increased SzP eye position variability. Moreover, the SzP visual scanning variability was not evenly distributed through all frames of the videos: there were 78 intervals across the 16 videos during which ³50% of SzP were outside of the 2 s.d. ellipse.
SzP visual scanning divergence
To quantify individual visual scanning divergence, we calculated the z-transformed distance of each individual's eye position v. the mean HC position. Across video frames, the SzP mean z-transformed distance of 1.57(0.54) was significantly different from the HC mean z-transformed distance of 1.31(0.16), and did not differ for lie v. sarcasm trials (ANOVA, group: F 2,64 = 5.8, p = 0.02; lie/sarcasm: F 2,64 = 0.05, p = 0.83; group × lie/sarcasm: F 2,64 = 0.2, p = 0.7). Similar to the variability measure above, SzP were not divergent on every video frame. Rather, there were troughs where SzP and HC divergence was similar, and peaks where SzP were much more divergent than HC (Fig. 1c). Applying a divergence threshold of a z-transformed distance of 2 (black dashed line Fig. 1c), we found that SzP diverged on 11.8% of the total frames in 320 intervals.
We then used an ROC analysis to examine whether these SzP divergence peaks were driven by individual outliers or by a systematic deviation across the group. With a threshold of z-transformed distance >2, SzP could be separated from HC with an ROC AUC = 0.83. This AUC was greater than expected by chance (p = 0.002) even given the biasing nature of the analysis, demonstrating that these peaks in SzP divergence were driven by a systematic deviation away from the HC visual scanning pattern during these intervals. Increasing the threshold to z-transformed distance >3 (green dashed line Fig. 1c) generates an ROC AUC = 0.96 (p < 0.0001), substantially better than TASIT sarcasm performance itself (AUC = 0.87, p = 0.05, Figs 1d and e). These results demonstrate the potential of visual scanning as a diagnostic biomarker: if an individual's eye position is >3 z-transformed distance away from the HC mean for more than 0.55 s (0.2%) of the 276 s of TASIT sarcasm video clips, in our sample, they are highly likely to have schizophrenia.
Visual scanning v. TASIT performance
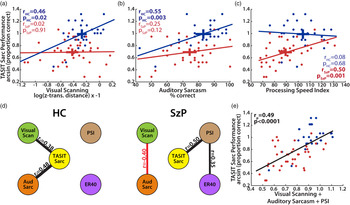
We next examined the relationship of visual scanning and TASIT performance (Fig. 2). The slope of the relationship between scanning behavior and TASIT performance (arcsin transformed for Normal statistics) differed significantly between groups (group × z-distance: F 2,64 = 4.6, p = 0.04), with a significant relationship observed in HC (r = 0.46, p = 0.02) but not SzP (r = 0.02, p = 0.91), indicating that visual scanning performance was related to the comprehension of the TASIT sarcasm videos only in HC (Fig. 2a). Visual scanning performance did not correlate with TASIT lie performance either within or between groups.
(a) Correlation of visual scanning with TASIT sarcasm performance. Crosses represent horizontal and vertical 95% confidence intervals. Visual scanning is measured as z-transformed distance, log transformed for Normal statistics, and inverted so that higher values represent better performance. (b) Correlation of auditory sarcasm detection performance and TASIT sarcasm performance by group. (c) Correlation of cognitive processing speed as measured by the WAIS-IV processing speed index (PSI) by group. (d) Summary of correlations between TASIT sarcasm, visual scanning auditory sarcasm, cognitive processing speed (PSI), and face-emotion recognition (measured by ER-40) in HC and SzP. (e) Correlation of composite score representing the combination of visual scanning, auditory sarcasm, and PSI with TASIT sarcasm performance.

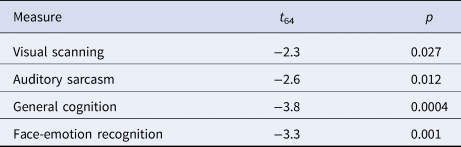
To understand the lack of correlation in SzP, we next explored the relationship of visual scanning and TASIT sarcasm performance relative to measures of other abilities critical for following these social situations: the detection of auditory sarcasm, the speed of cognitive processing (measured by PSI), and face-emotion recognition (measured by ER-40). SzP were significantly impaired in all of these measures (Table 2) with a significant correlation with TASIT sarcasm performance across groups (Table 3). For auditory sarcasm, the group × covariate interaction was not significant, but similar to visual scanning, the correlation was significant in HC (r = 0.55, p = 0.003) but not SzP (r = −0.25, p = 0.12) (Fig. 2b). Cognitive processing speed did exhibit a significant group × covariate interaction but with the opposite pattern as visual scanning and auditory sarcasm, with a strong correlation in SzP (r = 0.50, p = 0.001) but not HC (r = 0.08, p = 0.68) (Fig. 2c). Face-emotion recognition did not exhibit a group × covariate interaction nor a significant correlation within either group (HC: r = 0.20, p = 0.31; SzP: r = 0.30, p = 0.06).
SzP v. HC performance

Predictors of TASIT Sarcasm performance

The bold text marks the significant results.
We next examined which combinations of these measures independently predicted TASIT performance in each group and across groups. For HC, only visual scanning and auditory sarcasm remained significant in stepwise regression (visual scanning: r p = 0.38, p = 0.021; auditory sarcasm: r p = 0.48, p = 0.005) (Fig. 2d). For SzP, only cognitive processing speed remained significant. Combining the three within-group significant predictors of TASIT sarcasm performance (visual scanning, auditory sarcasm, and cognitive processing speed) explained 42% of the variance in TASIT performance across both groups, or 24% of the variance in TASIT performance after accounting for group membership (composite score: F 2,64 = 19.1, p = 0.00005, group: F 2,64 = 13.2, p = 0.0006), with no difference in the relationship between groups (group × composite score: F 2,64 = 0.9, p = 0.34; Fig. 2e). Exploration of the other relationships in SzP revealed a negative correlation between visual scanning and auditory sarcasm (r = −0.40, p = 0.01) not present in HC (r = 0.16, p = 0.4), as well as a positive correlation of face-emotion recognition and cognitive processing speed in SzP (r = 0.35, p = 0.033) but not HC (r = 0.06, p = 0.8, Fig. 2d).
TASIT sarcasm performance in SzP correlated with the MCCB composite score (r = 0.40, p = 0.014), though within MCCB only the Speed of Processing (SoP) domain score (r = 0.45, p = 0.006) was significant. TASIT sarcasm performance in SzP also correlated strongly with the Brief Assessment of Cognition in Schizophrenia Symbol Coding score (BACS-SC, r = 0.43, p = 0.007), but not category fluency (r = 0.24, p = 0.16). Antipsychotic medication dose did not correlate with TASIT performance and controlling for age did not change the above results (details in online Supplementary Materials).
Visual features missed by SzP
We next examined what visual features SzP may be missing compared to HC during the SzP peak divergence intervals (Figs 3a–c for analysis details). A strong group × interval effect (F 2,64 = 40.2, p < 10−7) demonstrated a 20% decrease in the amount of time SzP spent looking at faces during the SzP divergence intervals compared to HC (t 64 = 4.1, p = 0.0001, Fig. 3d). However, for basic visual features (motion, contrast, and luminance), the SzP deficit was much weaker, with a somewhat larger effect for motion v. the other visual features. A group × interval × visual feature effect (F 6,64 = 3.2, p = 0.04) showed that SzP spent a little less time looking at motion (6.5%) during the SzP divergence intervals compared to contrast and luminance (4.1% and 4.5%, respectively, Fig. 3e and online Supplementary Fig. S1).
We also did not find significant differences in the viewing of basic visual features within faces (Fig. 3f and online Supplementary Fig. S1): there were no group × interval × visual feature effects (F 6,64 = 2.3, p = 0.11). In addition, the 18.6–21.0% decrease in the viewing of the three face-masked visual features more closely resembled the 20% decrease in the viewing of faces than to the 4.1–6.5% decrease in viewing the three non-face-masked visual features discussed above, suggesting that the deficit was more specific to viewing faces than any of the basic visual features.
Visual features driving divergent visual scanning patterns
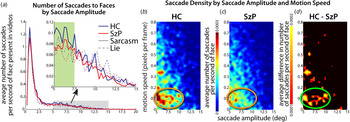
Finally, we examined what visual features may be driving the divergence in the visual scanning of the TASIT videos in the SzP. Both groups made more saccades in sarcasm trials v. lie trials (trial type: F 2,64 = 28.2, p = 10−6) with no significant difference between groups. In total, 18.8% of saccades to faces were made to faces in the periphery (>5°, or more than five boxes in Fig. 3b). Of those saccades, HC consistently made more saccades to faces in the 5–7.5° range than SzP (permutation testing: 10/10 bins, p = 0.037, green zone in Fig. 4a).
Saccades to faces in peripheral vision. (a) Average number of saccades to faces by saccade amplitude for sarcasm and lie trials. Amplitude binned by 0.25°. Gray shaded area shows peripheral field counts highlighted in inset. Green shaded area in inset highlights the saccade amplitudes over which the number of HC saccades was significantly greater than SzP. (b and c) 2D histogram showing the density of saccades to the periphery (gray zone in a) for each group as a function of saccade amplitude and motion speed. Saccade amplitude was binned by 0.25°, and motion speed was binned by 0.0075 (1/80th of the 99.9th percentile of the motion distribution). Orange circles highlight the cluster of missing peripheral saccades in SzP v. HC. (d) Group difference map. Green circle highlights the cluster of missing peripheral saccades in SzP v. HC.

We then quantified the relationship between the amplitude of the saccade to faces and the visual features present in the faces before the saccade. The number (density) of saccades to faces in the peripheral visual field made by each group were stratified by the strength of the low-level visual features in those faces (Figs 4b–d and online Supplementary Fig. S2). For motion, the saccade density plots showed a high-density cluster of saccades in HC to slow-motion speed starting in the 5–7.5° saccade amplitude range and extending to 10° (orange circle in Fig. 4b). This range of speeds (<0.4 pixels/frame) matched that of facial expressions (Sowden et al., Reference Sowden, Schuster and Cook2019). There was no similar cluster in SzP (orange circle in Fig. 4c), leading to a significant group difference (green circle in Fig. 4d, p = 0.008, permutation testing). No clusters survived significance in the saccade density plots for other visual features or for saccade density plots to non-face locations, indicating that the greater number of saccades to peripheral faces in HC was driven specifically by face motion as opposed to other types of motion (online Supplementary Fig. S3).
Discussion
To our knowledge, this is the first study to evaluate the role of visual scanning in the comprehension of dynamic naturalistic social scenes in SzP. There were five main findings. First, as expected, SzP were more impaired in the comprehension of the TASIT sarcasm v. lie videos. Second, SzP visual scanning patterns often diverged from those of HC. Third, visual scanning integrity and auditory sarcasm detection predicted TASIT sarcasm performance in HC, whereas only cognitive processing speed predicted TASIT performance in SzP. Fourth, SzP often missed viewing the faces that drew the gaze of HC. Finally, SzP orient less often to moving facial expressions in the periphery than HC. Overall, these findings suggest that SzP are unable to rely on the detection of moving facial expressions in the periphery to efficiently guide visual scanning of complex dynamic social scenes as HC do, instead relying on alternate strategies that rely on cognitive abilities to, at least partially, overcome the social cognition deficits.
TASIT broadly tests the ability to use auditory and visual social cues to make inferences about the actors' mental states, and correlates with overall social functioning (Pinkham et al., Reference Pinkham, Penn, Green and Harvey2015). Despite the fact that detection of both lies and sarcasm requires inference of the speaker's internal mental state, different types of information are used to make the inference in the two situations. For both lies and sarcasm, the viewer must understand that the communicated information is counterfactual to reality. However, in the case of lies (as portrayed in the TASIT), the information is communicated by comparing the information content of what the main actor is saying at different points in the video.
By contrast, in the case of sarcasm, the information is also communicated through modulation of the tone of voice [attitudinal prosody (Leitman et al., Reference Leitman, Ziwich, Pasternak and Javitt2006, Reference Leitman, Wolf, Ragland, Laukka, Loughead, Valdez and Gur2010)] and facial expressions. The TASIT was normed to be equally sensitive to impairments in sarcasm and lie detection in traumatic brain injury (McDonald et al., Reference McDonald, Bornhofen, Shum, Long, Saunders and Neulinger2006). The differential deficit in sarcasm v. lie detection therefore suggests differential impairment in the ability to utilize sensory information and to orient to critical features of the environment. The specific deficit in the sarcasm v. lie trials also indicates that performance deficits were not caused solely by reduced vigilance due to medications or other reasons, and that SzP were generally able to both follow the dialogue and actions on screen and understand the questions.
The systematic divergence of SzP and HC visual scanning patterns suggests that SzP miss seeing certain visual features that HC spontaneously decide are important, namely faces. The naturalistic stimuli allowed us to explain why SzP may not have been looking at those faces. The failure to process motion (and specifically biological motion) in central vision is not a new finding (Butler et al., Reference Butler, Zemon, Schechter, Saperstein, Hoptman, Lim and Javitt2005; Chen, Levy, Sheremata, & Holzman, Reference Chen, Levy, Sheremata and Holzman2004; Martinez et al., Reference Martinez, Gaspar, Hillyard, Andersen, Lopez-Calderon, Corcoran and Javitt2018; Okruszek & Pilecka, Reference Okruszek and Pilecka2017). However, our findings suggest that motion processing deficits in SzP may have the largest impact in peripheral vision. These peripheral deficits also appear to be independent of previously detailed deficits in face-emotion recognition deficits, usually measured in central vision (Arnold et al., Reference Arnold, Iaria and Goghari2016; Johnston et al., Reference Johnston, Enticott, Mayes, Hoy, Herring and Fitzgerald2010; Kohler et al., Reference Kohler, Martin, Milonova, Wang, Verma, Brensinger and Gur2008). Our findings suggest that the deficits in motion processing in peripheral vision reduce the likelihood that faces are ever brought into central vision for further inspection, and when they are, the previously detailed face-emotion recognition deficits may additionally impact the understanding of the social scene.
The correlation of visual scanning and TASIT sarcasm performance in HC but not SzP suggests that most SzP are unable to rely on stimulus-driven visual scanning to locate these faces. The ones that are able to mimic the HC visual scanning pattern face another problem – they are unable to detect auditory expressions of sarcasm, a negative correlation that suggests that SzP can have intact visual or auditory processing but not both. Instead, the better-performing SzP may be using an alternative strategy, as evidenced by the relationship of TASIT performance with cognitive processing speed in SzP, the correlation between face-emotion recognition and cognitive processing speed, and the specificity of TASIT sarcasm performance correlating with BACS-SC (which requires multiple fast saccades between pre-specified locations) and not category fluency (which does not require eye movements). Rather than the ‘bottom-up’ stimulus-driven strategy employed by the HC, these SzP may be using a ‘top-down’ strategy of targeting saccades to the known locations of the faces and then making fast decisions about the expressions in those faces. This alternative strategy may reflect either compensation or inversely a second deficit in the worst-performing SzP.
While this study provides a framework for how sensory processing deficits can impact social cognition and ultimately social functioning, there remain many gaps to fill. First is to understand what factors account for the ~50% in unexplained variance in TASIT performance between groups: SzP may also have additional impairments in making inferences about mental states that are independent of the sensory deficits and cognitive deficits measured by the PSI (Green & Horan, Reference Green and Horan2010; Pinkham et al., Reference Pinkham, Penn, Green and Harvey2015; Savla, Vella, Armstrong, Penn, & Twamley, Reference Savla, Vella, Armstrong, Penn and Twamley2013).
Another potential source of intergroup variance is the impact of the chronicity of the disease. While medications do not appear to affect social functioning (Velthorst et al., Reference Velthorst, Fett, Reichenberg, Perlman, van Os, Bromet and Kotov2017), many years of the lack of experience with social interactions may have exaggerated intergroup differences through decreased or altered use of the underlying brain circuits. Another gap is understanding what SzP are looking at instead of faces. This will require increased use of automated visual feature detection algorithms to further classify what objects and visual features are on screen at any given time. Another gap is in understanding how these findings, especially the biomarker-like separation of SzP and HC in Figs 1d and e, generalize and replicate, not only in a larger cohort but also with other naturalistic or real-world stimuli. In particular, longer naturalistic stimuli are needed: the short videos of the TASIT prevented us from assessing the number of saccades made to peripheral stimuli in individuals and directly measuring their impact on social cognition. Lastly, these findings need to relate to the measures of brain pathology in SzP, including recent models of how excitatory-inhibitory circuit disturbances in SzP may underlie visual processing and cognitive operations (Anderson et al., Reference Anderson, Tibber, Schwarzkopf, Shergill, Fernandez-Egea, Rees and Dakin2016; Murray et al., Reference Murray, Anticevic, Gancsos, Ichinose, Corlett, Krystal and Wang2014) and how brain areas involved in social cognition (such as those in the temporoparietal junction/posterior superior temporal sulcus, or TPJ-pSTS) may underlie visual scanning behavior (Corbetta et al., Reference Corbetta, Patel and Shulman2008; Green et al., Reference Green, Horan and Lee2015; Patel et al., Reference Patel, Sestieri and Corbetta2019).
Although this study focused on SzP, similar approaches could also be applied to other groups with known social cognitive and functioning deficits (e.g. ASD) (Morrison et al., Reference Morrison, Pinkham, Kelsven, Ludwig, Penn and Sasson2019; Veddum, Pedersen, Landert, & Bliksted, Reference Veddum, Pedersen, Landert and Bliksted2019). The use of naturalistic stimuli paired with the analytical techniques described here will increasingly serve as a bridge between the basic neuroscience literature and clinical studies of patient populations by providing smoothly varying behavioral measures that can be used as regressors to search for neural correlates (Jacoby, Bruneau, Koster-Hale, & Saxe, Reference Jacoby, Bruneau, Koster-Hale and Saxe2016; Russ & Leopold, Reference Russ and Leopold2015). These methods take advantage of not only increased computational power and the associated advances in computer vision, but also the vast literature in visual neuroscience collected over the past four decades. Moreover, the simplicity of administering tests based on naturalistic stimuli promises to produce low-burden and easily deployed clinical assessment tools that directly link the symptoms each individual is experiencing with underlying cognitive and neural deficits, leading the way to individualized treatment regimens aimed at improving social functioning.
Supplementary material
The supplementary material for this article can be found at https://doi.org/10.1017/S0033291720001646
Acknowledgements
We wish to thank Rachel Marsh, Guillermo Horga, and Chad Sylvester for their comments on this manuscript.
Financial support
We wish to thank the funding agencies who supported this work: NIMH (GHP: K23MH108711 and T32MH018870; DCJ: R01MH049334; DAL and RAB: Intramural Research Program ZIA MH002898), Brain & Behavior Research Foundation (GHP), American Psychiatric Foundation (GHP), Sidney R. Baer Foundation (GHP), Leon Levy Foundation (GHP), and the Herb and Isabel Stusser Foundation (DCJ).
Conflict of interest
GHP receives income and equity from Pfizer, Inc through family. DCJ has equity interest in Glytech, AASI, and NeuroRx. He serves on the board of Promentis. He holds intellectual property rights for the use of NMDAR agonists in the treatment of schizophrenia, NMDAR antagonists in the treatment of depression and PTSD, and has submitted disclosures for fMRI-based prediction of ECT and TMS response, and EEG-based diagnosis of neuropsychiatric disorders. Within the past 2 years, he has received consulting payments/honoraria from Cadence, Biogen, SK Life Science, Autifony, Glytech and Boehringer Ingelheim. SCA, DRB, HMD, NES, LPB, JG, AM, RAB, and DAL reported no biomedical financial interests or potential conflicts of interest.