


1. Introduction
Fluidized snow is defined as the condition in which snow particles and air are in motion together. Avalanches and blowing snow are considered to be among the most typical of the naturally occurring phenomena of fluidized snow. The general behaviour of fluidized snow has been shown to be very similar to those of a liquid (Reference Maeno and NishimuraMaeno and Nishimura, 1978, 1979). By the analogy between the motion of snow particles in fluidized snow and the molecular motions in a liquid, it is expected that various transport processes such as energy, momentum, and mass transport are rapid and effective in fluidized snow. If this is the case, the effect might be very important in understanding properly the contribution of motion of snow particles to the exchange of various quantities between a snow surface and the atmosphere.
The purpose of the present paper is to measure the viscosity and heat-transfer coefficients in fluidized snow, and to get insight into the mechanism of transport processes in fluidized snow.
2. Fluidization of snow
The fluidized state of snow was produced by imposing an air flow vertically on a snow aggregate from the bottom in a transparent tube of 40 mm in internal diameter. The temperature of the air was maintained at a constant value in a range from 0°C to —30°C, and the flow rate was controlled with three flowmeters in series. Hereafter the flow rate is expressed as the superficial air velocity u that is defined as the volumetric flow rate divided by the cross-sectional area of the fluidization tube.
Samples of snow aggregates were prepared by disintegration of two snow blocks by rubbing together and sieving. The snow was a pure compact sample collected from a natural snow cover and kept in a cold room at — 15°C for one year. The shapes of individual particles were rather rugged but could be approximated as spheres. The particle sizes were expressed as diameters of circles with equivalent projected areas. The particle size of a snow sample will be specified in the present paper by the diameter of maximum frequency in a histogram such as d = 1.95 mm, 1.25 mm, 1.05 mm, 0.70 mm, and 0.30 mm.
Photographs showing the fluidized snow produced in a transparent tube 40 mm in inner diameter. A: Particle diameter d= 0.70mm, air velocity u = 0.5 m s₋1; B: d = 0.70m, u = 0.6m s₋1; C: d = 1.25mm, u = 0.6 m s₋1. Temperature was — 14°C.

Figure 1 gives some photographs showing the appearance of fluidized snow. Photographs A and B are the cases for snow of particle diameter d =0.70 mm, and C for snow of d= 1.25 mm. Photograph c was taken with a longer exposure time than a and b so that the complex trajectories of snow particles could be recognized more closely. It is seen that the top of the fluidized snow is more clearly defined for larger particles (c): smaller particles are seen to jump about vigorously near the top of the fluidized snow (a and b).
The general behaviour of the fluidized snow resembles that of a liquid. The pressure within the fluidized snow is equal to the weight of snow particles in suspension above a unit area. Buoyancy seems to exist within the fluidized snow, and the volume of the fluidized snow increases with increasing air velocity just as the liquid expands with increasing temperature. More details of the apparatus and features of fluidization of snow have been reported in the previous papers (Reference Maeno and NishimuraMaeno and Nishimura, 1978, 1979).
3. Viscosity of fluidized snow
The viscosity of fluidized snow was measured by means of a modified Stormer-type viscometer (Ueshima VR-801). The rotor consisted of two paddles (13.0 mm - 3.5 mm - 0.8 mm). A constant torque was applied to the rotor set in the fluidized snow, and the time for 100 revolutions was measured by use of a revolution counter and stop watch. The measured time was then converted to the “absolute viscosity coefficient” via calibration with standard oils (Reference Maeno and NishimuraNishimura and Maeno, 1978).
Viscosity coefficient of fluidized snow versus the distance form the bottom of the fluidized snow. M is the mass of snow sample and arrows indicate the positions of the top of the fluidized snow, so that the average densities of the fluidized snow for d =1.95 mm, 1.25 mm, and 0.70 mm are respectively ρ = 439, 256, and 236 kg m₋3at u = 0.53 ms₋1 and ρ= 263, 219, and 206 kg m₋3 at u= 1.06 m s₋1.

Figure 2 shows the measured viscosity coefficient plotted against the distance from the bottom of the fluidized snow. It is to be noted that the viscosity coefficient within the fluidized snow is almost constant, being greater for larger particles and smaller air velocities. As the position of the rotor is moved upward the viscosity coefficient decreases rapidly and approaches that of air, namely 1.65-10₋5 N sm₋2 = 1.65 -10₋2cP at —14°C (Reference FowleFowle, 1933), though it should be noted that the accuracy of the viscometer is not good enough for viscosity coefficients less than about 10₋3 N s m₋2. However, the region of the rapid decrease corresponds reasonably well to the top of the fluidized snow which was determined visually.
Figure 3 gives the viscosity coefficient of fluidized snow as a function of the air velocity, temperature, and particle diameter, which was measured with the rotor fixed at a position(fig 3)30 mm above the bottom of the fluidized snow. The viscosity coefficient decreases rapidly with increasing air velocity, but the rate of decrease becomes relatively small at higher air velocities. The large exponential decrease in the viscosity coefficient cannot be explained by the decrease in the bulk density of the fluidized snow. It was shown previously (Reference Maeno and NishimuraMaeno and Nishimura, 1978, 1979), that the average density of fluidized snow decreases in proportion to

Viscosity coefficient versus the air velocity. The mass of the snow sample is M = 24.8 g (d = 1.95 mm), 28.9 g (d = 1.25 mm), and 29.7 g (d = 0.70 mm).

The viscosity of fluidized snow obtained above is considered to be caused by the momentum transfer due to the collision of snow particles and the turbulent air flow as well as the ordinary molecular viscosity of air. As the kinetic energy of individual snow particles increases with increasing air velocity, the viscosity coefficient is expected to increase as well. However, the rapid decrease shown in Figure 3 suggests that the increase in the area in which each snow particle can move around is more important than the increase in the kinetic energy of snow particles at lower air velocities.
On the other hand, the small rate of decrease at higher air velocities seems to imply that the decrease due to the increase in the area in which each snow particle can move around is counteracted by the increasing turbulence and kinetic energy of particles. The value of the viscosity coefficient in a fully fluidized snow lies around 1 - 10₋3 N s m₋2, which is comparable to that of liquid water at ordinary room temperature.
The effect of temperature on the viscosity coefficient of fluidized snow does not seem important (Fig. 3), but the effect might become predominant at much higher temperatures near the melting point of ice because of the increasing adhesion between snow particles. The effect of particle diameter is rather important; the viscosity coefficient is larger for snow with larger particles (Fig. 3).
4. Heat transfer in fluidized snow
The heat transfer in fluidized snow was studied by measuring the heat-transfer coefficient of the surface of a small sphere suspended in the fluidized snow. A brass sphere 6.0 mm in diameter was cooled to about —70°C by the use of liquid nitrogen or dry ice, and then fixed at an appropriate position in the fluidized snow. The variation of the temperature of the sphere was measured with a copper-constantan thermocouple (0.3 mm in diameter) embedded at the centre of the sphere and recorded on a strip chart or magnetic tape.
When an amount of heat dQ is exchanged between a sphere and the surrounding air in a small time interval dt, the heat-transfer coefficient h is defined as

where A is the surface area of the sphere and θ a and θ S are respectively the temperatures of the surrounding air and the surface of the sphere. When the sphere is small or the thermal conductivity of the sphere is very large so that the temperature gradient within the sphere is negligibly small, θ s can be approximated by the temperature θ of the centre of the sphere. Then a change in the centre temperature dθ in time dt must be written as

where ρ, c, and V are the density, specific heat capacity, and volume of the sphere, respectively. If we put θ = θ b at t = 0, we get from Equations (1) and (2)

Values of θ a, θ b, A, c, ρ, and V are all known so that the heat-transfer coefficient h can be calculated from the slope of the straight line obtained when the logarithm of measured normalized temperature is plotted against time.
Figure 4 shows some examples; it was found that the relationship between the logarithm of normalized temperature and time was essentially linear under all the experimental conditions, which implies the validity of estimating h from Equation (3). It should also be noted in the figure that the heat transfer is markedly enhanced by the air flow and the existence of fluidized snow.
The heat-transfer coefficient was also estimated by taking into account the temperature gradient within the sphere by use of the temperature charts given by Reference Gurney and LurieGurney and Lurie (1923), Reference HeislerHeisler (1947), and Gilmour and others ([c1963]), but no significant differences were obtained from that estimated from Equation (3). Therefore, the heat-transfer coefficient was calculated from the more convenient Equation (3) in the present paper.
Figure 5. shows the heat-transfer coefficient measured at different levels from the bottom of the fluidized snow. Just as in the case of the viscosity coefficient shown in Figure 2, the value of the heat-transfer coefficient near the bottom is almost constant, roughly 170 J m₋2 s₋1 K₋1, and decreases on approaching the top of the fluidized snow. However, the decrease is more gradual than that of the viscosity coefficient, which suggests a difference in the contribution of fluidized snow to each of the two transfer processes.
The heat-transfer coefficient measured 30 mm above the bottom of the fluidized snow is plotted in Figure 6 as a function of the air velocity and particle diameter. The heat-transfer coefficient increases and approaches some constant value around 1 70 J m₋2s₋1 K₋1 with increasing air velocity; the decrease appearing at air velocities above about 1.5 m s₋1 was caused by the loss of snow particles from the system.
Time variation of the normalized temperature of the sphere.

Heat-transfer coefficient in fluidized snow versus the distance from the bottom of the fluidized snow. Arrows indicate the positions of the top of the fluidized snow. The average densities of the fluidized snow are ρ = 276 kg m₋3 at u = 0.53 m s₋1 and ρ = 170 kg m₋3 at u = 1.06 m s₋1.

Heat-transfer coefficient in the fluidized snow versus the air velocity. The solid line G indicates the heat-transfer coefficient calculated from Equation (4).

The solid line G in the figure shows the heat-transfer coefficient calculated from the following equation which has been derived by Reference Ranz and MarshallRanz and Marshall (1952) for a spherical drop in forced convection:

where the non-dimensional parameters, (Nu), (Re), and (Pr), are the Nusselt number, Reynolds number, and Prandtl number respectively, which are defined as follows:

Here D is the diameter of the sphere and ka, ca, ρa, andηa are respectively the thermal conductivity, specific heat capacity, density, and viscosity coefficient of air. It is clearly shown in Figure 6 that the heat-transfer coefficient in fluidized snow is three or four times larger than that in an air flow containing no snow particles. In the figure the values for air velocities less than about 0.5 m s₋1 are cases of resting snow through which air is only percolating without creating fluidization.
A definite dependence of the heat-transfer coefficient on particle diameter could not be found, but it seems that the heat-transfer coefficient in snow of large particles was rather smaller than that of smaller particles. This result seems to be due to the frequency of collision of snow particles being smaller for snow with larger particles. However, this tendency becomes invalid at higher air velocities because of the smaller expansion ratio for the larger particles.
The brass sphere was cooled to about —70°C in the present experiments, so that the effect of the release of latent heat through the condensation of water vapour was anticipated. However, such effects were not found to have an important effect on the measured heat- transfer coefficient. A heat-transfer coefficient was also measured using a brass sphere coated with a 1.0 mm thick ice film, but no significant difference was found in the measured values (Reference Nishiruura and MaenoNishirnura and Maeno, 1978).
5. Discussion
The fluidized state of snow is characterized by the mutual vigorous motion of constituent snow particles. On the basis of the apparent similarity between this motion and that of molecules in a liquid, the process of transfer of various physical quantities in the fluidized snow was expected to be as effective and rapid as in a liquid. The present measurement of viscosity and heat-transfer coefficients has proved that this assumption is reasonable and suggested furthermore the importance of this concept in the analyses of the energy balance between snow and the atmosphere in blowing snow and avalanches.
The viscosity coefficient of fluidized snow obtained above is not the same as that used conventionally for liquids and gases since the former includes contributions of momentum transfer caused by the turbulent air flow and the collisions of snow particles in addition to the molecular viscosity in the shear stress. However, the viscosity of fluidized snow can be treated analogously to that of a liquid if the motions of snow particles are regarded macro- scopically as the molecular motions in a liquid.
Viscosity coefficient of fluidized snow plotted against the reciprocal of the air velocity.

The viscosity coefficient of fluidized snow given in Figure 3 is plotted in Figure 7 against the reciprocal of the air velocity. All the data lie on a straight line if the particle diameter and temperature are fixed. Accordingly, the relation between the viscosity coefficient and air velocity can be expressed as

where η0 and E are constants. On the other hand, it is well known that the molecular viscosity of a liquid is given as

where η0'is a constant, k is the Boltzmann constant, T is the absolute temperature, and E' is the activation energy for viscosity (Moelwyn-Reference Moelwyn-HughesHughes, 1961). Since the physical meaning of the air velocity in the fluidized snow corresponds to that of the absolute temperature in a liquid, that is the measure of activity of particle motions (Reference Maeno and NishimuraMaeno and Nishimura, 1978, 1979), Equation (5) can be regarded as being in this sense identical to Equation (6). Consequently, the constant E in Equation (5) is a quantity which is closely related with the mechanism of viscosity in the fluidized snow.
It should be noted in Figure 7 that every line for a given particle diameter and temperature is composed of two straight lines with different slopes, i.e. different values of E. This result suggests that at least two different mechanisms are at work in the viscosity of fluidized snow. The detailed processes are not certain, but the following might be probable: in the region of smaller E, namely at lower air velocities, the particle motions are not active enough, and the turbulent air flow is more important in determining the viscosity of the fluidized snow, while in the region of larger E, namely at higher air velocities, snow is fully fluidized and the particle motions arc more important. In the previous papers (Reference Maeno and NishimuraMaeno and Nishimura, 1978, 1979) a buoyant force was demonstrated to act on an object in a fluidized snow. It might be of practical importance to recognize that this viscosity and buoyancy are necessary for vehicles and men to be able to move or float in fluidized snow, e.g. in avalanches.
The heat-transfer coefficient in a fully fluidized snow was found to be three or four times larger than that when the air flow contained no snow particles (Fig. 6). The increase is considered to be caused by the enhanced turbulence of air flow and collision of snow particles. We now try to estimate their relative contributions. It seems reasonable to consider that the heat-transfer coefficient in fluidized snow, h, can be decomposed into three components as

Here h a is the heat-transfer coefficient when the air flow contains no snow particles, h f is the amount of increase in the heat-transfer coefficient due to the fluidization of snow, and ht and h p are the components of h f attributable to the enhanced turbulence and to the collision or approach of snow particles, respectively.
If it is assumed that the heat-transfer coefficient measured just above the top of the fluidized snow, where no snow particles exist but the turbulence of the air flow remains, is equal to the quantity (ha+h t), all the three components of h can be estimated from the data shown in Figures 5 and 6. The results are given in Table 1, which shows that 80 to 90% of the increase in the heat-transfer coefficient in the fluidized snow is attributed to the direct collision or approach of snow particles. T his result is in good agreement with that obtained by Reference Ziegler, Ziegler, Koppel and BrazeltonZiegler and others (1964) and Reference ShiraiShirai and others (1965) for Celite and steel spheres immersed in alumina and other particles. It can be concluded that the heat transfer in the fluidized snow is predominantly dependent on the motion of snow particles.
So far we have been concerned with the viscosity and heat transfer in the fluidized snow which was produced by vertical air flow. Figure 8 gives three photographs showing the motions of snow particles in a blowing snow which was produced by horizontal wind in a cold wind- tunnel at — 9.3°C. The working cross-section and length of the wind-tunnel were respectively (Table)(Fig 8)0.5 m - 0.5 m and 8.0 m, and the wind velocity at the centre of the cross-section was maintained at 6.0 m s₋1. The typical motions of snow particles known in blowing snow including the creep, saltation, and suspension in the air (Reference MellorMellor, 1965), can be clearly recognized in the various trajectories of snow particles in the photographs. Accelerations and decelerations of the velocity of each particle can be estimated from the time marks on each trajectory, though this will not be discussed further here.
VALUES OF HEAT-TRANSFER COEFFICIENT

Photographs showing the particle motions in blowing snow produced in a cold wind-tunnel at —9.3°C. The time interval marked on each trajectory of snow particles is 3.6 ms. The direction of wind is from the right to the left.
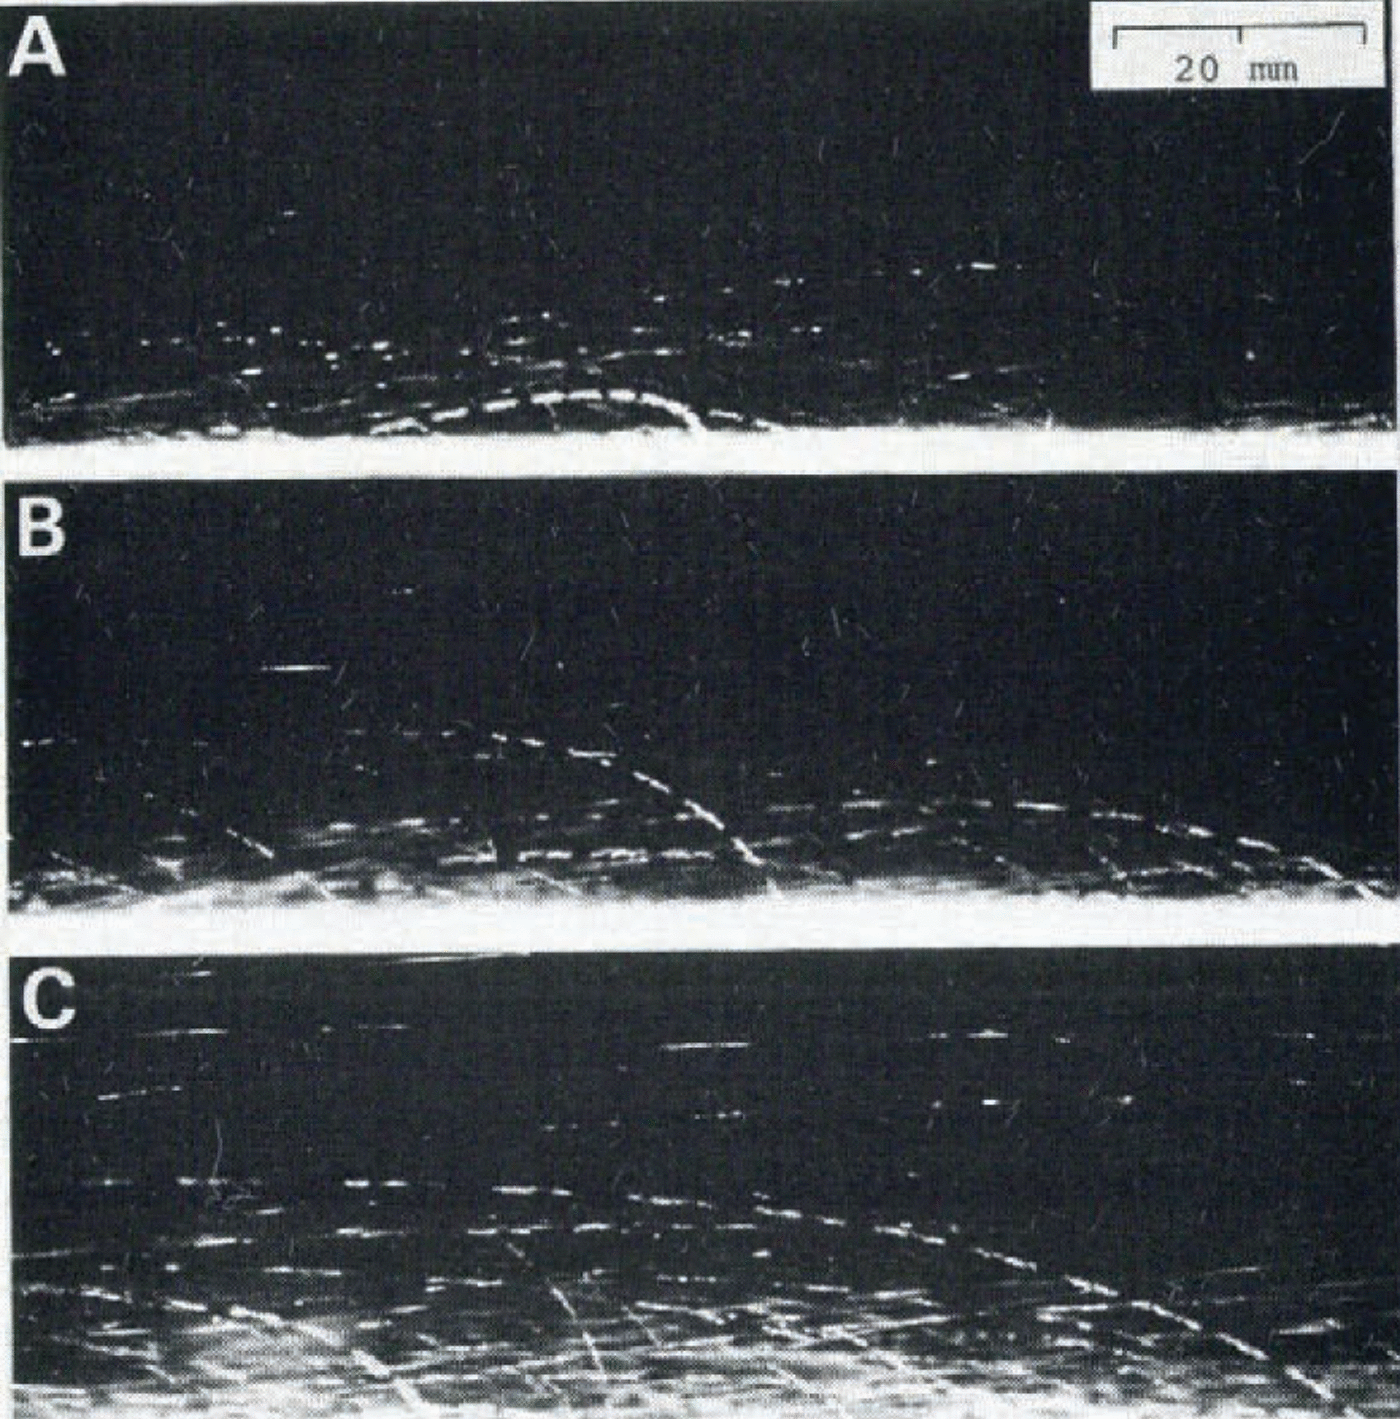
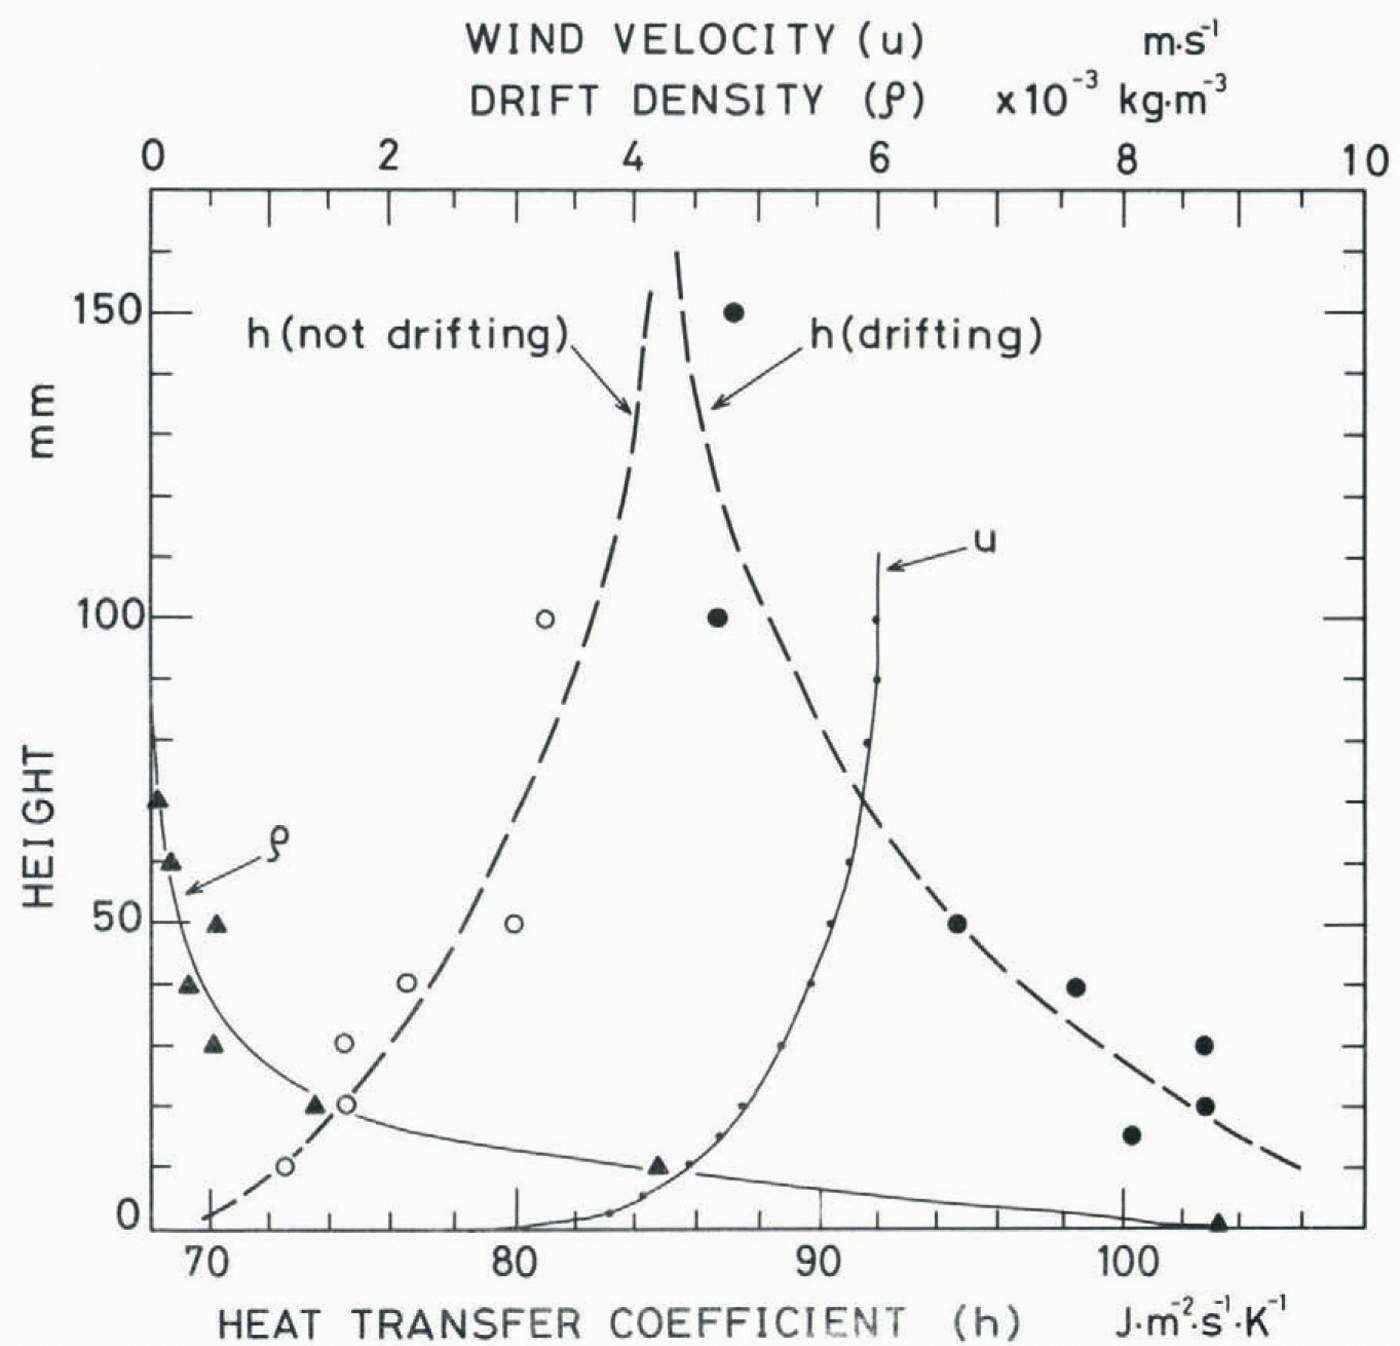
Figure 9 is a photograph of the same region as Figure 8, which was taken with a single shot of screened stroboscopic light lasting for 25 μs. The drift density, ρ, was calculated from the number of snow particles on these photographs by assuming that the average radius of the snow particles was 100 μm. The result is shown in Figure 10, together with the mean air velocity u measured with a Pitot tube and the heat-transfer coefficient h measured by the same method as mentioned above.
When the wind was blowing without causing the movement of snow particles, the value of the heat-transfer coefficient was larger at higher positions and smaller at lower positions, corresponding to the wind profile accompanied by the turbulent boundary layer of about 90 mm in thickness. On the other hand, when a small amount of seed snow particles was supplied far off to windward to trigger the occurrence of the blowing snow and a layer of fluidized snow was created near the surface as shown in Figures 8 and 9, the value of the (fig 9)(fig 10) heat-transfer coefficient near the surface increased markedly, corresponding to the profile of the drift density. More detailed analyses of the experiment together with measurements in natural blowing snow are in progress, and the results will be published in the near future.
Photograph of snow particles in blowing snow taken under a single shot of screened stroboscopic light lasting 25 µs. The experimental condition is the same as in Figure 8.

Acknowledgements
The authors are indebted to Mr K. Araoka for his cooperation in taking photographs of the motion of snow particles. The study was partly supported by the special fund for Scientific Research of the Ministry of Education, Science, and Culture, Japan.



