The amino acid glutamine is extremely abundant in almost all proteins in the animal body. Besides being incorporated into proteins, glutamine exists as a free amino acid in e.g. liver, muscle, blood and milk. Glutamine is classified as ‘non-essential’ because the organism apparently is capable of synthesising the amount needed in the functional body. However, during the last decades it has become increasingly clear that glutamine serves several unique functions in the body. It is a respiratory fuel for rapid proliferating cells, such as enterocytes, a regulator of acid-base balance through the production of urinary ammonia, a carrier of nitrogen between tissues and an important precursor of nucleic acids, nucleotides, amino sugars, and proteins (Lacey & Wilmore, Reference Lacey and Wilmore1990). Glutamine is synthesised in various tissues where the responsible enzyme, glutamine synthetase, is located, muscle cells being especially important. The intracellular concentration of glutamine in muscle is considerable compared to other free amino acids and glutamine is the most abundant free amino acid in blood plasma. Glutamine is actively translocated between body compartments and has been identified as a potential biomarker for ketotic conditions and fatty liver diseases (e.g. Heitmann & Bergman, Reference Heitmann and Bergman1980; Imhasly et al. Reference Imhasly, Naegeli, Bauman, von Bergen, Luch, Jungnickel, Potratz and Gerspach2014).
Milk production in high yielding dairy cows represents a metabolic stress comparable to fasting or acidosis (Meijer et al. Reference Meijer, van der Meulen, Bakker, van der Koelen and van Vuuren1995). These authors demonstrated a marked decline in plasma glutamine and glutamate from late pregnancy to 6–15 weeks into lactation in the cow. The decrease exceeded that of the essential amino acids in plasma and contrasted strongly with other non-essential amino acids. These observations led the authors to postulate that ‘the glutamic acid pool’ in the mammary gland and especially glutamine is potentially a limiting amino acid for milk protein synthesis in the high yielding dairy cow.
Glutamine has two amine moieties, an α-amino group, and an easily hydrolysed terminal amide group. Glutamate is formed when the terminal amide group is cleaved, this may happen enzymatically or ‘spontaneously’ through heat or low pH. Glutamine is consequently rather labile, and not all analytical methods can distinguish between glutamine and glutamate.
Free glutamine and glutamate deserve more attention in ruminant and lactation physiology. The present study describes a new enzymatic-fluorometric method for detection of free, unbound glutamine and glutamate in blood plasma and raw milk. We further elaborated on the well described chemical determination of free primary amino groups in biological matrices.
Materials and methods
Free (primary) amino groups
A measure for the sum of all free amino groups was based on the fluorescence reaction between amino groups and o-phthaldialdehyde and 2-mercaptoethanol (OPA-SH; Roth, Reference Roth1971). Not all amino acids give the same fluorescence in the reaction, hence a semi quantitative measure. Plasma and raw milk samples were mixed with 2 volumes of 99% ethanol to precipitate intact proteins. The mixture was centrifuged at 3500 g for 10 min, the supernatants were used for analyses and 50 µl of this supernatant were pipetted into wells of a black micro plate and placed at 65 °C until the liquid phase was evaporated (1 h). Thereafter, 50 µl of 20 mmol/l boric buffer (pH 9·0) was added to re-suspend the supernatant, and finally 200 µl OPA-SH reagent was added (7·5 mmol/l OPA and 28 mmol/l 2-mercaptoethanol in 100 mmol/l boric buffer). The reaction was read by fluometry after 2 min (exitation 355 nm and emission 460 nm; FLUOstar, Galaxy, BMG Labtechnologies, Germany). Standards (0–2000 µM) prepared in 20 mmol/l boric buffer were based on glutamic acid (molecular weight 187·14), and treated as samples. Control samples (71; 142; and 355 µmol/l glutamic acid; and 91; 182; and 455 µmol/l glutamine) were treated as samples as well. The OPA-SH reaction was expressed as milli equivalents of glutamate per litre (m.eqv./l).
Glutamine and glutamate (Gln & Glu)
Analyses of l-glutamine and l-glutamate were principally based on the classical UV-method (Lund, Reference Lund and Bergmeyer1990); however, with several modifications and transformed from spectrophotometric to fluorometric detection. Hydrazine was not used to trap 2-oxo-glutarate but the fluophore resazurin that was used in the present method is reduced by the developed NADH, thereby pulling the entire process towards 2-oxo-glutarate. In summary, the process follows the reactions scheme:
-
(a)
 $\hbox{L-glutamine} + {\rm H}_{\rm 2} {\rm O} \to \hbox{L-glutamate} + {\rm NH}_{_4} ^+ $
mediated by Glutaminase (EC 3.5.1.2)
-
(b)
$\hbox{L-glutamate}+ {\rm NAD}^+ + {\rm H}_2 {\rm O} \to 2\hbox{-oxoglutarate} + {\rm NH}_{_{\rm 4}} ^ +$
+ NADH mediated by Glutamate dehydrogenase (EC 1.4.1.3) -
(c) Resazurin + NADH → resorufin + NAD+ mediated by Diaphorase (EC 1.6.99.1)


Plasma and milk samples were mixed with 2 volumes of 99% ethanol to precipitate intact proteins and other constituents. The mixture was centrifuged at 3500 g for 10 min, the supernatants were used for analyses. Samples of 120 µl of this supernatant were pipetted into wells of a black micro plate and placed at 65 °C until the liquid phase was evaporated (1 h). Wells were re-suspended with 130 µl of 100 mmol/l phosphate buffer, pH 5·2, with glutaminase (EC 3.5.1.2, from E. coli) for the detection of the sum of glutamine and glutamate, and without glutaminase for the detection of glutamate only (glutaminase concentration was 20 U/ml in the reaction volume). After incubation for 1 h at 37 °C, 60 µl Tris-buffer (800 mM pH 9·0), with ADP and EDTA was supplied, and further 40 µl of aqueous solutions of NAD and GlDH enzyme (EC 1.4.1.3) was supplied. Finally, 50 µl of the fluophore solution was added: Resazurin (0·75 mmol/l) and diaphorase (EC 1.6.99.1; 11 U/ml). The final concentration of GlDH, NAD, ADP, and EDTA, in the reaction soup was 3·2 U/ml, 2·0 mmol/l, 50, and 100 µmol/l, respectively. Plates were read by fluorometry (excitation 544 nm, emission 590 nm) in a fluorometer (FLUOstar/Galaxy, BMG, Germany), 50 min after addition of the fluophore solution.
Standards were prepared from Na-glutaminate (molecular weight 187·14), i.e. 0, 50, 100, 200, 400, 600, 800, and 1000 µmol/l, and treated like samples. Control samples and spiking material were prepared from pure Na-glutaminate and l-glutamine (molecular weight 146·1). Samples and control solutions were pipetted by hand, reagents by a Biomek 2000 System (Beckman Coulter, Fullerton, California, USA).
Validation of the assay, free amino groups
Validation procedure for milk and plasma analyses was identical. A total of 4 milk and 4 plasma samples from dairy cows were spiked with 0, 59, or 178 µmol/l Na-glutaminate and/or 0, 76, or 228 µmol/l l-glutamine, in a factorial design. Two replicates were placed on each plate, i.e. 4 (milk samples) × 2 replicates × 3 levels of glutamic acid × 3 levels of glutamine × 4 (plates, days), i.e. 288 samples. Both glutamate and glutamine were expected to give a chemical response equal to glutamate in the standard curve. Results are consequently given as milli equivalents of glutamate per litre.
Validation of the assay, glutamic acid and glutamine
Validation of milk and plasma samples was similar to that above indicated. 4 milk (plasma) samples were spiked with 0, 59, or 178 µmol/l Na-glutaminate and/or 0, 76, or 228 µmol/l l-glutamine in a factorial design, i.e. 4 (samples) × 3 levels of glutamic acid × 3 levels of glutamine, all combinations tested with and without glutaminase enzyme × 4 (plates, days), i.e. 288 samples.
Statistical calculations were by proc ANOVA, SAS 9.4 (SAS Institute, Gary, North Carolina, USA).
Results and discussion
Validation of the assay for free amino groups, milk
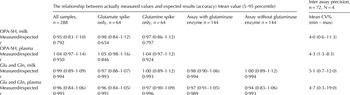
The used milk samples revealed 1·32; 1·27; 1·40; and 1·13 m.eqv./l, respectively without standard addition of glutamic acid or glutamine, P < 0·05 (LSD0·95 = 0·020). Generally, spiking with both glutamate and glutamine increased the chemical response (P < 0·001). All samples considered together (n = 288) revealed a ratio between the measured value and the expected value of 0·95, indicating that 95% of the expected amounts of intrinsic and spiked glutamate and glutamine were recovered. Detailed results are shown in Table 1.
Milk and plasma samples were spiked with 3 × 3 levels of glutamine and glutamate

OPA-SH = chemical analyses for free amino groups.
Glu (glutamate) and Gln (glutamine) = chemical analyses for free glutamate and glutamine.
r = correlation coefficient between measured values and expected values.
All correlations shown are P < 0·001.
Validation of the assay for free amino groups, plasma
Plasma samples were 0·876; 0·858; 0·825; and 0·862 m.eqv./l, respectively without standard addition of glutamic acid or glutamine, P < 0·05 (LSD0·95 = 0·011). The details of the validation appear in Table 1.
Validation of the assay for glutamate and glutamine, milk
The differences between measurements of (glutamine + glutamate) and glutamate only, were in all four instances below 8 μmol/l, indicating that the free glutamine content of the milk was negligible. The glutamate content, on the other hand, was 180; 298; 44; and 79 µmol/l (P < 0·001, LSD0·95 = 2·1), respectively. The addition of glutaminase and spiking with glutamate and glutamine significantly increased the response, see Table 1 for details.
Validation of the assay for glutamate and glutamine, plasma
Plasma samples contained 63; 68; 59; and 56 µmol/l glutamate. Correspondingly, the glutamine content was measured to 155; 189; 218; and 198 µmol/l (P < 0·001; LSD0·95 = 2). The spiking with glutamate and glutamine and the addition of glutaminase enzyme in all instances gave increased measurements (P < 0·001). Detailed results are shown in Table 1.
The present analyses of free amino groups and glutamate and glutamine are based on the assumption that most of the protein and peptide in plasma and milk are precipitated by the chosen pretreatment, i.e. 1 volume of samples were added 2 volumes of 99% ethanol. We did not validate this assumption exhaustively, however, both milk and plasma appear totally transparent after the pretreatment. Furthermore, the precipitate deposits as a solid fraction at the bottom of the tube. Another prerequisite important for the present setup is the actual solubility of amines and amino acids in 66% aqueous ethanol. Most amino acids are soluble under these conditions (2–60 mM), far above the necessary level for the present purpose, including glutamate and glutamine (>2·5 and 15 mM, respectively: Dunn & Ross, Reference Dunn and Ross1938; Nozaki & Tanford, Reference Nozaki and Tanford1971).
Several fluorogenic reagents have been used in amino acid analyses after pre- and post- column derivatisation, and OPA-SH has been widely used due to a relatively high fluorescence quantum, i.e. strong fluorescent signal. The major disadvantages of using OPA-SH are the low reactions rates with cysteine and lysine, no response to secondary amino acids such as proline and hydroxyproline and the slow decay in the fluorescence signal from the derivatised amino acids. However, these circumstances are of only minor importance in the present situation. In this study, the OPA-SH reaction represents a repeatable subset of free amines in milk and plasma supernatants, not the absolute amount.
The four dairy cow plasma and milk samples used in the validation process of the glutamate and glutamine assay reveal values for free, unbound glutamine and glutamate in good accordance with values obtainable from the literature. The present four cow plasma samples revealed from 155–218 µmoles of glutamine per litre. Most studies on lactating dairy ruminant plasma glutamine show levels between 90 and 330 µmoles per liter (e.g. Meijer et al. Reference Meijer, van der Meulen, Bakker, van der Koelen and van Vuuren1995; Plaizier et al. Reference Plaizier, Walton and McBride2001; Torres dʼPaula et al. Reference Torres dʼPaula, Martinez, de Almeida Craveiro Alves, Mélo, Kutschenko, Nogueira, da Costa Cordeira Manso and Filho2014). Similarly, the same studies show plasma glutamate levels from approximately 30 to 100 µmoles per litre (the present study showed 56–68 µmoles per litre). The above mentioned studies have used various methods of protein precipitation of the sample and various analytical principles (enzymatic-spectrophotometric, ‘amino acid analysers’, GC-MS). Literature on free glutamate and glutamine in cow's milk are scarce. Torres dʼPaula et al. (Reference Torres dʼPaula, Martinez, de Almeida Craveiro Alves, Mélo, Kutschenko, Nogueira, da Costa Cordeira Manso and Filho2014), found 80–170 µmoles per litre for glutamine and 300–440 µmoles per litre for glutamate.
Conclusions
The present enzymatic-fluorometric procedures for determination of glutamic acid and glutamine in plasma and milk have proved to be reliable methods, whose precision and accuracy are acceptable for descriptive as well as analytical purposes. The methods responded linearly to standards and to spiking of the respective matrices. The pretreatments of the samples are simple and safe and gentle to the operator as well as the analytes, i.e. the amino acids in the matrices intended to be quantified. The analyses dealt with are easily performed within one working day, allowing for ‘high throughput’ assays of animal trials.
Jens Clausen and Carsten Berthelsen are kindly acknowledged for their skilful technical assistance during the course of the work.