





In the United States (US), type 2 diabetes, cardiovascular disease, and obesity disproportionately affect individuals with low incomes as well as racially and ethnically minoritised groups(Reference Joseph, Ortiz and Acharya1,Reference Falbe, Cotterman and Linchey2) . Key contributors to these conditions include excess consumption of certain foods and beverages (e.g. salty snacks, processed meats, sugar-sweetened beverages) with high levels of added sugars and sodium(Reference Stanhope3,Reference Whelton, Appel and Sacco4) . Stores, which provide over two-thirds of calories consumed, are an important environment for improving dietary behaviours(Reference Liu, Micha and Li5). Checkout areas of stores, in particular, are known to trigger impulse purchases of less healthy products, such as sodas and candies(6). Furthermore, parents and consumers with a lower socio-economic status are more likely to be exposed to unhealthy foods and beverages at checkouts and more likely to purchase foods and beverages placed at checkout, which may be the consequence of predatory marketing tactics by food and beverage companies(6–Reference Falbe, White and Sigala8).
A promising policy response to address the high prevalence of unhealthy foods and beverages placed at checkout, and curb impulse purchases of such products, is the implementation of healthy checkout policies(Reference Falbe, Marinello and Wolf9). These policies, which set nutritional standards for foods and beverages displayed at retail checkouts, have the potential to nudge healthier food and beverage selections and improve nutrition equity(Reference Falbe, White and Sigala8). In 2021, Berkeley, CA became the first jurisdiction to implement a healthy checkout ordinance (HCO) for large stores (>2500 ft2 [>232 m2]) that sell at least 25 linear feet (7·6 linear meters) of food. Under the Berkeley HCO, beverages with (caloric or non-caloric) sweeteners and foods with >5 g of added sugars or >200 mg sodium per serving are prohibited from being displayed at checkout. In addition, only fruits, vegetables, legumes, nuts, seeds, some dairy products, whole grains, and sugar-free gum and mints that meet the nutrient limits are permitted(10). Evaluations of this policy to date have found significant improvements in the healthfulness of foods and beverages displayed at store checkouts. For example, 1 year after implementation, 60 % of food and beverage products at checkout in Berkeley were compliant with the policy, due to a significant reduction in candy and sugar-sweetened beverages and a significant increase in unsweetened beverages and healthy foods(Reference Falbe, Marinello and Wolf11). Moreover, there were significant reductions in added sugars, calories, and saturated fats, and a significant increase in fibre content of foods and beverages at checkouts in Berkeley relative to comparison cities(Reference Reimold, Wolf and Matas12).
Inspired by Berkeley’s HCO, Perris, CA, became the second city in the US to implement an HCO in 2023, and most recently, Contra Costa County became the first to adopt an HCO at the county level, enacting nutrition standards for products at store checkouts(13,14) . In the United Kingdom (UK), a 2019 study on voluntary but meaningful supermarket policies that aimed to reduce confectionaries and salty snacks at checkout found significant reductions in the purchase of these products after policy implementation(Reference Ejlerskov, Sharp and Stead15). Ultimately, this led to the implementation of a mandatory policy in the UK in 2022 that restricts products high in saturated fat, salt, or sugar from being placed at checkouts and other prominent store locations(16).
Healthy checkout policies have the potential to reduce the incidence of diet-related diseases by decreasing the availability, and thus potentially the purchase and consumption, of unhealthy foods and beverages that currently dominate most US store checkout areas(6,Reference Ejlerskov, Sharp and Stead15) , yet influences on public support of these policies remain understudied. Research indicates that how policymakers and advocates frame a policy (i.e. how they explain a policy’s rationale to the public) affects public support(Reference Cannon, Farkouh and Winett17,Reference Niederdeppe, Porticella and Shapiro18) . Indeed, researchers have speculated that the message framing around healthy checkout policies plays a critical role in shaping public support(Reference Reimold, Hall and Ng19). However, no study to date has examined how to best frame a healthy checkout policy to garner public support.
Therefore, the primary objective of this experimental study was to determine which of four different message frames garner the highest public support for a healthy checkout policy. Existing research suggests that there may be increased acceptability for nutrition policies when they appeal to personal and community values(Reference Dorfman and Wallack20,Reference Cullerton, Donnet and Lee21) . In Berkeley and Perris, examples of messages used by the city, advocacy groups, and media to promote the HCO focused on diet-related disease prevention, grocery shopping stress, children and community health, and food industry intentions. As such, we examined messages conveying similar rationales in the present experiment(22–Reference Jeff Cronin25).
Methods
Study sample
We worked with an online participant recruitment platform, Prime Panels, to recruit a one-time, online convenience sample of 5160 adult participants quota-matched to approximate distributions of key characteristics of the US population (5-year American Community Survey 2021 estimates)(26), including age, sex, race and ethnicity, and educational attainment. Prime Panels, operated by CloudResearch, pools opt-in market research panels to form a network of millions of survey participants with a diverse range of demographic characteristics(27,28) . Prime Panels sends out survey invitations to panelists based on their characteristics, and panelists can participate in numerous surveys if eligible. From Prime Panels’ aggregated participant database, participants were eligible for this study if they were ≥18 years of age and lived in the US. Prime Panels also pre-screened for English reading, making it an additional criterion. Lastly, having purchased food from restaurants at least once per month was an inclusion criterion because this study was added onto a parent study that assessed the effects of menu labels(Reference Lemmon, Gil and Musicus29). Institutional Review Board approval was obtained through the University of California, Davis (IRB approval number: 1641776). Data were collected in February–March 2024 and analysed in February–October 2025. The parent study was preregistered at ClinicalTrials.gov (NCT06204913)(Reference Lemmon, Gil and Musicus29), and this experiment was registered with Aspredicted.org (182172) after data collection for the parent study was completed but before data analysis began.
Design and procedures
This four-arm, parallel group randomised experiment was self-administered and conducted online via a Qualtrics questionnaire. Participants first provided electronic informed consent and responded to screener and parent–study questions. Then, participants were presented with the hypothetical healthy checkout policy according to their experimental condition: ‘Imagine your city is considering a policy that would set nutritional standards for foods displayed in the checkout lane of large food stores. The goal of the policy is…’ followed by one of four message frames: (1) ‘to expand healthy choices in the checkout lane, where the only options are typically candy, soda, and other junk food’, (2) ‘to make grocery shopping less stressful for parents by removing junk food from children’s eye level in the checkout lane’, (3) ‘to improve community and child health’, or (4) ‘to address predatory marketing from junk food companies that pay stores placement fees to promote candy and soda at checkouts’. Henceforth, frames will be referenced as expanding healthy choices, reducing parental stress by removing from child eye level, improving community and child health, and addressing predatory marketing. Participants were then asked a question to assess their support for the hypothetical healthy checkout policy, followed by socio-demographic questions. Participants were able to access the survey online from a location of their choosing using their own device (e.g. computer, tablet, cell phone). Monetary incentives, as stipulated in their agreement with their panel, were provided after completion of the ∼10–15-minute Qualtrics questionnaire.
Primary outcome
The primary outcome measure was support for a healthy checkout policy. Support was assessed by asking the following question: ‘Would you…?’ with response options on a 5-point Likert scale: 1 = strongly oppose, 2 = somewhat oppose, 3 = no opinion, 4 = somewhat support and 5 = strongly support. We then dichotomised the outcome representing whether participants supported the policy (somewhat support and strongly support) or not (strongly oppose, somewhat oppose, no opinion).
The survey measured socio-demographic characteristics including race and ethnicity, age, gender, annual household income, prediabetes or type 2 diabetes diagnosis, parental or caregiver status, educational attainment, and US geographical region(26). An attention-check was included, which asked, ‘What month is it currently?’ where the current month was the correct response. The full survey can be found in Appendix A.
Statistical analysis
We report frequencies and percentages for overall policy support and policy support by each message frame. We used bivariate Poisson regression models with robust standard errors, followed by pairwise comparisons, to determine whether the probability of supporting a healthy checkout policy significantly varied by message frame. Due to the exploratory nature of this study, and to reduce potential type 2 error, we did not adjust results with a multiple testing correction. We preregistered that we would examine policy support as a continuous variable (1–5); however, due to the skewed distribution of policy support (Supplemental Table 1), we examined it as a dichotomous outcome.
This study was prospectively powered for the parent study. However, a post hoc power analysis indicated that this study had ≥80 % power (two-sided alpha = 0·05) to detect a 6·0 percentage-point difference between message framing conditions. Though this study was not powered to assess effect measure modification, we planned a priori analyses to explore potential differences between message frame and policy support by socio-demographic variables (i.e. race and ethnicity, age, annual household income, prediabetes or type 2 diabetes diagnosis, parental or caregiver status, educational attainment, region), incorporating interaction terms to test for potential effect measure modification. We also examined whether overall support for a healthy checkout policy varied by these characteristics with both unadjusted and adjusted Poisson regression models with robust standard errors.
Statistical analysis was conducted using Stata/MP 18·0 (StataCorp, College Station, TX) with two-tailed tests and a critical alpha of 0·05.
Analytic sample
Out of the 5160 individuals who started the survey, we excluded 1055: seventeen who reported an age <18 years, 375 who did not purchase foods from restaurants at least once per month, 117 who did not complete the screening questions, and 546 who quit the survey before being randomised to a message frame. The remaining 4105 participants (80 % of the individuals who started the survey) were randomised to one of four message framing conditions. Of these 4105 participants, those who failed an attention check (n 69) or completed the entire survey implausibly fast (<33 % median completion time; n 58) were also excluded, as preregistered. Thus, the analytic sample for this study was 3978 participants (77 % of the 5160 who started the survey and 97 % of the 4105 randomised to a message frame). Adjusted analyses that included socio-demographic variables as covariates additionally excluded forty participants with missing socio-demographic data and two participants who reported living in US territories due to small cell size, resulting in a sample of 3936 for these analyses. A CONSORT diagram showing participant flow can be found in Figure 1.
CONSORT flowchart of participants from a national sample randomised to view messages for a healthy checkout policy. aReported purchasing food from restaurants <1 time per month: “In the past month, how often did you consume any food or beverage from a restaurant, including sit-down or fast-food restaurants and cafés?” bTime to complete the survey was <33% of the median completion time. cWe assessed participant attention with the question: “What month is it currently?” dAnalyses exclude forty participants with missing socio-demographic variables and two participants who reported living in US territories, who were excluded due to small cell size.

Results
Participants
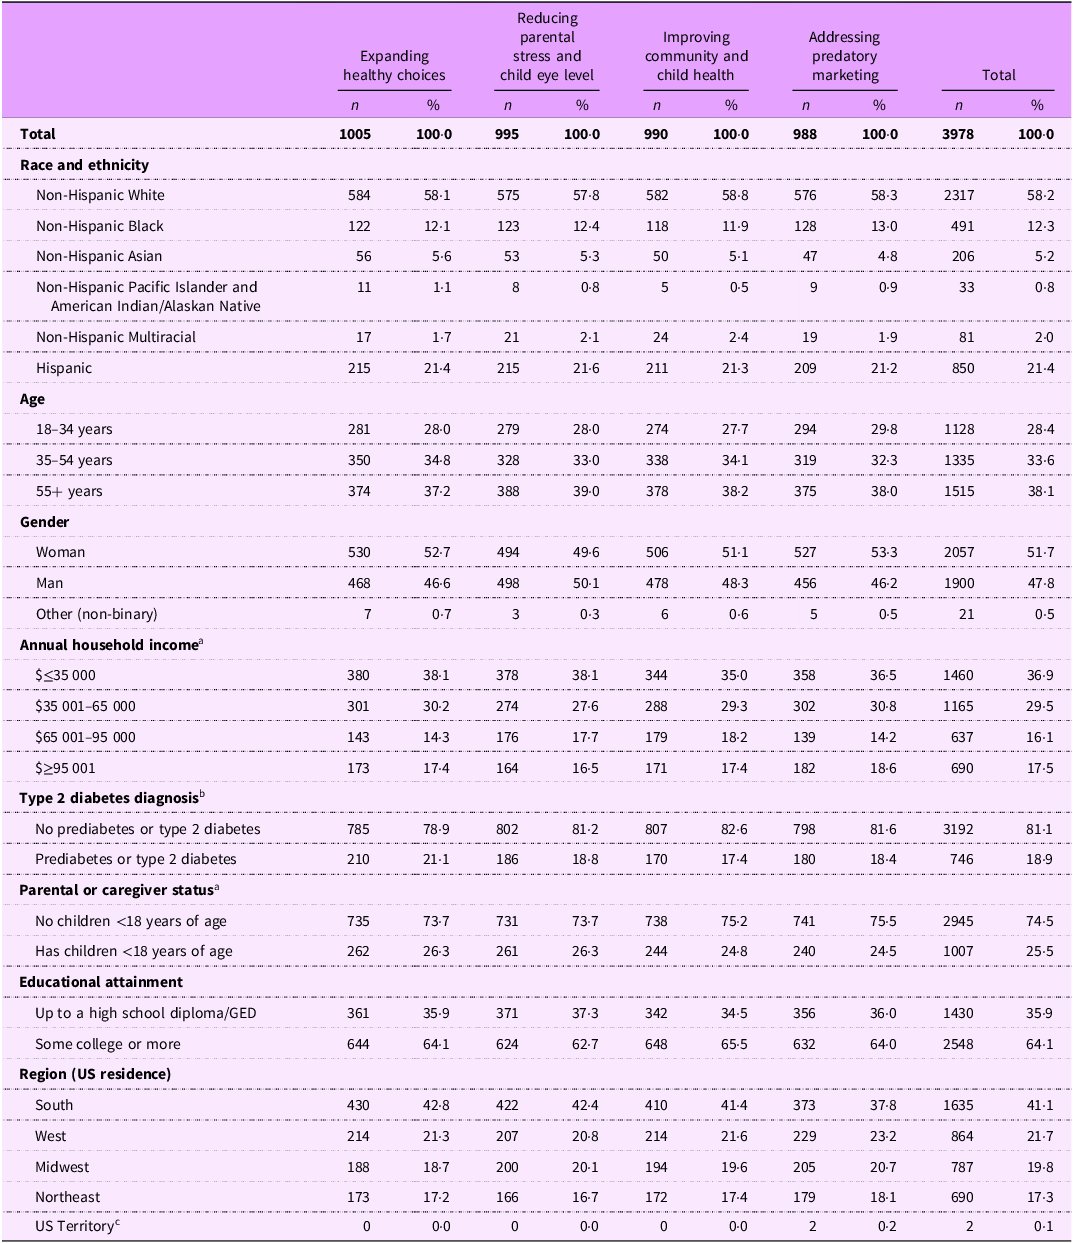
Approximately half of the sample (52 %) were women. Participants were similarly distributed across age categories (18–34 [28 %], 35–54 [34 %] and 55 and older [38 %]). Just over half (58 %) were non-Hispanic White; 21 % were Hispanic (any race); 12 % were non-Hispanic Black; 5 % were non-Hispanic Asian; 2 % were non-Hispanic Multiracial and 1 % were non-Hispanic Pacific Islander, Native Hawaiian, American Indian or Alaskan Native. Two-thirds (66 %) of participants reported their annual household income as below $65 000. Roughly two-thirds (64 %) completed at least some college education, and approximately one-quarter (26 %) of participants were parents or caregivers. Based on state of residence, participants most frequently lived in the South (41 %), followed by the West (22 %), Midwest (20 %), Northeast (17 %) and US territories (<1 %; Table 1).
Participant characteristics by condition in a randomised message framing experiment assessing support for a healthy checkout policy

Table 1. Long description
The table presents participant characteristics across four conditions in a message framing experiment. It has 12 rows and 13 columns, including headers. The columns are Expanding healthy choices, Reducing parental stress and child eye level, Improving community and child health, Addressing predatory marketing, and Total. Each column is divided into sub-columns for count (n) and percentage (%). The rows categorize participants by race and ethnicity, age, gender, annual household income, type 2 diabetes diagnosis, parental or caregiver status, educational attainment, and region of US residence. Each row provides counts and percentages for each condition and the total. For example, the row for Non-Hispanic white shows counts and percentages across the four conditions and the total. The table provides a detailed breakdown of participant demographics and characteristics.
a Twenty-six people completed the trial but did not complete all demographic questions, including parental status and income.
b Not a forced question, 1 % of participants did not provide a response.
c US territory participants (n 2) dropped before the analysis due to a small cell size.
Overall policy support
Overall, the most common response was somewhat support (33 %), followed by strongly support (32 %), then no opinion (23 %; Supplemental Table 1). After dichotomising this variable, most participants (65 %) supported, and roughly one-third (35 %) opposed or had no opinion about a healthy checkout policy.
Support by experimental condition
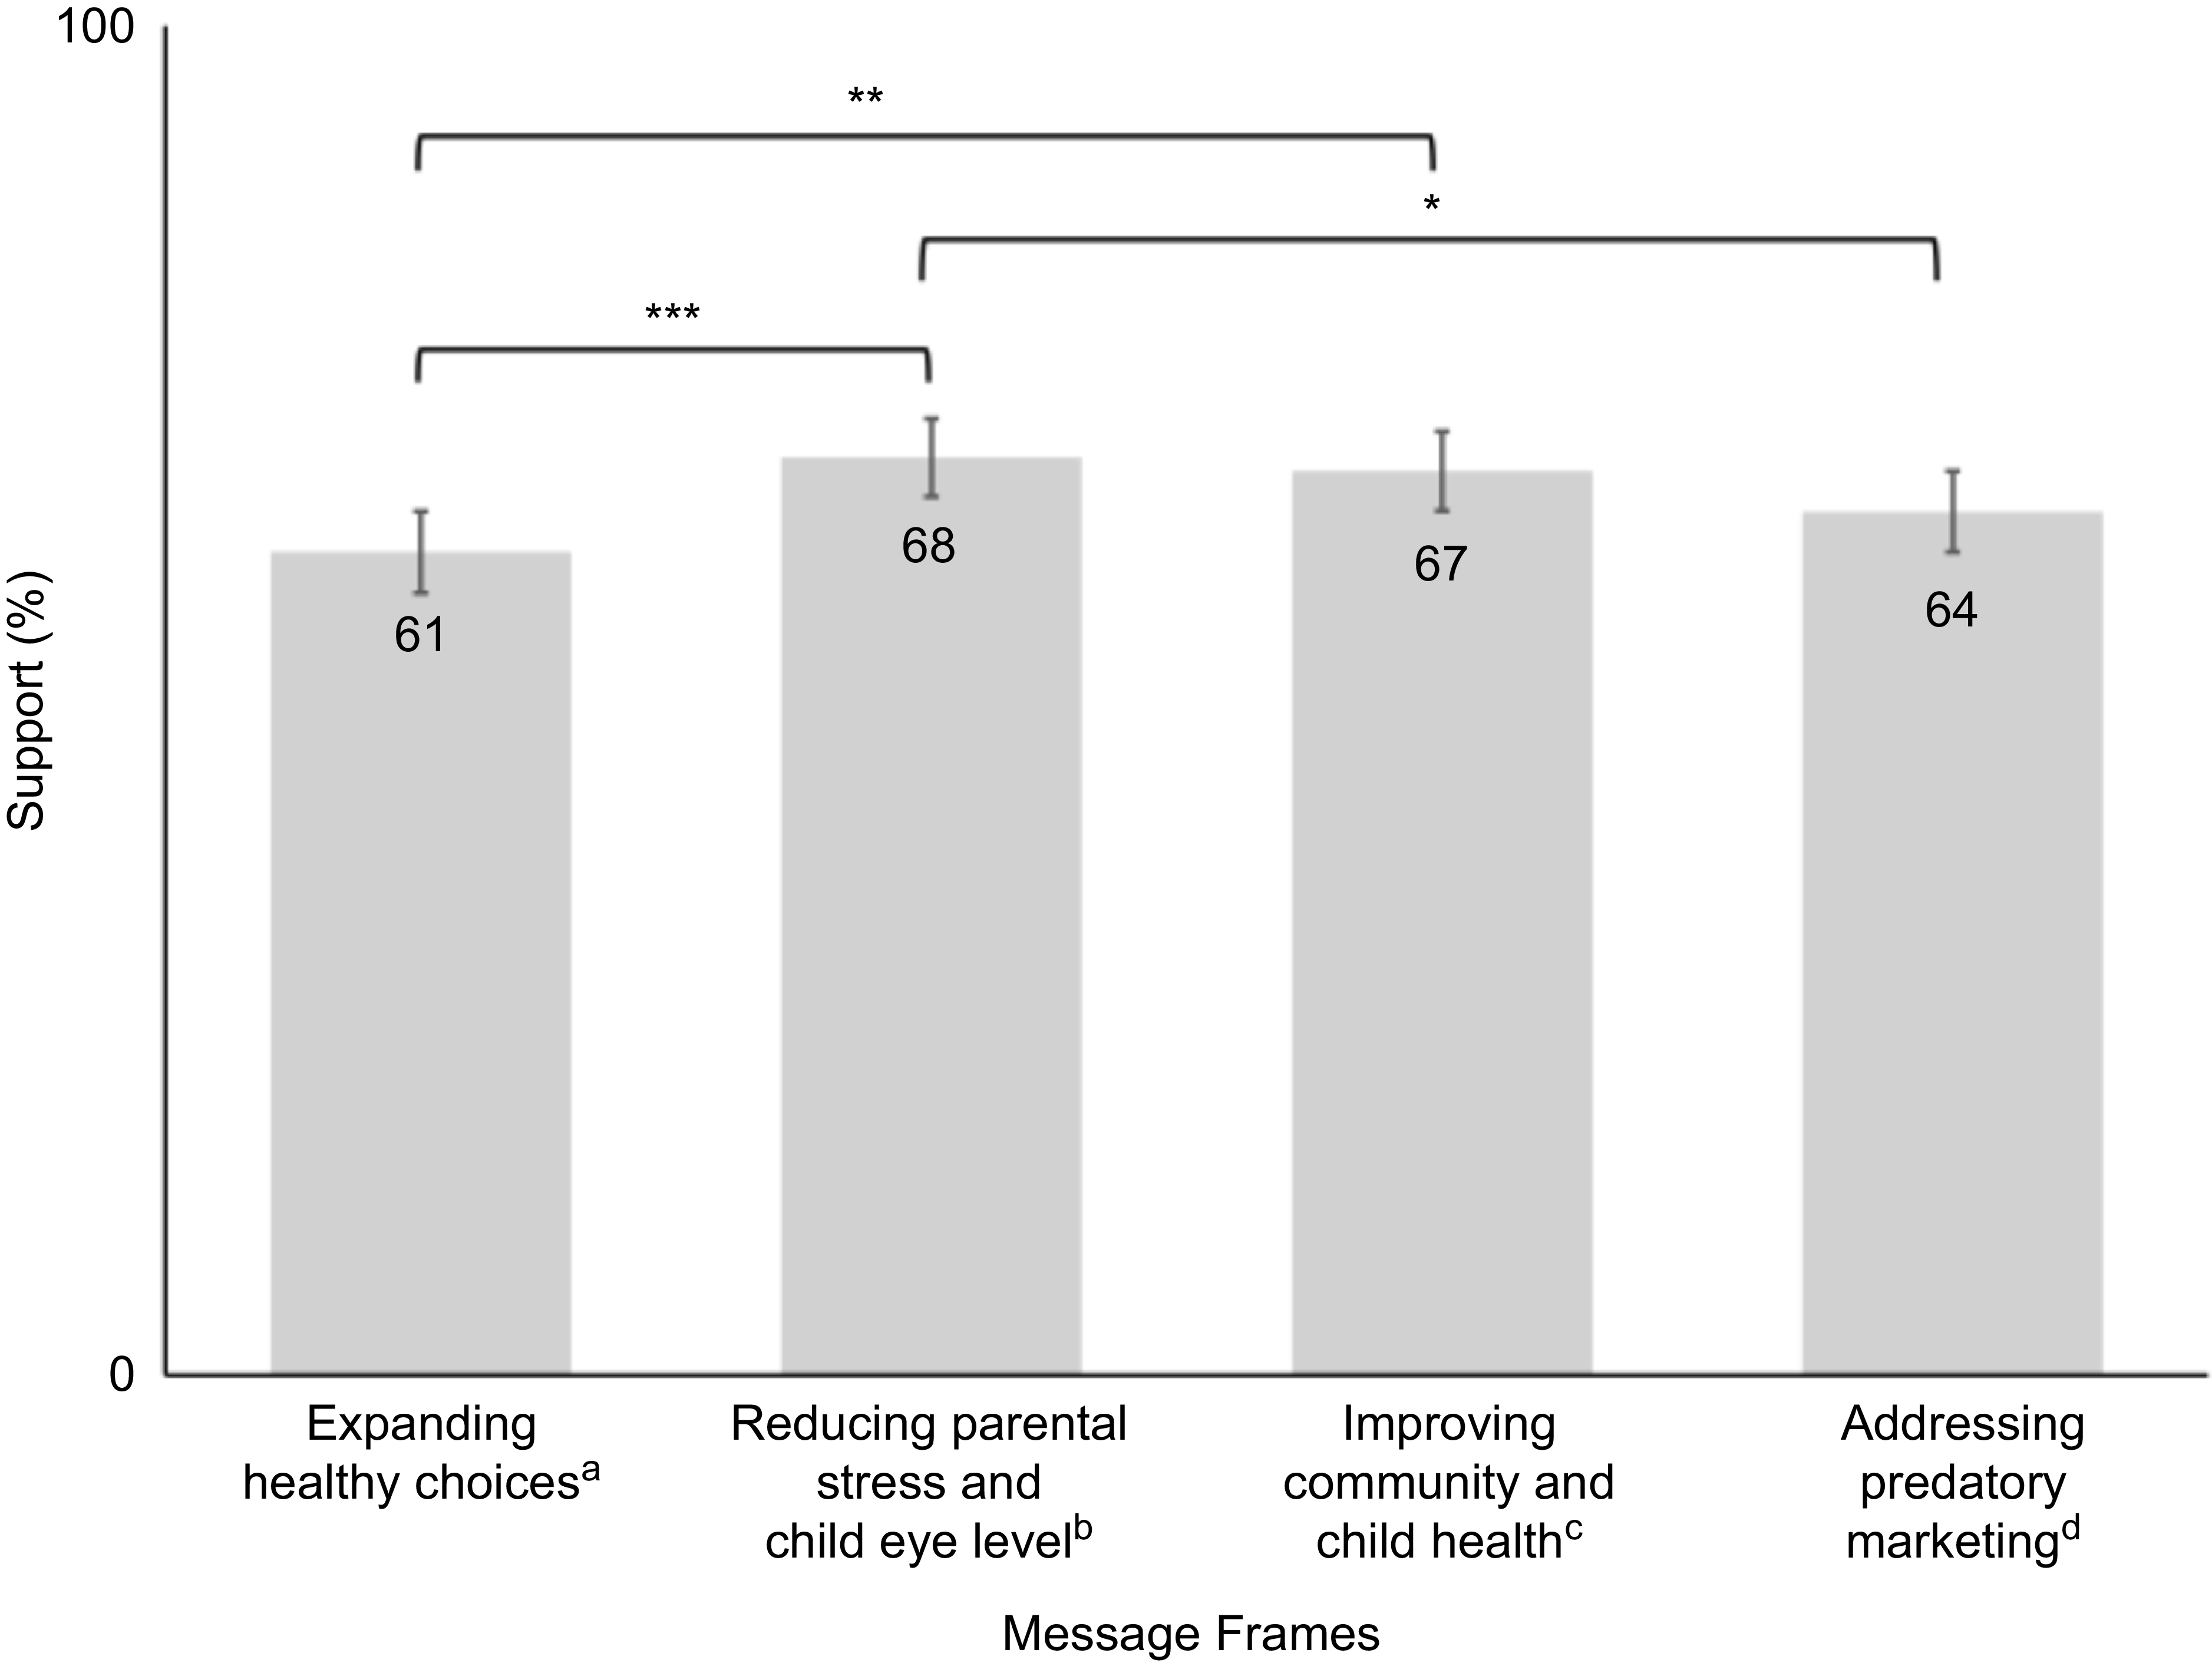
Support was highest for the frame reducing parental stress by removing from child eye level (68 %), followed by improving community and child health (67 %), addressing predatory marketing (64 %), and expanding healthy choices (61 %). Support was significantly higher for the reducing parental stress by removing from child eye level frame compared to the addressing predatory marketing frame (p = 0·03) and compared with the expanding healthy choices frame (p < 0·001; Figure 2). Support was also significantly higher when the policy was framed as improving community and child health than when framed as expanding healthy choices (p = 0·01; Figure 2). There were no significant differences in policy support between the reducing parental stress by removing from child eye level and improving community and child health frames nor was there a difference between the improving community and child health frame and the addressing predatory marketing frame (all p > 0·05).
Participant support for a healthy checkout policy after randomisation to one of four message frames. aTo expand healthy choices in the checkout lane, where the only options are typically candy, soda, and other junk food. bTo make grocery shopping less stressful for parents by removing junk food from children’s eye level in the checkout lane. cTo improve community and child health. dTo address predatory marketing from junk food companies that pay store placement fees to promote candy and soda at checkouts. *p < 0.05 vs. reference group, **p < 0.01 vs. reference group, ***p < 0.001 vs. reference group. Note: Participants were randomised to one of four message frames. Bivariate Poisson regression models with robust standard errors and pairwise comparisons without adjustment for multiple testing were used to determine whether the probability of supporting a healthy checkout policy significantly varied by message frame. Brackets indicate significant differences.

Effect measure modification
We explored effect measure modification for socio-demographic variables including race and ethnicity, age, annual household income, prediabetes or type 2 diabetes status, parental or caregiver status, educational attainment, and region of residence. Analyses found that the relative advantages of the reducing parental stress by removing from child eye level frame v. the expanding healthy choices frame (PR = 0·73; 95 % CI: [0·54, 0·99]; p-for-interaction = 0·04) and the improving community and child health frame (PR = 0·71; 95 % CI: [0·53, 0·94]; p-for-interaction = 0·02) were significantly attenuated among non-Hispanic Asian adults relative to non-Hispanic White adults.
We also found that the advantage of the addressing predatory marketing frame relative to the reducing parental stress by removing from child eye level frame was more pronounced among those who reported $65 001–95 000 in annual household income than those who reported $≤35 000 (PR = 1·28; 95 % CI: [1·06, 1·54]; p-for-interaction =0·01). Additionally, we found that the addressing predatory marketing frame relative to the improving community and child health frame was more effective among those who resided in the Northeast US than those in the South (PR = 1·19; 95 % CI: [1·00, 1·42]; p-for-interaction = 0·05). For age, prediabetes or type 2 diabetes status, parental or caregiver status, and educational attainment, there was no significant effect measure modification (all p-for-interaction > 0·05).
Overall support by socio-demographic characteristics
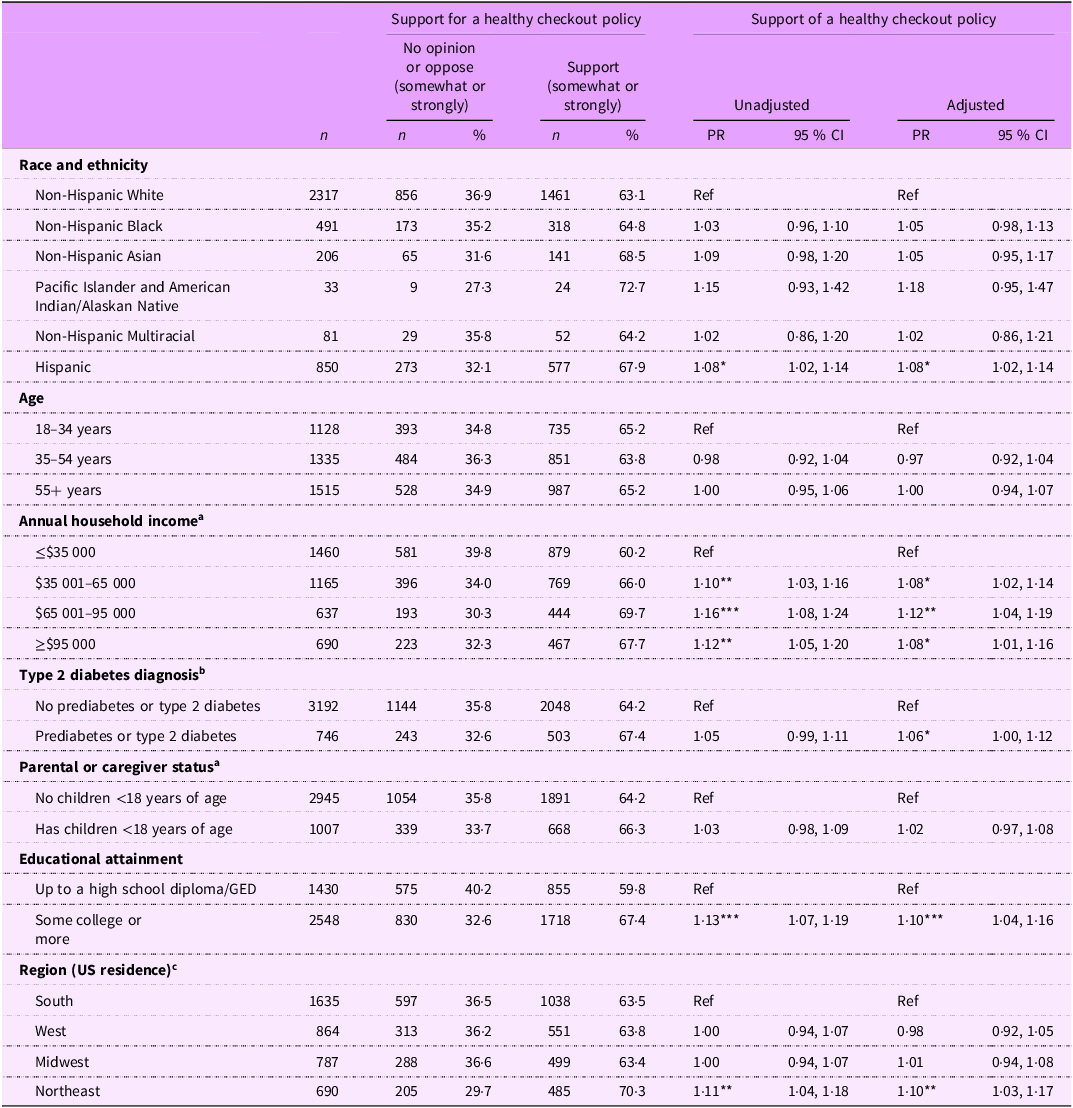
We also explored the relationships between participant socio-demographic characteristics and overall policy support for a healthy checkout policy (i.e. regardless of message frame). Results from the adjusted model (i.e. a multivariate model adjusting for socio-demographic characteristics) were similar to results from unadjusted models (i.e. bivariate models) and are reported in Table 2; here, we discuss the results of the adjusted model. Compared to policy support among participants who made $≤35 000 (60 % support), support was significantly higher among participants with higher levels of annual household income over $35 000 (66–70 % support; PR: 1·08–1·12; all p < 0·03). Compared to those with up to a high school diploma or GED (60 % support), support was significantly higher among participants with at least some college education (67 % support; PR = 1·10; 95 % CI: [1·04, 1·16]; p < 0·001), for those who reported having a prediabetes or type 2 diabetes diagnosis compared with those who did not (67 % v. 64 % support; PR = 1·06; 95% CI: [1·00, 1·12]; p = 0·049) and for those who resided in the Northeast region of the US compared to participants in the South (70 % v. 64 % support; PR = 1·10; 95 % CI: [1·03, 1·17]; p = 0·002). Support, regardless of frame, did not significantly differ by age or parental or caregiver status (all p > 0·05).
Support for a healthy checkout policy by socio-demographic variables (N 3976)

Table 2. Long description
A table with 11 rows and 10 columns comparing support for a healthy checkout policy across different socio-demographic variables. The columns are labeled as follows: n, No opinion or oppose (somewhat or strongly) n, No opinion or oppose (somewhat or strongly) %, Support (somewhat or strongly) n, Support (somewhat or strongly) %, Unadjusted PR, Unadjusted 95 % CI, Adjusted PR, Adjusted 95 % CI. The rows are labeled as follows: Race and ethnicity, Age, Annual household income, Type 2 diabetes diagnosis, Parental or caregiver status, Educational attainment, Region (US residence). Each row provides data on the number of participants, the percentage of participants with no opinion or opposing the policy, and the percentage of participants supporting the policy, both unadjusted and adjusted. Notable trends include higher support among participants with higher annual household income, those with some college education or more, those with a prediabetes or type 2 diabetes diagnosis, and those residing in the Northeast region of the US.
a Excludes twenty-six participants who did not provide a response.
b Not a forced question, 1 % of participants did not provide a response.
c Excludes two participants who reported living in a US territory due to a small cell size.
*p < 0·05 v. reference group, **p < 0·01 v. reference group and ***p < 0·001 v. reference group.
Note: We ran models to examine whether socio-demographic variables were associated with support for a healthy checkout policy. For all analyses, we used Poisson models with robust standard errors. We explored pairwise comparisons; no corrections for multiple testing were applied. Pairwise comparisons indicate that there were no other significant differences in support by socio-demographic characteristics.
Discussion
Discussion and implications
This study found that, overall, nearly two-thirds (65 %) of participants supported a healthy checkout policy. Policy support was high for each message frame (61–68 %), with some differences between them. When the healthy checkout policy was framed as reducing parental stress by removing from child eye level, the policy received more support than when it was framed as expanding healthy choices in the checkout lane, or as addressing predatory marketing. Furthermore, the hypothetical healthy checkout policy received more support when framed as improving child and community health than when framed as expanding healthy choices. To our knowledge, this is the first study to identify which message frames result in higher support for a healthy checkout policy.
The healthy checkout policy garnered the most support (68 %) when framed as making shopping less stressful for parents by removing junk food from children’s eye level. This message frame may have garnered the most support because it had multiple components (i.e. making shopping less stressful and removing junk food from child eye level). Participants could have understood the frame only as it relates to children’s exposure to unhealthy foods; others may have read the message as preventing children’s persistent requests for junk foods, thus, decreasing parental stress. Some may have also recognised both benefits. This is consistent with existing research on policy framing, which indicates that communicating multiple policy benefits leads to higher levels of policy support(Reference Mantzari, Reynolds and Jebb30).
The message frames eliciting the first and second most policy support (reducing parental stress by removing from child eye level and improving community and child health) revolved around child health. Our results are consistent with previous literature suggesting that adults are more inclined to accept government interventions when they are framed around the health of children and young people(Reference Diepeveen, Ling and Suhrcke31,Reference Hardus, van Vuuren and Crawford32) . Framing around benefits for children has been used for existing food policies, such as Chile’s National Law of Food Labeling and Advertising in 2016, which mandates front-of-package warning labels and restricts food marketing to children(Reference Taillie, Reyes and Colchero33). These results also align with the Social Construction of Target Populations Theory, which suggests that ‘positively constructed’ or favorably perceived groups, like children, are more likely to garner public and political support for policy intervention(Reference Schneider and Ingram34).
In this experiment, when the healthy checkout policy was framed as addressing predatory marketing from junk food companies that pay stores placement fees to promote candy and soda at checkouts, it did not yield significantly more policy support than the other frames. This may be because the wording, ‘predatory marketing’, of this frame was unfamiliar to consumers. In past public health efforts to halt tobacco consumption, similar ‘countermarketing’ message frames that aimed to expose the motives of the tobacco industry have been effective at reducing the purchase of such products in the US(Reference Palmedo, Dorfman and Garza35–Reference Dorfman37). Furthermore, recent nutrition research suggests that ‘countermarketing’ increases public support for diet-related policy interventions and remains worth pursuing(Reference Grummon, Zeitlin and Lee38). Thus, future research using alternative wording of the addressing predatory marketing frame should be conducted.
Lastly, the policy framing that elicited the least (though still majority) support was expanding healthy choices, where the only options are typically candy, soda and other junk food. This framing, similar to framings used in research conducted in other food retail settings(Reference Reimold, Hall and Ng19), may have been too vague to elicit higher support, especially because the frame was not tied to any specific social or community values. In addition, while some individuals may prioritise their health, ‘healthy’ eating is subjective and may vary in importance and definition across different communities(Reference John, Johnson and Nelms39).
Regarding effect measure modification, we found only limited evidence that message frame performance varied by the socio-demographic characteristics examined. For example, the addressing predatory marketing frame performed relatively better among those with an annual household income of $65 001–95 000 and those residing in the Northeast, but differences were moderate. Successful campaigns may benefit from using multiple message frames to appeal to different groups. However, for age, prediabetes or type 2 diabetes status, parental or caregiver status, and educational attainment, there were no significant differences in message frame performance.
In contrast, overall policy support for a healthy checkout policy, regardless of frame, varied by socio-demographic characteristics. Compared to non-Hispanic adults, Hispanic adults of any race had higher support for a healthy checkout policy, regardless of message frame. Though we did not collect data on country of origin, it is possible that Hispanic participants in our study may have had knowledge of or experience with other countries in Latin America, such as Chile and Mexico, that have implemented policies in the last decade to regulate food marketing and food environments for diet-related disease prevention(40,41) . This study also found that those who made $≥35 000 or had at least some college education were significantly more likely to support a healthy checkout policy. This aligns with prior research that has found that higher socio-economic status (i.e. income and education) is associated with higher political engagement, government trust, and policy support(Reference Albareda and Müller42). Moreover, participants with prediabetes or type 2 diabetes were modestly (3 percentage points) more inclined to support a healthy checkout policy. Communities with high risk of or existing type 2 diabetes are regular targets of public health outreach and intervention(Reference Gruss, Nhim and Gregg43,Reference Ely, Gruss and Luman44) ; therefore, individuals with regular health engagement may especially recognise the potential benefits of a healthy checkout policy and desire environmental support in managing their condition. Finally, adults residing in the Northeast were also more likely to support a healthy checkout policy, which is consistent with prior research showing greater food policy activity (e.g. Philadelphia Beverage Tax, Philadelphia Sodium Warning Law, New York Sweet Truth Act) in this region of the US(Reference Davis, Goon and Gouck45). Thus, adults in the Northeast may be more willing to support a healthy checkout policy, as policies proposing to improve the food environment have already been implemented.
Future directions
This was the first study, to our knowledge, to examine message framing and support for a healthy checkout policy. Future research should test additional message frames and alternative frame wording, including positive, neutral and negative message frames. Because each community is different, frames should also be tested in and adapted for local contexts. Our preliminary research, along with the existing literature, suggests that discussing child health and stating multiple benefits may lead to increased policy support. This work was exploratory, and future work should test message frames against a control condition and power for effect measure modification analyses.
In addition to there being majority support for a healthy checkout policy, about one-quarter of participants (23 %) indicated they had ‘no opinion’ regarding this policy. This finding suggests that there is a sizeable group of individuals whose opinions could potentially be shifted in either direction through further engagement. Furthermore, opponents, such as industry trade associations, have used negative framings (e.g. government infringement on consumer choice) that may affect levels of public endorsement for healthy checkout and other public health policies(Reference Dorfman, Wallack and Woodruff46,Reference James47) . More specific frames that have not been tested for support for a healthy checkout policy include messages about the lowering diet-related disease risk and introducing healthy habits to children(Reference Scheider24). Future research should examine the effects of specific framings and anti-healthy checkout frames used by the industry to identify effective counterarguments.
Strengths and limitations
As healthy checkout policies gain momentum, this study is timely for providing insights into policy perceptions among the general public. Although we were limited in using a convenience instead of a probability sample, we recruited a large sample matched to US distributions of key socio-demographic characteristics, which may improve the generalisability of our findings. Additionally, we did not correct for multiple testing given the exploratory nature of this study; future studies should confirm whether modest differences observed herein (e.g. differences in support by type 2 diabetes status) replicate. There may also be potential differences between online and real-world participant samples. Nonetheless, online studies have demonstrated internally valid results(Reference Weinberg, Freese and McElhattan48,Reference Jeong, Zhang and Morgan49) .
Conclusion
Prior research has compared different ways of framing health-related messages on attitudes, intentions, and behaviour(Reference Gallagher and Updegraff50); however, this was the first study to our knowledge to examine the most persuasive ways to frame a healthy checkout policy. In an online experiment, support for a healthy checkout policy was high, regardless of how the policy was framed. The best-performing frame was reducing parental stress by removing from child eye level, followed by improving community and child health. As more jurisdictions consider implementing checkout policies, it is important to understand how to communicate these policies to the general public.
Supplementary material
For supplementary material accompanying this paper, visit https://doi.org/10.1017/S1368980026103723
Acknowledgements
None.
Author contributions
A.M.G.: Conceptualisation, Data curation, Formal analysis, Funding acquisition, Investigation, Methodology, Project administration, Visualisation, Writing – original draft, Writing – review and editing. A.E.R.: Data curation, Formal analysis, Supervision, Validation, Visualisation, Writing – review and editing. B.L.: Data curation, Formal analysis, Investigation, Methodology, Project administration, Writing – review and editing. E.W.: Investigation, Methodology, Project administration, Writing – review & editing. L.D.: Conceptualisation, Methodology, Writing – review & editing. S.D.B.: Methodology, Writing – review & editing. L.A.: Methodology, Writing – review & editing. J.F.: Conceptualisation, Formal analysis, Funding acquisition, Investigation, Methodology, Project administration, Resources, Supervision, Validation, Visualisation, Writing – review and editing.
Financial support
This study was supported by grants from the National Institutes of Health (J.F., grant number R01DK135099) and (S.D.B., grant numbers 5K26DK138246, 5P30DK092924). The questions used in this survey were added to a study supported by the American Diabetes Association (J.F., grant number 11-22-ICTSN-07) and approved by the Institutional Review Board at UC Davis. An author’s time was also supported by a USDA National Institute of Food and Agriculture Hatch project (J.F., grant number 7005204). The content is solely the responsibility of the authors and does not necessarily represent the official views of the NIH, ADA, or USDA. No other financial disclosures were reported by the authors of this paper.
Competing interests
None.
Ethical standards
This study was conducted according to the guidelines laid down in the Declaration of Helsinki, and all procedures involving research study participants were approved by the UC Davis Institutional Review Board. Written informed consent was obtained from all subjects.



 Open access

