Introduction
The nutritional status of the ruminant animal plays a role in modulating aspects of fertility. Ovarian activity is under the control of gonadotrophins secreted by the pituitary gland while metabolites, such as glucose and non-esterified fatty acids, and hormones, such as insulin and leptin, may modulate gonadotrophin secretion (Robinson, Reference Robinson1990; Armstrong et al., Reference Armstrong, Gong and Webb2003; Webb et al., Reference Webb, Garnsworthy, Gong and Armstrong2004). However, there is increasing evidence that nutrition may have a direct effect on the developing follicle-enclosed oocyte through changes in metabolite and/or hormone concentrations (Chagas et al., Reference Chagas, Bass, Blache, Burke, Kay, Lindsay, Lucy, Martin, Meier, Rhodes, Roche, Thatcher and Webb2007). Plane of nutrition has been shown to affect the developmental competence of oocytes and this effect is dependent on the fatness of the donor animal. Adamiak et al. (Reference Adamiak, Mackie, Watt, Webb and Sinclair2005) showed that blastocyst yields were increased when lean heifers were fed at twice maintenance rather than at maintenance energy requirements, but the opposite was true for heifers in moderate body condition.
Diet composition has also been shown to influence the developmental competence of oocytes. For example, diets with high concentrations of rumen-degradable protein are associated with increased ammonia concentrations in follicular fluid and reduced oocyte development (McEvoy et al., Reference McEvoy, Robinson, Aitken, Findlay and Robertson1997; Sinclair et al., Reference Sinclair, Kuran, Gebbie, Webb and McEvoy2000). The type of forage and inclusion of concentrate in the diet have also been shown to influence oocyte quality (Yaakub et al., Reference Yaakub, O’Callaghan and Boland1999). Adamiak et al. (Reference Adamiak, Powell, Rooke, Webb and Sinclair2006) showed that increased dietary starch concentration was associated with both increased plasma insulin concentrations and changes in oocyte quality, which were again dependent on the fatness of the donor heifer. In both the Adamiak et al. (Reference Adamiak, Mackie, Watt, Webb and Sinclair2005 and Reference Adamiak, Powell, Rooke, Webb and Sinclair2006) studies, diets were fed as two meals per day and dietary treatments altered basal plasma insulin concentrations. It is likely that these dietary treatments would have also altered post-prandial peaks in plasma insulin concentration, as a result of rapid increases in production of propionic acid in the rumen. It is not known, therefore, whether changes in oocyte quality associated with changes in plasma insulin concentration were mediated by changes in mean basal insulin concentration or by post-prandial fluctuations in insulin concentration.
The aim of the current experiment was, therefore, to differentiate between the above two possibilities by feeding fibre- or starch-based diets to change mean basal insulin concentrations as in previous experiments (e.g. Adamiak et al., Reference Adamiak, Powell, Rooke, Webb and Sinclair2006), but additionally as either two or four equal meals daily to modify post-prandial fluctuations in insulin concentration. A secondary aim was to investigate the effect of changes in glucagon concentration on oocyte quality as glucagon concentration is known to respond to feeding (Bassett, Reference Bassett1975) and to be dependent on diet composition (Thorp et al., Reference Thorp, Wylie, Steen, Shaw and McEvoy2000). Heifers of low body fatness (body condition score (BCS) <2.5) were used because such animals (Adamiak et al., Reference Adamiak, Mackie, Watt, Webb and Sinclair2005 and Reference Adamiak, Powell, Rooke, Webb and Sinclair2006) were more responsive to nutrition than those of greater fatness (BCS > 3.0).
Material and methods
The experiment described in this paper was reviewed by the Animals Experiments Committee of the Scottish Agricultural College and was conducted under the auspices of, and in accordance with, the requirements of the Animals (Scientific Procedures) Act 1986.
Animals, dietary treatments and experimental design
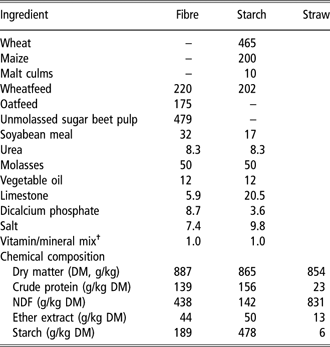
Twenty-four Holstein heifers, approximately 20 months in age, were used. All animals were accommodated in individual pens with sawdust bedding during experimental procedures. Live weight and BCS (six-point scale where 0 = lean and 5 = obese) were determined at the start of the experiment. Heifers were separated into two blocks of 12 animals that underwent experimental procedures in succession because of space limitations. To ensure similar mean live-weights and BCS across experimental treatments, within each block, heifers were divided into three sub-groups of four on the basis of weight and BCS and within each sub-group randomly allocated to one of the four experimental treatments. The four experimental treatments were two diets formulated to have either a high-fibre or high-starch content, which were fed in either two (2×) or four (4×) meals per day. This resulted in a 2 × 2 factorial arrangement of four treatments, which consisted of six heifers per treatment (three per treatment per block). Formulations and chemical composition of the diets are in Table 1. Daily feed allowances were adjusted to ensure that each animal received 1 MJ metabolisable energy/kg live weight0.75 per day, equivalent to approximately twice the maintenance energy requirements for this type of animal (Agricultural and Food Research Council, 1993). This feeding level included an allowance of straw (Table 1), which was fixed at 2 kg fresh material daily. The fibre or starch feed allocation was offered to each heifer daily in either two equal meals at 0800 and 1600 h or four equal meals at 0600, 1200, 1800 and 2400 h. Straw was offered in two equal meals to the 2× treatments at 0800 and 1600 h and to the 4× treatments at 0600 and 1800 h. Animals were weighed every 2 weeks and feeding levels adjusted if necessary. The experimental diets were introduced gradually such that animals received the entire allocation from 1 week prior to the start of oestrous synchronisation (25 days prior to the first session of ultrasound-guided transvaginal follicular aspiration (ovum pick-up, OPU; see Figure 1)).
Ingredients (kg/tonne) and proximate analysis of experimental diets
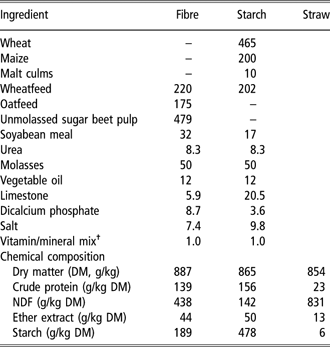
†Vitamin/mineral mix supplied/kg feed: Cu, 25 mg; Mn, 100 mg; Zn, 60 mg; Co, 1.5 mg; I, 6.0 mg; Se, 0.2 mg; vitamin A, 8000 IU; vitamin D3, 2500 IU; vitamin E, 30 IU.
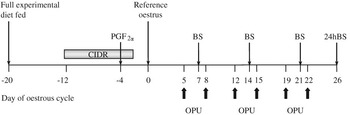
Schematic representation of oestrous synchronisation, OPU sessions and blood sampling. BS represents weekly (single) blood samples and 24 h BS when multiple blood samples taken over a 24-h period.

Synchronisation of oestrus, oocyte recovery and follicular growth
The experimental procedures are summarised in Figure 1. Oestrus was synchronised using a 10-day progesterone-releasing device (CIDR; SmithKline Beecham, Tadworth, Surrey, UK) containing 1.9 g of progesterone. A prostaglandin F2α analogue (Luprostiol 15 mg; Prosolvin, Intervet, Cambridge, UK) was administered intramuscularly 8 days after CIDR insertion. Within each group of 12 heifers, CIDRs were inserted into sub-groups of six animals, 1 day apart, to facilitate experimental management. Animals were subjected to OPU beginning 7 days after CIDR removal. Each heifer underwent six sessions of OPU (twice weekly for 3 weeks with 3 days between each session). The time of day of the OPU session in relation to feeding was varied for each animal to avoid any bias. Full details of OPU are given in Sinclair et al. (Reference Sinclair, Kuran, Gebbie, Webb and McEvoy2000) and Adamiak et al. (Reference Adamiak, Mackie, Watt, Webb and Sinclair2005 and Reference Adamiak, Powell, Rooke, Webb and Sinclair2006).
Blood sampling
Blood samples were collected once weekly during OPU. Samples were taken prior to the 0800 h meal (2× treatment) or 1200 h meal (4× treatment) by jugular venipuncture into each of the following tubes: heparin-treated (for analysis for insulin, leptin and urea), EDTA/sodium fluoride-treated (glucose) and EDTA/aprotinin-treated (glucagon, IGF-1). Plasma was harvested from these samples by centrifugation at 3000 × g for 15 min at 4°C and stored at −20°C until analysis. Four days after completion of OPU, blood samples were collected for assessment of diurnal changes in blood metabolite and hormone concentrations (six heifers per day). Different sampling regimes for the twice and four times daily fed heifers were adopted (a) to determine changes in hormone concentration in relation to feeding (−0.5, +1, +2 and +3 h in relation to feeding) and (b) to permit accurate timing of sample collection. Twice daily fed heifers were therefore sampled at 0730, 0900, 1000, 1100, 1200, 1400, 1530, 1700, 1800, 1900, 2000, 2200, 2330, 0130 and 0530 h and four times daily fed heifers at 0530, 0700, 0800, 0900, 1130, 1300, 1400, 1500, 1730, 1900, 2000, 2100, 2330, 0100, 0200, 0300 and 0530 h.
In vitro embryo production
Oocytes obtained from each heifer were processed separately and therefore individual animal identity was maintained throughout all in vitro procedures. Full details of in vitro embryo production methodologies are given in Adamiak et al. (Reference Adamiak, Mackie, Watt, Webb and Sinclair2005 and Reference Adamiak, Powell, Rooke, Webb and Sinclair2006). Cumulus-oocyte complexes (COCs) were graded according to the number of compact cumulus cell layers and granulation of the oocyte cytoplasm; denuded oocytes were rejected. After in vitro maturation and fertilisation, putative zygotes were cultured in groups of up to 20 zygotes in 30 μl drops of synthetic oviductal fluid medium supplemented with 3 g/l fatty acid-free BSA, 1% v/v non-essential amino acids and 2% v/v essential amino acids in a humidified atmosphere of 5% CO2, 5% O2 and 90% N2 at 38.8°C; droplets were renewed every 48 h. On day 2 of development (day 0 = in vitro fertilisation), cleavage rate was recorded and cleaved zygotes were then cultured in 30 μl drops until day 8. Blastocyst yield and developmental stage were recorded on day 8. Blastocysts were fixed in ethanol : acetic acid (3 : 1, v : v) for at least 12 h prior to staining with bisbenzimide stain (Hoechst 33342, 10 μg/ml in sodium citrate 23 g/l). Cell numbers were counted using a fluorescence microscope (excitation, 350 nm; absorbance, 450 nm).
Hormone analysis
Insulin concentrations were determined using an 125I-labelled insulin double-antibody radioimmunoassay (RIA) (Starr et al., Reference Starr, Horwitz, Rubenstein and Mako1979). The assay was modified to use porcine insulin (I-3505, Sigma Chemical Co. Ltd, Dorset, UK) and guinea pig anti-porcine insulin, normal guinea pig serum, and sheep anti-guinea pig IgG obtained as a gift from the Scottish Antibody Production Unit, Law Hospital, Carluke, Lanarkshire, Scotland. The [125I] porcine insulin solution was prepared using the chloramine T method. The minimum detection limit of the assay was 0.11 ng/ml. The inter-assay coefficients of variation for low (0.30 ng/ml), medium (0.42 ng/ml) and high controls (0.79 ng/ml) were 10.7%, 12.6% and 7.8%, respectively, and the corresponding intra-assay coefficients of variation were 10.6%, 12.6% and 7.9%.
Plasma IGF-I concentrations were determined using an [125I] IGF-I double-antibody RIA (Armstrong et al., Reference Armstrong, Duclos and Goddard1990) in which IGF-I was first separated from its binding proteins by HPLC in acid conditions (Owens et al., Reference Owens, Johnson, Campbell and Ballard1990). The RIA used recombinant human IGF-I, anti-human IGF-I polyclonal antiserum (rabbit) both obtained from GroPep Ltd (Adelaide, Australia) and normal rabbit serum and donkey anti-rabbit IgG obtained from Diagnostics Scotland (Law Hospital, Carluke, Scotland). The [125I] IGF-I solution was prepared using the chloramine T method. All samples analysed for IGF-I concentrations were processed in a single assay with a detection limit of 12.5 ng/ml and where the coefficients of variation for low (31 ng/ml) and high (336 ng/ml) quality controls were 15.7% and 12.2%, respectively.
Plasma leptin concentrations were determined using the method of Blache et al. (Reference Blache, Tellam, Chagas, Blackberry, Vercoe and Martin2000). The primary antibody, normal emu serum and sheep anti-emu serum were both provided by Dr Blache, University of Western Australia. Ovine leptin (supplied by Dr Keisler, University of Missouri, MO, USA) was iodinated in-house as described above. The detection limit for leptin concentration was 0.48 ng/ml and the mean intra- and inter-assay coefficients of variation (based on low (2.2 ng/ml), moderate (3.5 ng/ml) and high (7.0 ng/ml) quality controls) were 7.5% and 13.1%, respectively.
Plasma glucagon was measured using a Glucagon RIA kit (GL-32K, Linco Research Inc., MO, USA; Morgan and Lazerow, Reference Morgan and Lazerow1963; Bradford et al., Reference Bradford, Gour, Nash and Allen2006). The detection limit for glucagon concentration was 20 ng/ml and the inter-assay coefficients of variation for low (67 pg/ml) and high (141 pg/ml) controls were 12.6% and 4.5%, respectively. Corresponding intra-assay coefficients of variation were 12.1% and 4.6%, respectively.
Metabolite analyses
Concentrations of plasma glucose and urea were determined using commercial kits by automated enzymatic methods on a Hitachi 705 auto-analyser. Acetate and propionate were extracted from plasma (1 ml) with propan-2-ol (5 ml) containing internal standard (2-ethyl-n-butyric acid, 18.4 mg/l). After centrifugation for 15 min at 3000 × g at 4°C, the supernatant was added to 0.2 ml 0.2M NaOH and evaporated to dryness at 40°C. The residue was dissolved in 0.5 ml orthophosphoric acid (65 ml/l water) prior to analysis by HPLC. Acetate and propionate were separated using a Supelcogel C-610H column (300 × 7.7 mm; Supelco, Bellefonte, PA, USA) and quantified using a refractive index detector. Elution was with 5 mM sulphuric acid at 0.5 ml/min and 48°C. Concentrations of acetate and propionate were quantified with reference to the internal standard.
Data analyses
Changes in plasma hormone and metabolite concentrations were analysed by ANOVA within GenStat 6 (Genstat, 2002). For weekly samples, a repeated measures ANOVA was carried out where factors were block (group of heifers), carbohydrate source (fibre or starch) and frequency of feeding (2× or 4×), sample week and interactions between these factors. Data relating to blood samples obtained before (−0.5 h) and after feeding (+1, +2 and +3 h) were also analysed using a repeated measures ANOVA as above where sampling time replaced sample week. Where significant interactions were detected, differences between means were identified using Least Significant Differences. Oocyte recovery and in vitro embryo production data (i.e. oocytes cleaved and blastocyst yields) were analysed using generalised linear models assuming binomial errors with logit link functions within the above statistical package. Terms fitted to the model were animal, group, carbohydrate source and frequency of feeding. Comparisons between means were conducted by Wald tests. Data are presented as geometric means.
Results
There was no difference (P > 0.05) between treatments in live weight or BCS either at the start or completion of the experiment. Overall mean ± s.d. live weight (kg) was 448 ± 50.6 at the beginning of the experiment and 485 ± 32.4 at the end. Overall mean BCS was 2.0 ± 0.34 at the beginning and 2.1 ± 0.34 at the end.
Plasma metabolites and hormones
Weekly samples
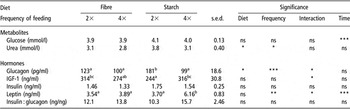
There was no difference between treatments in plasma glucose (Table 2), but plasma urea concentrations were lower when animals were fed four times rather than twice daily (P = 0.029) and when fibre- rather than starch-based diets were fed (P = 0.023). Apart from insulin concentration, which did not differ between treatments, there were interactions between feeding frequency and diet type for plasma hormones. Plasma glucagon was greater in heifers fed starch twice daily compared to other treatments but the insulin : glucagon ratio did not differ between treatments. Plasma leptin was greater in heifers fed the starch-based diet four times daily than in other treatments. Plasma IGF-1 concentration was lower when the starch-based diet was fed twice rather than four times daily.
Plasma metabolite and hormone concentrations from samples taken prior to feeding at weekly intervals

Means in same row with different superscripts are significantly different (P < 0.05). s.e.d. for 18 observations per mean.
Plasma glucose concentration (mmol/l) was higher (P < 0.001) during the first week (4.10) of OPU than subsequent weeks (3.93), while plasma leptin (ng/ml) increased (P < 0.001) from 4.0 to 4.6 during OPU. Concentrations of urea and other hormones measured were not affected by week of experiment.
Post-prandial samples
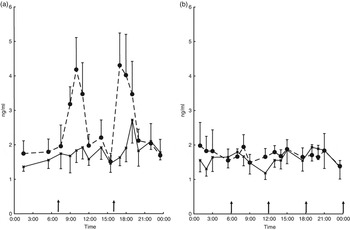
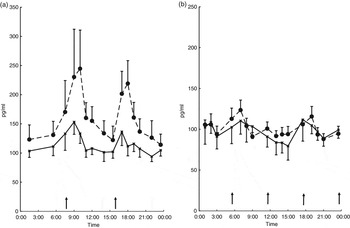
The diets were consumed rapidly and completely within 30 min of feeding. When starch was fed twice daily, there were large post-prandial peaks in insulin concentration (Figure 2) that were largely absent on other treatments. For plasma glucagon, feeding twice daily produced post-prandial peaks (Figure 3) that were more marked when a starch- rather than fibre-based diet was fed.
Changes in plasma insulin concentration (ng/ml) in response to feeding fibre- (▪) or starch- (●) based diets in two (a) or four (b) meals per day. Arrows denote times of feeding. Mean ± s.e. given for six observations.

Changes in plasma glucagon concentration (pg/ml) in response to feeding fibre- (▪) or starch- (●) based diets in two (a) or four (b) meals per day. Arrows denote times of feeding. Mean ± s.e. given for six observations.

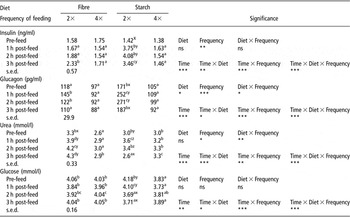
When fibre- or starch-based diets were fed 4× daily (Table 3), insulin and glucagon concentrations did not change as a result of feeding. In contrast, when the starch-based diet was fed twice daily, both insulin and glucagon concentrations increased after feeding. For the fibre-based diet fed twice daily, increases in insulin and glucagon concentration after feeding were non-significant. Insulin concentrations were therefore significantly greater post-feeding when the starch-based diet was fed twice daily compared to other diets. Plasma glucagon concentration was higher on the starch-based diet fed twice daily at all sampling times around feeding (Table 3). When the fibre-based diet was fed twice daily, plasma glucagon concentration was greater than for diets fed four times daily, 1 and 2 h post-feeding. There were no differences between diets fed four times daily in insulin and glucagon concentration. In addition, there were no significant post-prandial changes in the insulin to glucagon ratio (data not shown).
Variation in hormone and metabolite concentrations before and after feeding

Means for 12 (2×) or 24 (4×) observations with s.e.d. for 12 observations. Means in same row (a,b,c,d) or same column (x,y,z) with different superscripts are significantly different (P < 0.05).
Plasma glucose and urea concentrations were within normal ranges for cattle at all times (Kaneko, Reference Kaneko1989). Plasma urea concentrations increased immediately after feeding when heifers were fed twice daily, but did not change when they were fed four times daily (Table 3). Plasma glucose concentration decreased between 1 and 2 h post-feeding in heifers fed the starch-based diet twice daily. In general across sampling times, urea concentrations were highest when the fibre-based was fed twice daily and lowest when the same diet was fed four times daily, with the starch-based diets being intermediate. Before and 1 h after feeding plasma glucose was highest on the starch diet fed twice daily and lowest when this diet was fed four times daily, with the fibre-based diets being intermediate. At the later sampling times (2 and 3 h post-feeding), glucose concentration was lowest when the starch-based diet was fed twice daily, but the ranking of the other diets remained unchanged.
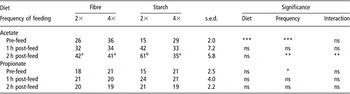
Plasma acetate concentrations (Table 4) were greater prior to feeding when fibre-based diets were fed. When the starch-based diet was fed twice daily, plasma acetate concentration was significantly (P < 0.05) greater 2 h post-feeding compared to other treatments. Neither diet nor feeding frequency influenced plasma propionate concentrations.
Plasma acetate and propionate concentrations (μg/ml) before and after feeding

Means in same row with different superscripts are significantly different (P < 0.05). s.e.d. for six observations.
Oocyte recovery and post-fertilisation development
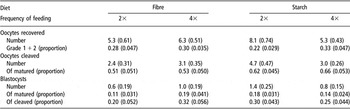
There was no difference (P > 0.05) between treatments in either the size distribution of ovarian follicles or recoveries of oocytes from aspirated follicles. Overall (mean ± s.d.), the proportions of follicles greater than 8 mm in diameter were 0.10 ± 0.110, 5 to 8 mm, 0.45 ± 0.165 and 3 to 5 mm, 0.45 ± 0.168. Mean recovery of oocytes was 0.53 ± 0.231 of follicles aspirated. There was no difference (P > 0.05) between treatments in grade of COCs recovered (Table 5). Although the proportion of oocytes matured that cleaved was greater when heifers were fed starch-based rather than fibre-based diets, the difference was not significant. Similarly there was no effect of diet or feeding frequency on the proportion of blastocysts that developed from matured or cleaved oocytes or in blastocyst developmental stage or cell number. None of the above measurements were influenced by week of experiment.
In vitro development of aspirated oocytes (geometric means are given with s.e.)

No significant differences were observed. s.e. for 36 observations per treatment.
Discussion
The feeding regimes used were successful in producing large meal-related fluctuations in plasma insulin and glucagon concentration by feeding a starch-based diet twice daily. These meal-related fluctuations in hormone concentration were attenuated both by increasing the frequency of feeding of the starch-based diet and by reducing the starch content of the diet. The main findings of the study were that this is the first report that shows that meal-related fluctuations in hormone concentration do not affect oocyte quality. This was despite the diets being fed for 25 days prior to OPU, which in previous studies has induced changes in oocyte quality as a result of feeding differing amounts of either starch (Adamiak et al., Reference Adamiak, Powell, Rooke, Webb and Sinclair2006), lipid (Adamiak et al., Reference Adamiak, Powell, Rooke, Webb and Sinclair2006; Fouladi-Nashta et al., Reference Fouladi-Nashta, Gutierrez, Gong, Garnsworthy and Webb2007) or nitrogen (Sinclair et al., Reference Sinclair, Kuran, Gebbie, Webb and McEvoy2000). Further, regression analyses performed to assess relationships between metabolites, hormones and oocyte quality were not significant (data not shown). Thus while the carbohydrate composition of the diet did influence hormone concentrations in non-lactating heifers, there were no corresponding effects on oocyte quality.
Meal-related changes in hormone concentration
Plasma concentrations of both insulin and glucagon increase in response to feeding (Bassett, Reference Bassett1975; Harmon, Reference Harmon1992). Smith et al. (Reference Smith, Stinefelt, Blemings and Wilson2006) have shown that post-prandial increases in plasma insulin and glucagon concentration are related specifically to propionate absorption from the rumen into the portal circulation. Propionate production in the rumen is related to starch digestion and thus the extent of increases in plasma insulin and glucagon concentration is related to the proportion of starch in the diet (Thorp et al., Reference Thorp, Wylie, Steen, Shaw and McEvoy2000). However, changes in peripheral insulin and glucagon concentration in response to changes in the numbers of meals fed daily have been inconsistent. A minimum proportion of starch in the diet fed in two meals per day seems to be necessary. Thus in the present experiment (380 g starch/kg dietary dry matter (DM)) and in Sutton et al. (Reference Sutton, Hart, Morant, Schuller and Simmonds1988) (380 g starch/kg DM, estimated from ingredient composition) and Thorp et al. (Reference Thorp, Wylie, Steen, Shaw and McEvoy2000) (340 g starch/kg DM, estimated) post-prandial increases in plasma insulin and glucagon were observed when diets were fed twice daily. However, increasing the number of feeds (present experiment two to four times daily; Sutton et al., Reference Sutton, Hart, Morant, Schuller and Simmonds1988, two to six times daily) or reducing the proportion of starch in the diet (present experiment; Sutton et al., Reference Sutton, Hart, Morant, Schuller and Simmonds1988; Thorp et al., Reference Thorp, Wylie, Steen, Shaw and McEvoy2000) attenuated the response. Thus it seems necessary to exceed both a threshold in the amount of starch consumed per feed and proportion of starch in the total amount of feed consumed to increase propionate concentration rapidly enough to generate post-prandial peaks in insulin and glucagon. However, no changes in insulin concentration were observed when the feeding frequency was two times daily in lactating dairy cows (French and Kennelly, Reference French and Kennelly1990; French et al., Reference French, De Boer and Kennelly1990) fed a diet containing 340 g starch/kg DM and so other factors such as rate of feed consumption or physiological state may also be important.
Diet, hormone concentrations and oocyte quality
Varying the frequency of feeding was not associated with changes in oocyte quality as assessed by oocyte maturation or blastocyst yield. Therefore, it appears that the ovary is not sensitive to meal-related changes in hormone concentration so assessment of peripheral hormone concentrations on a daily or less-frequent basis is adequate when considering nutritional effects on oocyte quality, provided blood samples are always collected at the same time relative to feeding.
Insulin
In the present experiment, feeding a starch-based concentrate rather than a fibre-based concentrate at twice the maintenance level increased pre-feed insulin concentrations only modestly and non-significantly (from 1.4 to 1.6 ng/ml), and there was no associated change in blastocyst yield. Adamiak et al. (Reference Adamiak, Powell, Rooke, Webb and Sinclair2006) fed similar diets and also found similar modest increases in insulin concentration when a starch-based diet was fed; differences in blastocyst yield between starch- and fibre-based diets were modest and only observed in leaner heifers (BCS < 2.5). When plasma insulin concentrations were increased by a similar or greater magnitude by increasing the feeding level of a starch-based diet from once to twice maintenance (Adamiak et al., Reference Adamiak, Mackie, Watt, Webb and Sinclair2005), blastocyst yield was either increased or decreased depending on the BCS of the heifers. Thus the results from the present experiment support the conclusion of Adamiak et al. (Reference Adamiak, Powell, Rooke, Webb and Sinclair2006) that although both substituting starch for fibre in the diet and increasing the amount of diet fed increased plasma insulin concentrations, the outcomes in terms of blastocyst yield and therefore underlying mechanisms differed. Hence it appears that plane of nutrition, as noted by Adamiak et al. (Reference Adamiak, Mackie, Watt, Webb and Sinclair2005) and others previously (Nolan et al., Reference Nolan, O’Callaghan, Duby, Lonergan and Boland1998; Yaakub et al., Reference Yaakub, O’Callaghan and Boland1999; Armstrong et al., Reference Armstrong, McEvoy, Baxter, Robinson, Hogg, Woad, Webb and Sinclair2001), is a more important determinant of blastocyst quality in non-lactating cattle than changes in diet composition.
In the present study, plasma insulin concentrations (1.3 to 1.8 ng/ml) were markedly higher than those reported by Adamiak et al. (Reference Adamiak, Mackie, Watt, Webb and Sinclair2005 and Reference Adamiak, Powell, Rooke, Webb and Sinclair2006) for heifers of similar BCS (<3) and fed similar diets. Concentrations were in fact closer to those (2.0 ng/ml) reported by Adamiak et al. (Reference Adamiak, Mackie, Watt, Webb and Sinclair2005) for moderately fat (>3.5 units BCS) beef × Holstein heifers. In that experiment, Adamiak et al. (Reference Adamiak, Mackie, Watt, Webb and Sinclair2005) reported poorer oocyte quality in hyperinsulinaemic heifers (plasma insulin >1.55 ng/ml). Recently, oocytes recovered from hyperinsulinaemic mice (insulin greater than 2 ng/ml) have also been shown to have compromised developmental potential (Acevedo et al., Reference Acevedo, Ding, Cabrera and Smith2006). In the present experiment, 11 of 24 animals had insulin concentrations greater than 1.55 ng/ml. However, there was no adverse effect of high insulin on oocyte quality.
An explanation as to why insulin concentrations in the current experiment (1.3 to 1.8 ng/ml) for Holstein heifers at a BCS of 2 were greater than reported by Adamiak et al. (Reference Adamiak, Mackie, Watt, Webb and Sinclair2005 and Reference Adamiak, Powell, Rooke, Webb and Sinclair2006) for beef × Holstein heifers at a similar BCS may be found in leptin concentrations, which were also greater. Both insulin and leptin were closer to those observed by Adamiak et al. (Reference Adamiak, Mackie, Watt, Webb and Sinclair2005) at a higher BCS (3.5 to 4.0). Circulating leptin concentrations are positively correlated with body fatness and BCS in cattle (Ehrhardt et al., Reference Ehrhardt, Slepetis, Siegal-Willott, Van Amburgh, Bell and Boisclair2000; Chilliard et al., Reference Chilliard, Delavaud and Bonnet2005; Lents et al., Reference Lents, Wettemann, White, Rubio, Ciccioli, Spicer, Keisler and Payton2005) and this general relationship was apparent in Adamiak et al. (Reference Adamiak, Mackie, Watt, Webb and Sinclair2005 and Reference Adamiak, Powell, Rooke, Webb and Sinclair2006). If leptin concentrations reflect body fatness more accurately than BCS, then the Holstein heifers were fatter at a given BCS than beef × Holstein heifers. As BCS assesses primarily subcutaneous fat deposition, then it is likely that the Holstein heifers contained more fat in other adipose tissue depots. Studies in which fat deposition in different breeds of cattle has been measured support this observation (Taylor and Murray, Reference Taylor St and Murray1991; Keane and More O’Ferrall, Reference Keane and More O’Ferrall1992). Thus the Holstein heifers in the present study with BCS 2 probably performed similarly to beef × Holstein heifers of BCS > 2.5. The lack of effect of diet composition on oocyte quality therefore agrees with responses observed in heifers of moderate BCS (Adamiak et al., Reference Adamiak, Mackie, Watt, Webb and Sinclair2005).
Glucagon
In contrast to insulin, less attention has been paid to possible interactions between glucagon and reproductive status. Glucagon had no effect on granulosa or theca cell proliferation or IGF-1 production in vitro (Spicer and Chamberlain, Reference Spicer and Chamberlain2000), but inhibited IGF binding protein 4 and 5 production by granulosa and thecal cells when administered alone or in combination with insulin (Chamberlain and Spicer, Reference Chamberlain and Spicer2001). In cattle, Mann et al. (Reference Mann, Green, Sinclair, Demmers, Fray, Gutierrez, Garnsworthy and Webb2003) fed starch-based and fibre-based diets and found increased insulin : glucagon ratios when starch was fed. The increased insulin : glucagon ratio was associated with enhanced early embryo development in vivo. More recently, Fouladi-Nashta et al. (Reference Fouladi-Nashta, Gutierrez, Gong, Garnsworthy and Webb2007) found a positive association between blastocyst yield and plasma glucagon, although this effect was less marked than a similar positive association with insulin. In the present experiment, no relationship was observed between oocyte quality and glucagon concentration or insulin : glucagon ratio. Thus, it appears likely that if oocyte quality is influenced by glucagon then any effects may not be independent of associated changes in insulin concentration.
Conclusions
The present experiment showed that modifying feeding frequency successfully produced meal-related fluctuations in hormone concentrations, but there was no associated effect on oocyte quality, suggesting that the oocyte is insensitive to short-term meal-related fluctuations in plasma hormone concentration. Increasing the proportion of starch in the diet did not affect oocyte quality. This may have been because body fatness was not predicted well by BCS in Holstein heifers and plasma leptin concentration may be a more reliable indicator of fatness.
Acknowledgements
The work presented here was funded by Defra (Department for Environment, Food and Rural Affairs). SAC receives financial assistance from the Scottish Government Rural and Environment Research and Analysis Directorate. We thank John Struthers and Calum Angus-Meldrum for the care of the animals, and Marcus Mitchell, Morag Ewen, Karen Mackie and Gilbert McCallum for skilled technical assistance.