Implications
Osteochondrosis is a major cause of joint problems in pigs. Bone strength is also important in the slaughtering process since parts of the carcass can be rejected because of broken bones. In this study, pigs were examined for osteochondrosis and bone strength post mortem. Up to 50% of the studied pigs had osteochondral lesions, even though most of these belonged to the mildest form of osteochondrosis. The estimated heritabilities for osteochondrosis and bone strength were moderate (0.05 to 0.26), indicating that osteochondrosis and bone strength can be improved through selection. Such improvements have a direct, favorable effect both on animal welfare and on farmer income.
Introduction
Strong bones and healthy joints are important for pig welfare and production as well as for carcass quality in the pork production. Sows with leg problems are readily replaced in herds; consequently, they produce lower numbers of piglets during their entire lifetime and are less profitable than sows without leg problems (Serenius and Stalder, Reference Serenius and Stalder2006). Leg problems also create unnecessary pain in the animals as well as economic losses in pork production because of the reduced growth, early culling and rejection of the carcass or parts of it at slaughter. It has been estimated that osteochondrosis (OC) is the cause of half of the arthritis in Finnish pigs and half of the rejections of parts of the carcass (2.5% of all slaughtered pigs) (Mälkiä, Reference Mälkiä2002). Bones broken during the slaughter process are another reason for rejecting a part of the carcass, for example ham. Strong bones, thus, have economic value in the pork production.
OC, an abnormal bone development in the joints, is the main cause of leg problems in pigs (Lundeheim, Reference Lundeheim1987; Jorgensen, Reference Jorgensen2000). OC is more frequently found in the rear leg than in the front leg joints, and as many as half of the pigs can have some, usually mild, osteochondral lesions (Jorgensen and Andersen, Reference Jorgensen and Andersen2000; Yazdi et al., Reference Yazdi, Lundeheim, Rydhmer, Ringmar-Cederberg and Johansson2000; Kadarmideen et al., Reference Kadarmideen, Schwörer, Ilahi, Malek and Hofer2004; Luther et al., Reference Luther, Schwörer and Hofer2007). The OC pathogenesis is characterized by a failure in matrix calcification or vascular invasion of an area of the growth cartilage and a subsequent failure in the conversion of cartilage to bone (Ekman and Carlson, Reference Ekman and Carlson1998; Ytrehus et al., Reference Ytrehus, Carlson and Ekman2007). Many mammals are known to suffer from OC, and it has been speculated that the pathology of OC is, in principle, the same in all mammals, including humans (Olsson and Reiland, Reference Olsson and Reiland1978). A review by Ytrehus et al. (Reference Ytrehus, Carlson and Ekman2007) suggests that heredity and anatomic characteristics are the most significant etiologic factors behind OC, while less important factors include rapid growth, a major trauma or the diet. Even though a trauma can be the primary cause of osteochondral fractures, it is not an initial cause of osteochondral changes in the growth cartilage (Ytrehus et al., Reference Ytrehus, Carlson and Ekman2007).
The heritability estimates for OC in pigs are moderate, varying from 0.2 to 0.4 (Lundeheim, Reference Lundeheim1987; Jorgensen and Andersen, Reference Jorgensen and Andersen2000; Yazdi et al., Reference Yazdi, Lundeheim, Rydhmer, Ringmar-Cederberg and Johansson2000; Kadarmideen et al., Reference Kadarmideen, Schwörer, Ilahi, Malek and Hofer2004; Jorgensen and Nielsen, Reference Jorgensen and Nielsen2005; Luther et al., Reference Luther, Schwörer and Hofer2007). The heritability of bone strength, however, has not been widely studied. Li et al. (Reference Li, Mohan, Gu, Wergedal and Baylink2001) found a fairly high estimate for the heritability of humerus breaking strength (h 2 = 0.68) in inbred mice. They concluded that bone strength (forelimb) is a combination of bone mineral density, forelimb grip strength and forearm bone size, as these factors explained 61% of the variation in bone breaking strength (Li et al., Reference Li, Mohan, Gu, Wergedal and Baylink2001).
In this study, we investigated the prevalence and heritability of OC in Finnish pig breeds and present the first heritability estimates for bone strength in pigs. We also estimated the genetic and phenotypic correlations between OC, bone strength and carcass meat percentage. Meat percentage was included because selection for this trait leads to a situation where the animals’ bones have to support heavier muscles. Therefore, it is interesting to know whether selection for high meat percentage has an effect on bone strength or susceptibility to OC.
Material and methods
Test station material
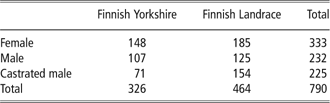
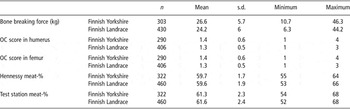
The pig material for this research was collected during 2004 to 2006 from Finnish pig breeding test stations. Our data comprised 326 Finnish Yorkshire and 464 Finnish Landrace pigs. Three pigs (females, males or castrates) from the same litter were included in each test group. Testing started when the average weight of the piglets in a group reached 30 kg. Pigs were weighed once a week and feeding was slightly restricted based on the mean weight of the test group (from 1.6 feed unit (FU)/day at 30 kg weight to 3.2 FU/day at 120 kg, where 1 FU = 9.3 MJ net energy). The test period for a pig ended when it reached 104 kg live weight, but the last pig of a group was removed together with the second last pig regardless of whether or not it had reached the target weight. Average live weights at the end of the testing period were 104.4 kg (minimum = 75.4 kg, maximum = 119.4 kg, s.d. = 5.1 kg) and 103.9 kg (minimum = 83.9 kg, maximum = 123.9 kg, s.d. = 5.1 kg) for Finnish Landrace and Finnish Yorkshire pigs, respectively. Corresponding average carcass weights were 75.2 kg (minimum = 52.9 kg, maximum = 87.4 kg, s.d. = 4.1 kg) and 75.3 kg (minimum = 62.0 kg, maximum = 90.9 kg, s.d. = 4.0 kg) for Finnish Landrace and Finnish Yorkshire pigs, respectively. All carcasses were then dissected and evaluated for bone strength, OC and meat percentage. Table 1 gives the gender distribution and Table 2 the average family sizes in the data. On average, there were nine half or full sibs per sire. Records on all of the studied 790 animals and pedigree information on altogether 2496 animals were available for heritability estimation. The actual number of records for each trait (Table 3) differs from the original 790 because not all the traits were measured for all the animals for various reasons.
Number of test animals and their gender distribution by breed

Family structure of the data

Descriptive values for bone strength, OC and meat-% for Finnish Yorkshire and Finnish Landrace

OC = osteochondrosis.
Bone breaking strength and OC
Bone breaking strength was measured from the fibula by tree-point bending using Instron 4301 (Instron, Norwood, MA, USA) with a constant speed of 5 mm/min and 100 kg force. The frozen bones were thawed for 3 h in a plastic bag before bone strength measurement to avoid the unnecessary drying. The first 300 measurements were taken at the Department of Food Technology (University of Helsinki) and the rest at the Finnish Meat Research Institute using the same device and method.
For OC evaluation the proximal end of the humerus and the distal end of the femur were horizontally cut, and the evaluation was done by two trained persons using the Norwegian Meat and Poultry Research Centre’s photo catalogue (www.animalia.no). The scale was from 1 to 6 where 1 = normal cartilage; 2 = minimal variation in cartilage thickness, no damages in bone; 3 = varying cartilage thickness, some bruises and openings between cartilage and bone; 4 = same as three but more and larger openings, cartilage may be partly loose; 5 = cartilage is broken and loose in a limited area and cracked down to subchondral bone and 6 = same as five but cartilage is broken and loose in a larger area. OC scores were available for 696 animals.
Meat percentage
Two formulas were used to calculate the lean meat percentage: Hennessy meat-% and test station meat-%. The former is routinely used in slaughterhouses, whereas the latter formula is only used as a selection criterion for test station pigs. The Hennessy meat-% formula was:

where S1 is back-fat thickness at the last rib 80 mm from the backbone, S2 is back-fat thickness between the third and fourth ribs counting from the last rib and 60 mm from the backbone, and M is the muscle depth at the same position as S2. All measurements were carried out using a Hennessy GP4 probe (Hennessy Grading Systems Ltd, Auckland, New Zealand). The test station meat-% differs in that and it also includes the weight of dissected lean meat in ham expressed as percentage of the carcass (H):

Honkavaara et al. (Reference Honkavaara, Sevón-Aimonen, Mäki-Tanila, Puolanne, Ruusunen, Siljander-Rasi and Partanen2007) found that the Hennessy meat-% explained only 67% of the variation in the true carcass lean meat content, which is why the content of lean meat in ham was introduced into the test station meat-%. The formula that included the lean meat in ham was able to explain 90% of the observed variation in the carcass lean meat content in their data (Honkavaara et al., Reference Honkavaara, Sevón-Aimonen, Mäki-Tanila, Puolanne, Ruusunen, Siljander-Rasi and Partanen2007).
Statistical methods
Data were first analyzed with a general linear model (SAS, SAS Institute Inc., Cary, NC, USA) to select the most significant fixed effects for the models for variance component estimation. For bone strength, the final model was:

where Yijklm is the observation, sexi is the fixed effect of sex (i = 1,2,3), mpj is the fixed effect of the place of measurement ( j = 1,2), rsk is the fixed effect of the rearing batch within the station effect (k = 1…15), b is the regression coefficient for carcass weight (wl), lm is the litter effect, al is the additive genetic effect of the animal and eijklm, is the residual term. For OC, the final model was:

and the final model for the two meat-% traits was:

The litter, animal and residual effects were assumed random with zero means and variances A*G, I*L and I*R, where I is the identity matrix; A is the additive genetic relationship matrix among the animals; and G, L and R denote the variance-covariance matrices of the studied traits for additive genetic, litter and residual effects, respectively. The two breeds were analyzed both separately and jointly, and the estimation model for joint analysis also included a fixed breed effect. Variance components and genetic correlations (rg) were estimated using the REML method (average information algorithm) in the DMU program package (Jensen and Madsen, Reference Jensen and Madsen2000).
Results and discussion
The average force to break the fibula was 26.6 kg (s.d. 5.7) for Finnish Yorkshire and 24.2 (s.d. 6.0) for Finnish Landrace (Table 3). Finnish Yorkshire pigs thus had stronger bones than Finnish Landrace (P < 0.001). The distribution of OC scores for the two breeds is given in Table 4. No severe OC (scores five and six) were detected in this study for either of the breeds, but Finnish Yorkshire had more OC in the proximal end of the humerus (36%) than Finnish Landrace (29%) (P = 0.07 for the difference between breeds). Similarly, OC in the distal end of the femur was also more common in Finnish Yorkshire (51%) than in Finnish Landrace (31%) (P < 0.001 for the difference between breeds). The OC percentage in our study is similar to that reported in a Danish study (Jorgensen and Andersen, Reference Jorgensen and Andersen2000) where 15% of Danish Yorkshire and 28% of Danish Landrace boars had osteochondral lesions in the humeral condyles, and 56% of Danish Yorkshire and 84% of Danish Landrace boars had osteochondral lesions in the distal end of the femur. Higher percentages of OC were obtained with the Swedish test station data (Lundeheim, Reference Lundeheim1987) where 54% of castrated Swedish Landrace and 40% of castrated Swedish Yorkshire boars had some sort of lesions in the humeral condyles. OC percentages in the femoral condyles were even higher: 97% and 73% for Swedish Landrace and Swedish Yorkshire castrated boars, respectively. In Swiss data (Luther et al., Reference Luther, Schwörer and Hofer2007), only 1% of test station pigs had osteochondral lesions in the proximal end of the humerus and 21% to 42% in the distal end of the femur (depending on the breed). Such large differences in OC prevalence between different countries and breeds may be explained by differences in genetic, housing and other population-related factors. Nevertheless, the most likely reason for the variation in OC prevalence between countries is probably the scoring system, which is based on visual inspection instead of actual measurements.
The OC score distribution (number of animals) for Finnish Yorkshire and Finnish Landrace

OC = osteochondrosis.
Heritabilities
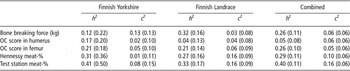
The heritability estimates in Table 5 show that bone strength heritability was higher for Finnish Landrace (h 2 = 0.32) than for Finnish Yorkshire (h 2 = 0.12). In contrast, the heritability of OC in the humerus was higher for Finnish Yorkshire (h 2 = 0.17) than for Finnish Landrace (h 2 = 0.04). Otherwise the heritability estimates between the two breeds were similar. However, based on the standard errors, the data for Finnish Landrace gave more reliable heritability estimates than the Finnish Yorkshire data. This was due to the size and structure of the data sets: more records were available for Finnish Landrace and also the offspring groups were a bit larger than for Finnish Yorkshire.
Heritability estimates (h 2) for bone strength, OC and meat-% for Finnish Yorkshire, Finnish Landrace and combined data for both breedsFootnote a

OC = osteochondrosis.
Standard error values are presented in brackets.
a c 2 = ratio of litter variance.
The most reliable estimates (smallest standard errors) were obtained using the combined data under the assumption that the genetic background and amount of genetic variance of the studied traits are similar in both breeds. Moderate heritabilities (h 2 between 0.26 and 0.29) were obtained for bone strength, OC in the femur and Hennessy meat-%. The heritability of test station meat-% was higher (h 2 = 0.40) and closer to the values presented in the literature (Serenius et al., Reference Serenius, Sevón-Aimonen and Mäntysaari2001 and Reference Serenius, Sevón-Aimonen, Kause, Mäntysaari and Mäki-Tanila2004; Van Wijk et al., Reference Van Wijk, Arts, Matthews, Webster, Ducro and Knol2005) than the heritability of meat-% based on the Hennessy formula (h 2 = 0.29). Because of the higher heritability of test station meat-%, selection based on the modified formula with lean meat in ham included should give faster genetic progress in meat-% than selection based on the Hennessy formula alone. The modified formula is currently used in national genetic evaluation in Finland.
The heritability estimates for OC in the femur obtained in this study (h 2 = 0.26, both breeds combined) were higher than in the previously mentioned Swedish (h 2 = 0.21) (Yazdi et al., Reference Yazdi, Lundeheim, Rydhmer, Ringmar-Cederberg and Johansson2000) and in Swiss (h 2 = 0.18) (Luther et al., Reference Luther, Schwörer and Hofer2007) studies, but lower than in the Danish study (h 2 = 0.31 to 0.32) (Jorgensen and Andersen, Reference Jorgensen and Andersen2000). The OC heritability in the humerus (h 2 = 0.09 to 0.25) was lower than OC heritability in the femur (h 2 = 0.31 to 0.32) both in our study and in the Danish study (Jorgensen and Andersen, Reference Jorgensen and Andersen2000). In the Swedish study, on the other hand, OC heritability was similar both in the humerus and the femur (Yazdi et al., Reference Yazdi, Lundeheim, Rydhmer, Ringmar-Cederberg and Johansson2000). On the basis of our results and those of previous studies, the heritability of OC seems to be higher in the femur than in the humerus, and thus, selection for lower prevalence of OC seems to be more effective for the rear legs than the front legs.
Correlation between traits
The genetic and residual correlations between the studied traits are given in Table 6. Genetic correlation between OC scores in the front and rear legs was positive but only moderate (rg = 0.31). Jorgensen and Andersen (Reference Jorgensen and Andersen2000) found stronger genetic correlation (rg = 0.52) but Luther et al. (Reference Luther, Schwörer and Hofer2007) weaker genetic correlation (rg = −0.14) between front and rear leg OC than in our study.
Genetic (below diagonal) and residual (above diagonal) correlations between studied traits for combined Finnish Yorkshire and Finnish Landrace data

OC = osteochondrosis.
Standard error values are represented in brackets.
A negative genetic correlation was observed between meat-% and OC in the humerus, indicating that pigs with high meat-% are genetically also more resistant to OC. The opposite was found for OC in the femur: pigs with high meat-% tended to be genetically more susceptible to OC. Similarly, a mildly positive genetic correlation (rg = 0.11) between the percentage of premium cuts and OC in the rear legs was reported by Luther et al. (Reference Luther, Schwörer and Hofer2007). They also observed a positive, although weak genetic correlation (rg = 0.06) between the percentage of premium cuts and OC in the front legs. Jorgensen and Andersen (Reference Jorgensen and Andersen2000) found a weak negative correlation (rg = −0.08) between the proportion of lean meat and overall OC (sum of all OC traits). Thus, based on our study and previous results, OC and meat percentage are most probably genetically uncorrelated or the correlation is weak.
Bone strength indicated no genetic correlation with meat-% traits but was positively correlated with OC in the humerus (rg = 0.54), indicating that pigs with strong bones tend to be genetically more susceptible to OC than pigs with weaker bones. All covariance estimates were associated with large standard errors, however, and more data are needed to achieve more reliable estimates of their genetic correlations.
Conclusions and implications
In conclusion, Finnish Yorkshire was found to have stronger bones than Finnish Landrace but OC was also more common in Finnish Yorkshire than in Finnish Landrace. As many as half of the studied Finnish Yorkshire pigs showed some variation in cartilage thickness in the femur, suggesting the very first stage of OC. It would have been interesting to know how these changes develop along the animal’s age, but this was not possible since OC scoring was based on bone cuttings instead of X-ray investigation. Bone strength was moderately heritable (h 2 = 0.26), which indicates that selection for strong bones is possible in a test station setting. OC heritability was moderate in the rear legs (h 2 = 0.26) but low in the front legs (h 2 = 0.05). On the basis of our results and on previous studies, OC has moderate heritability (0.2 to 0.3) (depending on the examination site and the breed) (Lundeheim, Reference Lundeheim1987; Yazdi et al., Reference Yazdi, Lundeheim, Rydhmer, Ringmar-Cederberg and Johansson2000; Jorgensen and Andersen, Reference Jorgensen and Andersen2000; Luther et al., Reference Luther, Schwörer and Hofer2007). Moreover, selection for higher meat-% can have opposite effects on OC susceptibility in the rear and front legs, but the obtained correlations were associated with high standard errors, and so the connections are not reliable. More data are therefore needed to get more reliable estimates of the genetic correlation between OC and meat-%.