


Introduction
Reference BagnoldBagnold (1941) identified four distinct sub-processes in the saltation system: aerodynamic entrainment, grain trajectory, grain–bed collisions and wind modification. In the last decade, some progress has been made in modelling acolian particle transport which includes these four sub-processes (Reference Anderson and HaffAnderson and Haff, 1988, Reference Anderson and Haff1991; Reference WernerWerner, 1990; Reference SorensenSorensen, 1991; Reference McEwan and WillettsMcEwan and Willetts, 1991). However, the interaction of the sub-processes and hence the behavior of a saltating system is poorly understood and more detailed experiments are essential.
In this study, we carried out drifting-snow experiments in a cold wind tunnel to investigate in detail the above four sub-processes. Not only were the particle trajectories measured but also a new drag meter was used to measure shear stresses acting on the snow surface. Stream-wise fluxes were measured with a snow-particle counter (SPC). This paper introduces an outline of each measurement and the numerical simulation of the particle-trajectory path and flux profile. Detailed descriptions will be published separately.
Experimental Equipment and Procedure
Cold Wind Tunnel
Experiments were carried out in a cold wind tunnel located at the Institute of Low Temperature Science, Hokkaido University, as shown in Figure 1. It is a closed-circuit wind tunnel situated in a large cold laboratory and has a working section of 0.5 m × 0.5 m, up to 8 m in length. The temperature of the wind tunnel could be varied between 0° and −30°C. Experiments on snow particle saltation were conducted at −18°C in order to prevent rapid adhesion due to sintering between particles.
Schematic view of the cold wind tunnel at the Institute of Low Temperature Science, Hokkaido University.

The snow used in the experiments was natural finegrained snow, which was collected from outside in winter and kept in a cold room at −10°c for about a year. Figure 2 gives the cumulative size distribution. The size distribution can be regarded roughly as a normal distribution. The average particle size expressed as a diameter of a circle with equivalent projected area was 0.36 mm. The same snow used in the experiments was placed on the wind-tunnel surface, forming a layer roughly 0.02 m thick. The surface of the bed was prepared as smoothly as possible. In order to initiate and maintain steady saltation, seed particles were supplied by a device consisting of a motor-driven sieve and jack as shown in Figure 1. Particles were supplied from the bottom of the wind-tunnel entrance at a constant rate. Although precise measurements aimed at obtaining the threshold friction velocity were not carried out, a rough estimate by measuring the point at which the saltation ceased while decreasing the wind speed from a high value showed that the impact threshold was 0.15 ms−1.
Cumulative size distribution of snow particles.

A tunnel reference wind velocity was measured with a micro-ultrasonic anemometer, having a probe span of 0.05 m and a time resolution of 20 Hz. It was installed at the tunnel centre line at mid-height, 0.25 m above the surface. When no particle saltation was initialed, the vertical wind-velocity profile in the wind tunnel could be measured with a hot-film anemometer. A steady wind velocity profile was formed roughly 0.5 m downstream from the edge of the particle bed (Reference Kosugi, Nishimura and MaenoKosugi and others, 1992). The thickness of the steady turbulent boundary layer determined from the wind-velocity profile was about 0.2 m.
Particle Movement
Trajectories of saltating particles near the bed were recorded with a video system from the side of the wind tunnel. The illumination source was a laser sheet, 2 Wat maximum power, which provided a vertical plane of light about 0.01 m wide in the observation region. This prevented too many particles from appearing in one picture and allowed the camera to focus on the particles. In order to interrupt the light at regular intervals, a rotating shutter was set on the laser source. Thus, particle trajectories were shown as a series of dashes rather than as continuous lines. The rotation velocity of the shutter was adjusted for each experimental run.
The pictures obtained were digitized with a micro-computer system and the saltation-trajectory statistics, such as ejection and impact velocities, were calculated. Quantities which characterize the saltation paths are shown schematically in Figure 3.
Definition of quantities which characterize saltation trajectories. VI and VE are velocities of impact and ejection. αI and αE are angles of impact and ejection.

Snow-Particle Counter
A snow-particle counter (SPC), which can sense not only the number of particles but also their diameter, was also introduced. SPC was originally developed by Reference SchmidtSchmidt (1977) and this brought remarkable advantages in measuring drifting snow, but sensitivity within the sampling area was not uniform. The SPC used in this study was the one improved by Reference Kimura, Maruyama and IshimaruKimura and others (1993) by using a laser diode with collimator (SPC-S7, Niigata Denki Co.). Figure 4 shows the schematic diagram of the SPC. Particles that pass through the sampling area (2 − 25− 0.5 mm) are divided into 32 classes depending on their diameter (50–500 mm). The particle numbers in each class are measured every one second. Thus, we can calculate the flux distribution and the transport rate as a function of particle size.
Schematic view of the snow-particle counter SPC-S7 (Reference Kimura, Maruyama and IshimaruKimura and others, 1993).

Drag Meter
Shear stress on the bed can been found by using the following two methods. The first is computation from the vertical wind profile assuming the validity of the law of the wall. The second is the eddy-correlation method, which relies on simultaneous measurement of the fluctuating quantities expressed in the Reynolds stress equation, t = ρu′w′, with hot-wire or ultrasonic anemometers. However, in the saltation cloud, impacting and even melting of snow particles on the probe sometimes produced significant noise on the record. For this reason, precise data have been difficult to obtain by using the above two methods and the problem remains to be resolved. Therefore, several attempts have been made to measure directly the shear stress on the snow surface (Reference KobayashiKobayashi, 1969; Reference Nishimura and Hunt.Nishimura and Hunt, in press b). In both cases, however, careful calibration needs to be done before the measurements.
In this study, we developed a new drag meter which consists of a test plate, which is 0.19 m − 0.19 m in size and a Strain-gauge-type load cell. This device can sense not only the shear stress but also the normal stress acting on the snow surface. To minimize the edge effects, the upper level of the plate was carefully adjusted and the gap between the test surface and its surroundings was set to be 1–2 mm.
Results and Discussions
Particle Movement
The friction velocities u* used in the experiments were 0.15, 0.23, 0.30 and 0.39 m s−1. These values are 1.0–2.6 times larger than the estimated impact threshold. The number of particle paths examined are 489, 465, 470 and 428, respectively. Figure 5 shows the distribution of velocities and angles at u* = 0.30 m s−1, and the mean values of the trajectory statistics are listed in Table 1. As shown in Table 1, significant changes in the values of velocities and angles were found by using friction velocity; and with increasing wind velocity, impact velocity increased as we should expect. The decrease in both ejection and impact velocities going from friction velocities of 0.15–0.23 m −1 is probably because ejecta which were released by the impact of high-speed particles and the velocity of which is much smaller than the rebound particles appeared and were involved in the calculation of the statistics at 0.23 ms−1; only seeded particles were found to rebound at 0.15 ms−1. We note particularly the effect on angles. The angle of ejection decreased monotonically from 49° to 17° with an increase in wind, whereas the impact angle remained almost constant and the parabolic trajectories were significantly elongated with increasing friction velocity. Reference Araoka and MaenoAraoka and Maeno (1981), who carried out similar measurements, recognized that the angle and velocity of an incident snow particle and those of rebounding ones are not unique but distributed over wide ranges. They found that the mean impact velocity and angle were 1.9 ms−1 and 11° and the mean ejection velocity and angle were 1.0 m s −1 and 49°. Since the friction velocity in their experiments can be estimated as 0.19 ms−1, our observed values are largely in agreement.
Frequency distribution of velocities VI and VE and angles αI and αE. Friction velocity is 0.30 m s−1.

The mean values of saltation trajectory statistics

Particle velocities and angles were also obtained as a function of height. Mean values with the standard deviation are shown in Figures 6. Velocities of descending particles are greater than those of ascending ones. Regarding the angles, the standard deviation of ascending particles is much greater than that of descending particles. It is probably because the wind drags the particles and increases the horizontal component of their velocities, which are generally much larger than the vertical one.
Profiles of particle velocities and angles. Left is for patides ascending and right descending.

Figure 7 shows the particle diameter distributions measured with the SPC. All distributions are asymmetric and strongly skewed with increasing height; the proportion of small particles becomes larger with height, although the snow used can roughly be regarded as a normal distribution as found in Figure 2.
Profiles of size distribution measured with SPC. Friction velocity is 0.30 m s−1.

Horizontal Flux
The horizontal particle flux as a function of height was also obtained by using the SPC, as shown in Figures 8. All data represent an exponential decay with height as a number of researchers (Reference Rasmussen, Sorensen, Willetts and Barndorff-NielsenRasmussen and others, 1985; Reference TakeuchiTakeuchi, 1980; Reference White and Mounlawhite and Mounla, 1991) have previously found for sand and snow. Reference Nalpanis, Hunt and BarrettNalpanis and others (1993) proposed that the following relationship could be used to describe the exponential dependence of mass distribution f 1 with height z:

where α and λ are dimensionless parameters for a single experiment and (u * 2/g) is the vertical scale height. Values for the parameter λ evaluated from the profiles in Figure 8 are listed in Table 2. Although the flux decay becomes smaller with an increase in friction velocity, u * as shown in Figure 8, the gradient normalized with the vertical scale height shows an obvious increase with friction velocity u *. This trend agrees with the sand experiment by Reference White and MounlaWhite and Mounla (1991).
Horizontal mass-flux profiles.  , u* = 0.15 m s−1;
 , 0.23 m s−1;
 , 0.30 m s−1; + , 0.39 m s−1.

Parameter λ of horizontal flux profile

Furthermore, by integrating the above flux profiles, a total horizontal flux per unit width (snowdrift rate) Ft was calculated. Reference BagnoldBagnold (1941) showed that the sand-transport rate, including creep and saltation, varies with the shear velocity cubed. In fact, the following, obtained by using the least squares method, is a good approximation to express Ft, in this study

The SPC also made more detailed investigation possible. Figure 9 indicates the power factor p, which is 3 according to Bagnold's above semi-empirical theory, as a function of particle diameter. Although the power is almost 3 when the particle diameter is larger than 0.3 mm, it shows a remarkable increase with decreasing particle diameter. In the saltation process, the motions of the particles are strongly affected by the horizontal air flow but less so by the vertical turbulent eddies. At a higher speed, a further transition occurs, apparently in a change in the mode of transfer from saltation to suspension. According to the criteria of Reference Hunt, Nalpanis and Barndorff-NielsenHunt and Nalpanis (1985), 0.10 and 0.15 mm snow particles lead to suspension if friction velocity is larger than 0.28 and 0.41 ms−1 respectively. For the smaller particles, the observed friction velocities of 0.30 and 0.39 ms −1 in our study are larger than this criterion, therefore it is reasonable to conclude that the suspended particles led to the increase in the power factor in Figure 9.
Powerfactor p obtained as afunction of particLe size.

Shear Stress on the Snow Surface
When wind blew over the particle bed and no saltation was initiated, we were able to evaluate the friction velocity u * using the equation

where u *, κ and Z 0 are the friction velocity, von Kármán's constant (usually 0.4) and roughness parameter, respectively.
In order to examine the validity of the drag plate, first we obtained the friction velocity u
* on the non-saltating bed with two different methods: direct measurement by using the drag meter 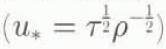 and computation from vertical wind-velocity profiles. In this experiment, the snow surface was left about 1 day after preparation to develop a sintering process between particles. A comparison of the two methods is shown in Figure 10. Very good agreement was found, particularly when the friction velocity was less than 0.5 m s −1.
Friction velocity measured with a drag meter and calculated from wind-velocity profile.

Figure 11 shows the friction velocity measured using the drag meter. Data are presented as a function of reference (free-stream) velocity u which was observed at the centre of the wind tunnel. Without snow saltation, friction velocity increased monotonically as the wind increased. On the other hand, when the saltation began with particles supplied by the snow feeder (Fig. 1) the friction velocity was observed to increase. Figure 12 shows an increase in the shear stress instead of the friction velocity. The increment also increased with wind velocity u and reached around 0.3 N m s −2 at u = 15 m s −1.
Friction velocity measured with a drag meter.  , no saltation;
 , saltation.

Shear-stress increase due to snow-particle saltation.  , measurement;
 , contribution of snow particles calculated with particle-trajectory statistics.

This experimental finding supports Reference OwenOwen's (1964) hypothesis that the saltation layer acts as an increased roughness to the flow above it and leads to an increase in the shear stress which has also been observed by Reference Nishimura and Hunt.Nishimura and Hunt (In press b) by using their pendulum-type drag plate. In the self-regulatory models of saltation, Reference McEwan and WillettsMcEwan and Willetts (1991, Reference McEwan and Willetts1993) calculated explicitly the grain-borne and fluid-shear stresses from particle trajectories and the gradient of the wind profile, respectively, rather than by subtraction from an assumed total shear stress. They showed in the simulation of sand that there had been an increase in the shear stress due to saltation by as much as 50%. The experimental findings in this study (Figs 11 and 12) seem to support their numerical results, qualitatively.
We can roughly estimate particle contribution to the shear stress τ p, with the following equation:

where G is the vertical flux per unit area of particles leaving the surface and < V 1I > and < V1E > are the mean horizontal components of impact and ejection velocities of snow particles. Using the values obtained in this study, the particle-borne shear stress τ p is also plotted in Figure 12. It clearly indicates that the increment of shear stress on the snow surface was mainly due to the effect of the impact of snow particles.
Computation of Particle Trajectories
The motion of a spherical particle in wind can be described by the following equations:


where u and w are the horizontal (x) and vertical (z) components of particle velocities, d is the particle diameter, ρa and ρ p are the densities of the air and particle respectively, g is the acceleration of gravity, U is the horizontal (x direction) wind speed and relative velocity V R is written as

Several papers give empirical expressions for the drag coefficient C d over a range of particle Reynold's number Re. We have used those given by Reference Morsi and AlexanderMorsi and Alexander (1972). Thus,

and

where υ is the kinematic viscosity of air. The effect of fluid lift and of the turbulent eddies are not taken into account because, when particle height is above a few grains (z ≫ d), the most significant forces acting on it are drag and gravity (Reference Nalpanis, Hunt and BarrettNalpanis and others, 1993). The wind speed U was assumed to decay with a logarithmic law as often found in a neutral condition (Equation (3)).
Thus, if initial conditions for the particle trajectory, which correspond to the ejection velocity and angle, are given, the motion of a saltating particle can be calculated numerically by these equations. Substituting the average ejection conditions obtained in this study, particle trajectories were calculated. Calculated variables of impact are shown in Figure 13. Simulated results agree roughly with the experimental ones; most results lie well within one standard deviation of the measured values. However, calculated results were much more sensitive to the friction velocity than the observed ones. The calculated αI and V I are larger than the measured ones, in general, possibly due to the velocity profile difference between actual and log profile; in reality, the wind profile in the saltation cloud is likely to be modified due to the particle drag (Reference Anderson and HaffAnderson and Haff, 1991).
Simulated and measured impact velocity VI and angle αI.  , compulations;
 , measurements with standard deviation.Simulated and measured impact velocity VI and angle αI. .

Mass-Flux Modelling
By substituting the measurements of the ejection velocity into the saltation model, vertical profiles of flux were estimated. The computing procedures were practically the same as those proposed by Reference Nalpanis, Hunt and BarrettNalpanis and others (1993). The study is composed of three parts: definition of particle source, trajectory modelling and counting of particles to obtain fluxes.
In this model, more than 5000 particles start to jump up from random positions in the test region which is chosen to be about four times as long as the mean saltation length. Their initial velocity distribution is determined from our experiments. Although there is wide scattering, we are able to recognize a negative correlation between ejection angle αE and velocity V E. The correlation and covariance between them were calculated and these values were applied to generate a two-dimensional joint-normal random-number distribution.
The trajectory model introduced above was used in the calculation. Trajectories were continued until the particle either passed through the “numerical traps” or impacted the surface. Numerical traps were set up to count particles passing a certain point at a given height. They were analogous to the physical traps used in conventional experiments and field measurements in which a vertical series of traps are placed at the dow n-wind end of a particle bed. Calculations were performed for the mean diameter of snow but size distribution was not taken into account.
Horizontal-flux profiles normalized on total horizontal flux are shown in Figure 14. The important point in these figures is that the exponential decay of the flux in height was obtained in all cases, and this supports the basic validity of this model. However, agreement is less than expected. At a higher level, the fluxes obtained experimentally are larger than our model would predict: the model predicts a faster decrease in flux with height than was observed. It is difficult to speculate on the reason for this discrepancy but there are some possible causes:
-
1. The distributions of ejection velocities and angles are not always the normal distribution as we supposed in the calculation but rather show a strongly skewed distribution. In fact, both two-dimensional joint log-normal and gamma distribution were also applied in the simulation (Reference Nishimura and Hunt.Nishimura and Hunt, In press a). However, little progress has been made.
-
2. Snow has a fairly wide size distribution but flux in the experiment was obtained by counting the particle number at fixed positions in the picture and multiplying the mean particle volume and density. The proportion of smaller particles in the higher levels is much larger than near the surface, as is clearly seen in Figure 7.
-
3. Wind modification, due to particle drag, was ignored in the calculation. This assumption can be reasonable as long as the particle concentration is not large but, with increasing u * the deviation from a log profile becomes significant.
Simulated and measured horizontal mass fluxes.  , computations;
 , measurement.

Acknowledgements
First, the authors are grateful to all of their colleagues who participated in the wind-tunnel experiments. Also, we gratefully acknowledge helpful suggestions and comments from J. Hunt in the U.K. Meteorological Office, M. Sorensen and K. R. Rasmussen, University of Aarhus, Denmark, and B. B. Willetts and I. K. McEwan, University of Aberdeen, Scotland. Thanks are also due lo R. Perkins and I. Emas, University of Cambridge, for valuable and helpful advice. One of the authors (K.N.) is grateful to the Japan Society for the Promotion of Science for partially funding his stay at the Department of Applied Mathematics and Theoretical Physics in the University of Cambridge, when some of this work was done.



