INTRODUCTION
Chagas disease is endemic in Latin America. Its aetiological agent is Trypanosoma cruzi, a haemoflagellate protozoan, whose life cycle involves vertebrate (mammals, including man) and invertebrate (triatomine bugs) hosts. The trypomastigote ingested by the insect differentiates into the proliferative epimastigote form that, on reaching the posterior intestine, differentiates to metacyclic trypomastigotes. This latter form, following invasion of vertebrate host cells, undergoes differentiation into amastigotes which, after several reproductive cycles, transform into trypomastigotes, the form responsible for the dissemination of the infection.
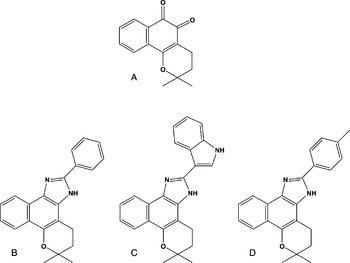
The current treatment of Chagas disease is unsatisfactory, depending only on 2 nitroheterocycles, nifurtimox and benznidazole. Although effective for acute infections, they may cause undesirable side effects, frequently leading to the abandonment of the treatment. Their efficacy during the chronic phase is still controversial with poor indices of apparent cure and a lack of consensus on when there is a parasitological cure (Jannin and Villa, Reference Jannin and Villa2007). Extensive efforts are being directed to the development of new chemotherapic agents for chagasic patients, especially in the chronic phase (Coura and De Castro, Reference Coura and De Castro2002). In a continued effort to use naturally occurring quinones, our group has been exploring the reactivity of quinoidal carbonyls towards nucleophilic reagents (Pinto et al. Reference Pinto, Menna-Barreto, De Castro and Govil2007). Within this framework, our group has investigated the trypanocidal activity of natural and semi-synthetic naphthoquinones, and among 60 compounds tested, 3 naphthoimidazoles, namely N1, N2 and N3 were selected based on their activity on bloodstream trypomastigotes (Pinto et al. Reference Pinto, Neves-Pinto, Pinto, Santa-Rita, Pezzella and De Castro1997; Neves-Pinto et al. Reference Neves-Pinto, Dantas, Moura, Emery, Polequevitch, Pinto, De Castro and Pinto2000; Moura et al. Reference Moura, Emery, Neves-Pinto, Pinto, Dantas, Salomão, De Castro and Pinto2001, Reference Moura, Salomão, Menna-Barreto, Emery, Pinto, Pinto and De Castro2004). These 3 compounds were synthesized from β-lapachone and contain, attached to the imidazole ring, the following aromatic groups, a phenyl in N1, a 3-indolyl in N2 and a p-methyl phenyl in N3. They were also active on epimastigotes and intracellular amastigotes of T. cruzi. In epimastigotes, they blocked the cell cycle, inhibited succinate cytochrome c reductase activity and led to ultrastructural damage in the mitochondrion, Golgi complex and reservosomes. Treatment of trypomastigotes led to alterations in the mitochondrion nucleus and kinetoplast, to blebbing of the plasma membrane and DNA fragmentation. In both forms of the parasite, pre-incubation with cysteine protease inhibitors reversed the effect of the naphthoimidazoles (Menna-Barreto et al. Reference Menna-Barreto, Henriques-Pons, Pinto, Morgado-Diaz, Soares and De Castro2005, Reference Menna-Barreto, Corrêa, Pinto, Soares and De Castro2007).
Programmed cell death (PCD) is well characterized in higher eukaryotes including apoptosis, autophagy and necrosis (Guimarães and Linden, Reference Guimarães and Linden2004). Apoptosis is a regulated process of self-killing without inflammatory response (Samuilov et al. Reference Samuilov, Oleskin and Lagunova2000). Apoptotic features include proteolytic cleavage by cysteine proteases, named caspases, cell shrinkage, DNA inter-nucleosomal fragmentation, phosphatidylserine exposure, blebbing of the plasma membrane, formation of apoptotic bodies and loss of mitochondrial membrane potential with cytochrome c release to the cytosol (Ricci and Zong, Reference Ricci and Zong2006). Autophagic cell death involves the autophagosomal-lysosomal system and is crucial to maintain the metabolic balance and the recycling of cellular structures during normal cell growth, and its deregulation leads to death (Bursch, Reference Bursch2001; Reggiori and Klionsky, Reference Reggiori and Klionsky2002). It is a complex signalling pathway involving 27 well-conserved proteins named Atgs (Levine and Yuan, Reference Levine and Yuan2005; Tsujimoto and Shimizu, Reference Tsujimoto and Shimizu2005). The formation of autophagic structures and the induction of cell death can be blocked by silencing the autophagy genes ATG7 and ATG6 (Baehrecke, Reference Baehrecke2005). Autophagic features include autophagosome formation, with the appearance of membranes surrounding organelles and cytosolic structures, without inflammatory response (Levine and Yuan, Reference Levine and Yuan2005). Necrosis, considered a synonym of cell death for many years, is a type of unexpected cell death, causing a strong tissue inflammatory response derived from environmental conditions. Necrotic features include mitochondrial damage, leading to ATP depletion, generation of reactive oxygen species culminating in the rupture of the plasma membrane (Zong and Thompson, Reference Zong and Thompson2006).
In unicellular organisms, the biological relevance of PCD pathways is under strong debate (Gordeeva et al. Reference Gordeeva, Labas and Zvyagilskaya2004; Besteiro et al. Reference Besteiro, Williams, Morrison, Coombs and Mottram2006). PCD has been studied in Leishmania spp., as well as in amitochondrial protozoa such as Entamoeba, Trichomonas and Giardia (Rodrigues and De Souza, Reference Rodrigues and De Souza2008). In protozoa, ‘apoptosis-like’ processes have been demonstrated, although their exact role in cell biology is still uncertain (Gordeeva et al. Reference Gordeeva, Labas and Zvyagilskaya2004). Autophagy is poorly understood in protozoan parasites; however, recent reports have shown that T. cruzi present all the most important genes of the Atg8 conjugation system (Atg3, Atg4, Atg7, Atg8), whereas Atg12, Atg5 and Atg10, as the major components of the Atg12 pathway, could not be identified (Alvarez et al. Reference Alvarez, Kosec, Sant'anna, Turk, Cazzulo and Turk2008a).
Recently, a strong functional and physiological relationship between the pathways of autophagy and apoptosis has been reported (Levine and Yuan, Reference Levine and Yuan2005). Morphological, biochemical and molecular evidence has strongly supported the hypothesis of cross-talking between all PCD pathways, suggesting the convergence of different mechanisms ending in cell death (Guimarães and Linden, Reference Guimarães and Linden2004). In T. cruzi, the regulation of these processes is poorly investigated, representing a critical point in the development of new therapeutic strategies (Nguewa et al. Reference Nguewa, Fuertes, Valladares, Alonso and Pérez2004). Mitochondrial damage and DNA fragmentation induced by N1, N2 and N3 led us to focus on the analysis of parasite death characteristics induced by these naphthoimidazoles.
MATERIALS AND METHODS
Synthesis of the naphthoimidazoles
The compounds were obtained from the reaction of β-lapachone with the aromatic aldehydes in the presence of ammonium acetate and acetic acid, as previously described (Pinto et al. Reference Pinto, Neves-Pinto, Pinto, Santa-Rita, Pezzella and De Castro1997), leading to 4,5-dihydro-6,6-dimethyl-6H-2-(phenyl)-pyran[b-4,3]naphth[1,2-d]imidazole) (N1), 4,5-dihydro-6,6-dimethyl-6H-2-(3′-indolyl)-pyran[b-4,3]naphth[1,2-d]imidazole (N2) and 4,5-dihydro-6,6-dimethyl-6H-2-(4′-methylphenyl)-pyran[b-4,3]naphth[1,2-d]imidazole) (N3) (Fig. 1).
Chemical structures of the naphthoimidazoles obtained from β-lapachone: (A) N1; (B) N2; (C) N3.

Parasites and treatment with the naphthoimidazoles
Epimastigote forms (Y strain) were maintained at 28°C in LIT medium and harvested during the exponential phase of growth. Bloodstream trypomastigotes (Y strain) were obtained from infected albino Swiss mice at the peak of parasitaemia. The parasites (5×10⁶ cells/ml) were treated with the naphthoimidazoles (10–40 μm) for 24 h in LIT medium at 28°C (epimastigotes) and RPMI at 37°C (trypomastigotes) (Menna-Barreto et al. Reference Menna-Barreto, Henriques-Pons, Pinto, Morgado-Diaz, Soares and De Castro2005, Reference Menna-Barreto, Corrêa, Pinto, Soares and De Castro2007).
Ultrastructural analysis
Treated parasites were processed for transmission electron microscopy as follows. After washing in phosphate-buffered saline (PBS), the parasites were fixed in 2·5% glutaraldehyde (40 min at room temperature) and post-fixed in a solution of 1% OsO4, 0·8% potassium ferricyanide and 2·5 mm CaCl2 (20 min at room temperature). The cells were dehydrated in an ascending acetone series and embedded in Poly/Bed 812 resin (Polysciences, Warrington, USA). Ultrathin sections were stained with uranyl acetate and lead citrate and examined in a Zeiss EM10C microscope (Oberkochen, Germany).
Flow cytometry analysis
After treatment, the parasites were incubated with 1 μg/ml annexin-V-FITC (AV) (Sigma-Aldrich, St Louis, USA) plus 10 μg/ml propidium iodide (PI) in an annexin-V binding buffer (50 mm HEPES, 700 mm NaCl, 12·5 mm CaCl2) for 15 min at 28°C for epimastigotes and 37°C for trypomastigotes. The positive control consisted of untreated parasites in the presence of 0·1% saponin. Data acquisition and analysis were performed using a FACSCalibur flow cytometer (Becton-Dickinson, San Jose, USA). A total of 10 000 events were acquired in the regions previously established as those corresponding to each form of T. cruzi.
Fluorescence microscopy analysis
After treatment, the parasites were washed and incubated with 100 μm monodansyl cadaverine (MDC) (Sigma-Aldrich) for 1 h at 28°C (epimastigotes) and 37°C (trypomastigotes). After fixation in 2% paraformaldehyde (40 min at room temperature), the analysis was performed in a Zeiss Axioplan microscope to quantify the percentage of parasites MDC+.
SDS-PAGE and Western blot analysis
After treatment, the parasites were washed, re-suspended in PBS with protease inhibitors (1 mm leupeptin, 100 mm PMSF, 1 mm pepstatin A, 100 mm EDTA) and then lysed by sonication, as previously reported (Menna-Barreto et al. Reference Menna-Barreto, Henriques-Pons, Pinto, Morgado-Diaz, Soares and De Castro2005). The total homogenate of epimastigotes was first centrifuged for 10 min at 200 g to discard cellular debris and then again for 10 min at 12 000 g to obtain the enriched mitochondrial (Mit) and supernatant (SN) fractions. For cytochrome c detection, 100 μg of protein of both Mit and SN were separated by electrophoresis on 15% SDS-PAGE and transferred onto nitrocellulose paper (Bio-Rad, Hercules, USA). The blots were incubated with blocking buffer containing 10% non-fat dry milk for 8 h at room temperature and then probed with rabbit anti-cytochrome c antibody (1:100, Santa Cruz Biotech, USA) for 1 h. After 2 rinses in blocking buffer for 20 min, each membrane was incubated with secondary antibody conjugated to horseradish peroxidase (1:10 000, Pierce Biotechnology, Rockford, USA) for 1 h.
RT-PCR analysis
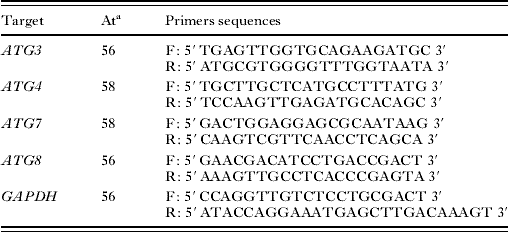
After treatment, epimastigotes (106 cells) were harvest and washed 3 times in PBS, centrifuged at 10 000 g. The supernatant was discarded and RNA was extracted from the pellet using the RNeasy kit (Quiagen, Düsseldorf, Germany). The reverse transcription was carried out by adding 200 pg of each RNA sample to the reaction mixture, following the manufacturer's instructions (Bio-Rad, Hercules, USA). For amplification of the desired cDNA, gene-specific primers were designed from sequencing data available in GeneDB data bank website (Table 1). PCR was carried out in an automatic DNA thermal cycler, model FTGENE5D (Techne Ltd, Cambridge, UK) in a final volume of 10 μl, with 1 ng target DNA, 5 pmol of each primer, 200 μm of each deoxyribonucleotide triphosphate (dNTP – Promega, Madison, USA), 0·8 units TaqDNA polymerase (Cenbiot RS) in a buffer containing 10 mm Tris-HCl, pH 8·5, 50 mm KCl, 1·5 mm MgCl2, as previously described (Magalhães et al. Reference Magalhães, Passos and Carvalho2004). The preparations were amplified using a PCR system consisting of 35 cycles of denaturation at 94°C for 1 min, primer annealing temperature (see Table 1) and extension at 72°C for 45 s. The PCR products were visualized on 8% silver-stained polyacrylamide gels. Band densitometry was determined by Image J software (NIH, GNU General Public License).
List of gene-specific primers for Trypanosoma cruzi ATG genes
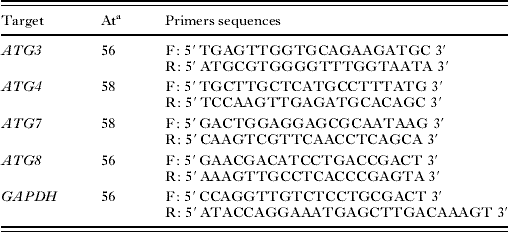
a Annealing temperature.
Metacaspases and PI3K inhibition analysis
Untreated parasites were incubated for 2 h with the inhibitors zVAD.fmk (100 mm, Promega, Madison, USA), wortmannin (100 nm, Sigma-Aldrich) or 3-methyladenine (10 mm, Sigma-Aldrich). After washing, the parasites were treated with the naphthoimidazoles for 24 h. Cell quantification was performed using a Neubauer chamber.
Statistical analysis
The comparison between control and treated groups was performed by the Mann-Whitney test. Differences with P⩽0·05 were considered as statistically significant.
RESULTS
Identification of cell death phenotypes in treated parasites
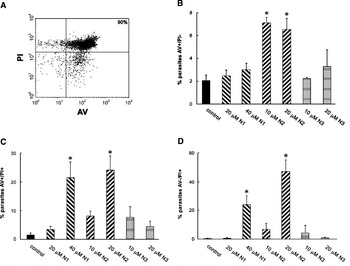
Different techniques were employed in order to discriminate the phenotypes of cell death in T. cruzi treated with naphthoimidazoles. Flow cytometry data of AV and PI labelling of trypomastigotes showed 3 distinct populations (AV+/PI−, AV+/PI+ and AV−/PI+). N1 led to an increase in AV+/PI+ and AV−/PI+ populations, N2 increased the 3 populations, being the only compound leading to PS exposure (AV+/PI−), while N3 showed no difference in relation to untreated trypomastigotes (Fig. 2). Treatment of epimastigotes did not induce labelling with AV or PI (data not shown).
Annexin V and propidium iodide labelling in Trypanosoma cruzi trypomastigotes after treatment with the naphthoimidazoles for 24 h. (A) Dot plot of parasites incubated with saponin (positive control). (B–D) Phenotypes: (B) AV+/ PI−, (C) AV+/ PI+ and (D) AV−/ PI+. Data represent the mean±standard deviation of at least 3 independent experiments. Asterisks indicate significant differences in relation to control group (P⩽0·05).

As one of the characteristics of apoptotic death, we investigated the release of mitochondrial cytochrome c to the cytosol by Western blot. The cytochrome c band was observed in mitochondrial-enriched fractions in control, N1- and N2-treated epimastigotes (Fig. 3). The treatment with N3 induced the release of the molecule to the cytosol, as observed by the band detection in N3 cytosolic fractions (Fig. 3).
Release of cytochrome c induced by treatment of Trypanosoma cruzi epimastigotes. Immunoblot analysis revealed the presence of cytochrome c in N3-treated cytosolic fraction. Mit, mitochondrial fraction; SN, supernatant fraction.

Morphological characterization of cell death phenotypes in treated parasites
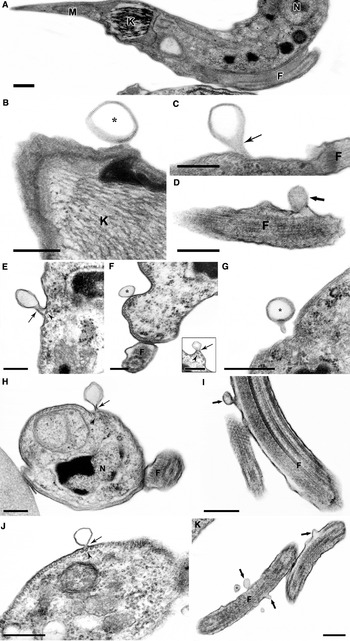
Besides damage to several organelles, the naphthoimidazoles induced in trypomastigotes, but not in epimastigotes, blebbing of the plasma membrane (Menna-Barreto et al. Reference Menna-Barreto, Henriques-Pons, Pinto, Morgado-Diaz, Soares and De Castro2005). In the present work, further ultrastructural analysis was performed and a variety of alterations were documented, including constriction without depolymerization of subpellicular microtubules, formation of blebs and of vesicles in close contact with the trypomastigote body and flagellum (Fig. 4). Semi-quantitative analysis revealed about 40–70% cells presenting blebs (50–250 nm), while in untreated cells this percentage dropped to about 2%. No plasma membrane alteration was observed in treated epimastigotes.
Naphthoimidazoles induce plasma membrane alterations in Trypanosoma cruzi trypomastigotes. (A) Control parasite presenting typical morphology, with absence of membrane blebbing or shed vesicles. Nucleus (N), kinetoplast (K), mitochondrion (M) and flagellum (F). (B–J) Treatment with 20 μm N1 (B–D), 10 μm N2 (E–J) or 10 μm (J, K) N3. Formation and shedding of vesicles (*) was observed at the plasma (thin arrows) and flagellar (thick arrows) membranes. Plasma membrane constrictions (thin arrows) indicate sites of vesicle pinching off, without subpellicular microtubules (arrowheads) depolymerization. Bars=0·25 μm.

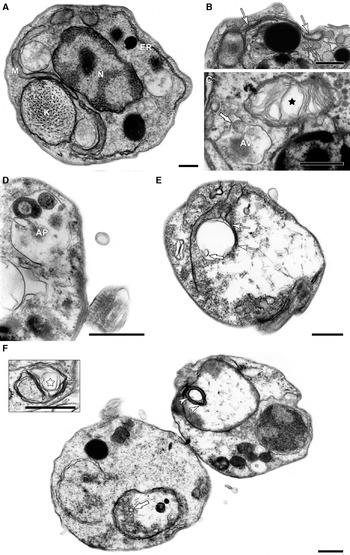
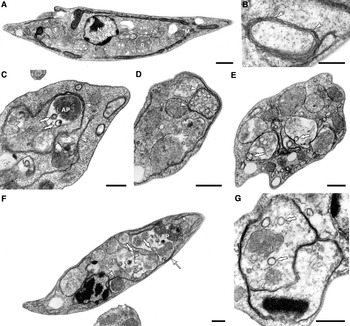
In both parasite forms, the naphthoimidazoles led to the formation of concentric membranes, of autophagosomes with loss of matrix electron density and of endoplasmic reticulum profiles surrounding different structures (Figs 5 and 6). In treated trypomastigotes myelin-like structures were observed (Fig. 5). In N2-treated epimastigotes the appearance of autophagic structures was also detected (Fig. 6).
Naphthoimidazoles induce autophagic phenotype in Trypanosoma cruzi trypomastigotes. (A) Control parasite showing typical morphology of the nucleus (N), kinetoplast (K), mitochondrion (M) and endoplasmic reticulum (ER). Parasites treated with (B, C) 20 μm N1, (D) 10 μm N2 and (E, F) 10 μm N3 resulted in morphological alterations such as cytoplasmic myelin-like figures (black star in (C); inset in (F) and autophagosomes (AP) containing cellular residues (C, D) or vesicles (F, white thick arrow). Endoplasmic reticulum profiles were frequently observed close to these vacuoles. Mitochondrial swelling also occurred, with the presence of inner concentric membrane structures (E, F). Bars=0·5 μm.

Naphthoimidazoles induce autophagic phenotype in Trypanosoma cruzi epimastigotes. (A) Untreated parasite showing the typical morphology. Nucleus (N), kinetoplast (K), mitochondrion (M) and reservosomes (R). Parasites treated with (B) 40 μm N1, (C–E) 20 μm N2 and (F, G) 20 μm N3 presented concentric membrane structures (white arrowheads) and autophagosomes (AP) appear with different degrees of loss of matrix content (C–F), with occasional formation of inner vesicles (white thick arrows). Endoplasmic reticulum profiles surround reservosomes (white arrows) and cytoplasmic vesicles (white asterisk) were also observed. Bars=0·5 μm.

Evaluation of autophagy induced by the naphthoimidazoles
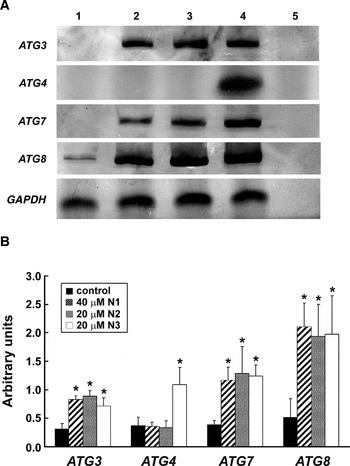
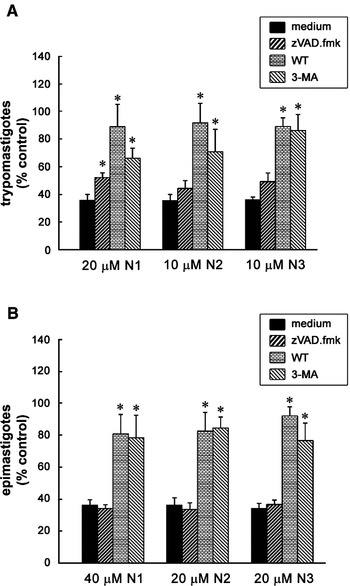
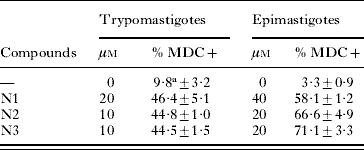
Fluorescence microscopy revealed an increase of MDC-labelling in treated parasites. In trypomastigotes, the treatment with N1, N2 and N3 increased the percentage of MDC+ parasites from 9·8±3·2% to about 45% and in epimastigotes from 3·3±0·9 to about 60% (Table 2). RT-PCR analysis demonstrated over-expression of autophagic genes ATG3, ATG7 and ATG8 in epimastigotes treated with the 3 naphthoimidazoles, with transcript levels being increased 2·5- to 4-fold higher than in control parasites (Fig. 7). An important increase in ATG4 transcripts (3·5-fold) was also detected in N3-treated parasites. The pre-incubation of trypomastigotes and epimastigotes with wortmannin or 3-methyladenine reversed the trypanocidal effect of the naphthoimidazoles, while with zVAD.fmk there was no alteration in the percentage of parasites (Fig. 8). The three inhibitors per se did not interfere with the number of parasites.
Naphthoimidazoles induce the over-expression of ATG genes in Trypanosoma cruzi epimastigotes. (A) RT-PCR analysis of (1) control, (2) 40 μm N1, (3) 20 μm N2 and (4) 20 μm N3 showed the increase in ATG transcripts in treated parasites. The reaction-negative controls are also displayed (5) and GAPDH was performed as loading control. (B) Semi-quantification by densitometry of the bands normalized by the GAPDH controls. Asterisks indicate significant differences in relation to control group (P⩽0·05).

Pre-incubation of N1, N2 and N3-treated (A) trypomastigotes and (B) epimastigotes with inhibitors zVAD.fmk (pancaspase inhibitor), WT and 3-MA (autophagy inhibitors). Data represent the mean±standard deviation of at least 4 independent experiments. Asterisks indicate significant differences in relation to control group (P⩽0·05).

Formation of autophagosomes in Trypanosoma cruzi trypomastigotes and epimastigotes treated with the naphthoimidazoles
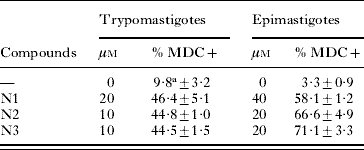
a Data represent the mean±standard deviation of at least 3 independent experiments.
DISCUSSION
Many efforts have been made to identify different types of PCD in parasitic protozoa (Rodrigues and De Souza, Reference Rodrigues and De Souza2008). It was previously described that naphthoimidazoles induce a strong DNA fragmentation in trypomastigotes, detected by the increase in percentage of TUNEL-positive parasites and by total DNA electrophoresis. Such an effect was not observed in epimastigotes, suggesting a different response to the compounds between the two forms of T. cruzi. Aiming to discriminate the cell death phenotypes in naphthoimidazole-treated parasites, ultrastructural, fluorescent microscopy, flow cytometry, Western blot and RT-PCR techniques were employed. It is important to note that the treatment of the parasite was performed at concentrations below the corresponding IC50/24 h that were in the range of 30 to 80 μm for epimastigotes and 12 to 40 μm for trypomastigotes (Menna-Barreto et al. Reference Menna-Barreto, Henriques-Pons, Pinto, Morgado-Diaz, Soares and De Castro2005, Reference Menna-Barreto, Corrêa, Pinto, Soares and De Castro2007).
In mammals, the ‘flopping’ of phosphatidylserine (PS) to the outer leaflet is one of the early hallmarks of apoptosis (Van den Eijinde et al. Reference Van den Eijnde, Boshart, Baehrecke, De Zeeuw, Reutelingsperger and Vermeij-Keers1998). Previous studies with Leishmania donovani and T. cruzi treated with different drugs also revealed an increase in PS exposure, suggesting an apoptosis-like phenomenon (Paris et al. Reference Paris, Loiseau, Bories and Breard2004; Deolindo et al. Reference Deolindo, Teixeira-Ferreira, Melo, Arnholdt, Souza, Alves and Damatta2005; De Souza et al. Reference De Souza, Menna-Barreto, Araújo-Jorge, Kumar, Hu, Boykin and Soeiro2006; Verma et al. Reference Verma, Singh and Dey2007). However, it was also suggested that trypanosomatids expose PS naturally, not associated with a cell death feature (Damatta et al. Reference Damatta, Seabra, Deolindo, Arnholdt, Manhães, Goldenberg and De Souza2007; Wanderley et al. Reference Wanderley, Moreira, Benjamin, Bonomo and Barcinski2006). In trypomastigotes only N2 led to an increase in the AV+/PI− population. With both N1- and N2-treated trypomastigotes, the appearance of an AV+/PI+ population representative of necrosis was observed. Interestingly, an increase in the AV−/PI+ population was detected for N1 and N2. Such populations were previously described as predominant after treatment of tumour cells with ascorbate plus menadione and are characteristic of autoschizis, a type of necrosis characterized by exaggerated membrane damage, progressive loss of organelle-free cytoplasm through self-excisions (autoschizic bodies), DNA fragmentation and no caspase activation (Jamison et al. Reference Jamison, Gilloteaux, Neal and Summers1999, Reference Jamison, Gilloteaux, Taper, Calderon and Summers2002).
Morphological data showed bleb formation throughout the plasma membrane of treated trypomastigotes. Interestingly, membrane shedding happens without subpellicular microtubule depolymerization, leading to the appearance of extracellular vesicles. Such structures were reported in mammal cells as apoptotic or autoschizic bodies; however, they need to be further investigated in T. cruzi by subfractionation and biochemical techniques. Nevertheless, none of these 3 populations (AV+/PI−, AV+/PI+ and AV−/PI+) were detected in epimastigotes treated with the 3 naphthoimidazoles or in N3-treated trypomastigotes, motivating us to analyse other cell death parameters that could occur concomitantly in these parasites.
During apoptosis in multicellular organisms, 2 biochemical events have to be considered, caspase activation and mitochondrial cytochrome c release into the cytosol (Chai et al. Reference Chai, Du, Wu, Kyin, Wang and Shi2000; Gordeeva et al. Reference Gordeeva, Labas and Zvyagilskaya2004). By Western blot, a cytochrome c band was detected in the cytosolic fraction of N3-treated epimastigotes. A similar phenomenon was induced by novobiocin and miltefosine in L. donovani promastigotes (Singh et al. Reference Singh, Jayanarayan and Dey2005; Verma et al. Reference Verma, Singh and Dey2007). Caspase homologues, termed metacaspases, have been identified in trypanosomatids, including T. cruzi (Kosec et al. Reference Kosec, Alvarez, Agüero, Sánchez, Dolinar, Turk, Turk and Cazzulo2006). The effect of the naphthoimidazoles on trypomastigotes and epimastigotes was not prevented by pre-incubation with the pancaspase inhibitor zVAD.fmk. Likewise, studies concerning the autoproteolytic properties of metacaspases in T. brucei are still not conclusive (Helms et al. Reference Helms, Ambit, Appleton, Tetley, Coombs and Mottram2006).
Autophagy is a self-degradation process presented in eukaryotes, implicated in the removal and/or remodelling of damaged cellular structures. Its molecular regulation is phylogenetically conserved, in the form of ATG genes found in unicellular and multicellular organisms (Yorimitsu and Klionsky, Reference Klionsky2007). In non-apoptotic death, autophagy acts as an alternative mechanism, despite its participation during cellular survival strategies. The loss of balance between cell survival and death, usually derived from nutrient deprivation, leads to autophagic cell death in many species (Lockshin and Zakeri, Reference Lockshin and Zakeri2002; Baehrecke, Reference Baehrecke2005). In yeast and mammals, autophagosome formation involves the assembly of a pre-autophagosomal structure (PAS), close to endoplasmic reticulum cisternae, suggesting the organelle's involvement in PAS biogenesis (Klionsky, Reference Klionsky2007; Yotimitsu and Klionsky, Reference Klionsky2007).
Ultrastructural analysis suggested an autophagic phenotype in T. cruzi trypomastigotes and epimastigotes treated with naphthoimidazoles. Morphological characteristics such as the appearance of concentric membrane structures and autophagosomes were commonly observed in treated parasites. Autophagosome-like structures surrounded by endoplasmic reticulum profiles were also detected. The treatment of T. cruzi with the three naphthoimidazoles also induced a strong increase of MDC-labelling, a common autophagic marker, and consequently in the percentage of parasites contained in autophagic vacuoles.
In total, 27 ATG genes have been identified in Saccharomyces cerevisiae, and many orthologues are presented in other eukaryotic cells (Klionsky et al. Reference Klionsky, Cregg, Dunn, Emr, Sakai, Sandoval, Sibirny, Subramani, Thumm, Veenhuis and Ohsumi2003). In trypanosomatids, the complete Atg8 conjugation system including Atg3, Atg4, Atg7 and Atg8 was observed, but part of the Atg12-Atg5 system is lacking (Alvarez et al. Reference Alvarez, Kosec, Sant'anna, Turk, Cazzulo and Turk2008a; Herman et al. Reference Herman, Gillies, Michels and Rigden2006). Functionality analysis showed that TcAtg4 was involved in the proteolysis of TcAtg8 localized in autophagosomal membranes (Alvarez et al. Reference Alvarez, Kosec, Sant'anna, Turk, Cazzulo and Turk2008b). Our data indicate that Atg3, Atg4, Atg7 and Atg8 participate in the autophagic process triggered by N1, N2 and N3; however, the detailed pathway and proteins involved have to be further investigated.
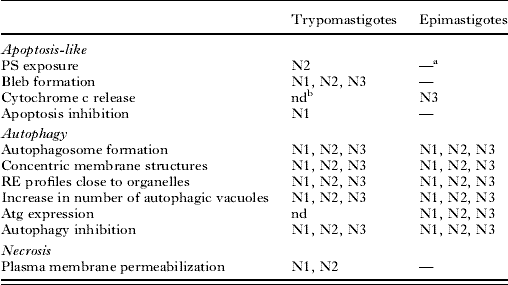
The naphthoimidazole effect on T. cruzi was blocked by E64 and calpain I inhibitor, as already shown (Menna-Barreto et al. Reference Menna-Barreto, Corrêa, Pinto, Soares and De Castro2007), suggesting the participation of calpain in an autophagic process as in mammalian models (Codogno and Meijer, Reference Codogno and Meijer2006). Calpain I inhibitor also prevented the effect of miltefosine in L. donovani (Paris et al. Reference Paris, Loiseau, Bories and Breard2004). It is well-known that autophagic cell death can be inhibited by suppressing autophagosome formation with autophagic inhibitors, such as WT and 3-MA (Klionsky et al. Reference Klionsky, Cregg, Dunn, Emr, Sakai, Sandoval, Sibirny, Subramani, Thumm, Veenhuis and Ohsumi2003; Levine and Yuan, Reference Levine and Yuan2005). The pre-incubation of epimastigotes and trypomastigotes with these two autophagic inhibitors abolished the effect of the naphthoimidazoles. Our data suggested that the endoplasmic reticulum provides membrane for PAS formation, as previously reported (Klionsky et al. Reference Klionsky, Cregg, Dunn, Emr, Sakai, Sandoval, Sibirny, Subramani, Thumm, Veenhuis and Ohsumi2003). The engulfment of cellular structures by PAS gives rise to autophagosomes through an Atg-dependent process. Taken together, our results propose autophagy as the predominant phenotype induced by the naphthoimidazoles in epimastigotes and trypomastigotes (Table 3). However, some other cell death features can also be observed. Ultrastructural evidence in T. cruzi treated with different classes of chemotherapeutic agents, including naphthoimidazoles, led to a similar morphological pattern, supporting the hypothesis of a distinct interplay of death mechanisms (Menna-Barreto et al. Reference Menna-Barreto, Salomão, Dantas, Santa-Rita, Soares, Barbosa and De Castro2009). These and other advances in the understanding of protozoan programmed cell death (PCD) will help develop new therapeutic strategies, providing information about how to kill the parasites silently, without alerting the host defences (Nguewa et al. Reference Nguewa, Fuertes, Valladares, Alonso and Pérez2004). Moreover, PCD in protozoa is still controversial (Gordeeva et al. Reference Gordeeva, Labas and Zvyagilskaya2004) and further studies in proteomics are needed in order to understand the molecules involved and their interaction, with the aim of characterizing the death processes in protozoan parasites.
Features of Trypanosoma cruzi cell death induced by naphthoimidazoles
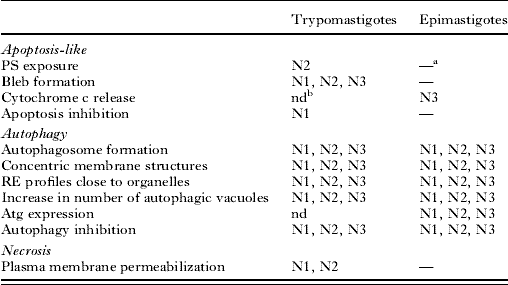
a Not detected.
b nd, not determined.
This work was supported by grants from CNPq, DECIT/SCTIE/MS, FIOCRUZ and PensaRio/FAPERJ. The authors are also very thankful to Marcos Meuser and Priscila Lemos for excellent technical work and to Francisco Lopes, Maria do Carmo Pinto and Kelly Moura for the chemical synthesis.