





Introduction
Impaired control over alcohol use, reflected in unsuccessful attempts to cut down drinking despite adverse consequences, is a core diagnostic feature of alcohol use disorder (AUD) in the Diagnostic and Statistical Manual of Mental Disorders (5th ed.; DSM-5; American Psychiatric Association, 2013). However, the mechanisms underlying this loss of control remain poorly understood. A prominent mechanistic account proposes that repeated alcohol use drives a shift from goal-directed to habitual control, reducing sensitivity to action-outcome contingencies (Everitt & Robbins, Reference Everitt and Robbins2005, Reference Everitt and Robbins2016; Lüscher, Robbins, & Everitt, Reference Lüscher, Robbins and Everitt2020).
Goal-directed actions rely on action-outcome knowledge and the current outcome value, whereas habitual actions are driven by stimulus–response learning and persist despite changes in contingency or outcome value (Balleine & Dickinson, Reference Balleine and Dickinson1998; Dolan & Dayan, Reference Dolan and Dayan2013). While the proposed transition toward habitual responding after repeated alcohol exposure has been shown in animal models (e.g. Corbit, Nie, & Janak, Reference Corbit, Nie and Janak2012; Dickinson, Wood, & Smith, Reference Dickinson, Wood and Smith2002; for review, see Giannone et al., Reference Giannone, Ebrahimi, Endrass, Hansson, Schlagenhauf and Sommer2024), evidence in humans remains mixed (Doñamayor et al., Reference Doñamayor, Ebrahimi, Arndt, Weiss, Schlagenhauf and Endrass2022). Some studies report reduced goal-directed or model-based control in individuals with AUD or binge drinking (Doñamayor et al., Reference Doñamayor, Strelchuk, Baek, Banca and Voon2018; Sebold et al., Reference Sebold, Deserno, Nebe, Schad, Garbusow, Hägele, Keller, Jünger, Kathmann, Smolka, Rapp, Schlagenhauf, Heinz and Huys2014; Sjoerds et al., Reference Sjoerds, de Wit, van den Brink, Robbins, Beekman, Penninx and Veltman2013), whereas others find no evidence for blunted goal-directed control in abstinent individuals with AUD or risky drinkers (Nebe et al., Reference Nebe, Kroemer, Schad, Bernhardt, Sebold, Müller, Scholl, Kuitunen-Paul, Heinz, Rapp, Huys and Smolka2018; Sebold et al., Reference Sebold, Nebe, Garbusow, Guggenmos, Schad, Beck, Kuitunen-Paul, Sommer, Frank, Neu, Zimmermann, Rapp, Smolka, Huys, Schlagenhauf and Heinz2017; van Timmeren et al., Reference van Timmeren, Quail, Balleine, Geurts, Goudriaan and van Holst2020; Voon et al., Reference Voon, Derbyshire, Rück, Irvine, Worbe, Enander, Schreiber, Gillan, Fineberg, Sahakian, Robbins, Harrison, Wood, Daw, Dayan, Grant and Bullmore2015). Transdiagnostic research further suggests that trait compulsivity may better account for individual differences in goal-directed control than alcohol use alone (Gillan et al., Reference Gillan, Kosinski, Whelan, Phelps and Daw2016; Patzelt, Kool, Millner, & Gershman, Reference Patzelt, Kool, Millner and Gershman2019). Taken together, findings remain inconsistent across studies, likely reflecting substantial heterogeneity in paradigms, outcome measures, and populations.
The contingency degradation paradigm offers a translational approach for examining goal-directed responding by manipulating action-outcome contingencies independently of outcome value (Balleine & Dickinson, Reference Balleine and Dickinson1998). Humans show robust contingency sensitivity in this task (Liljeholm, Tricomi, O’Doherty, & Balleine, Reference Liljeholm, Tricomi, O’Doherty and Balleine2011; O’Callaghan et al., Reference O’Callaghan, Vaghi, Brummerloh, Cardinal and Robbins2019), but it has rarely been used in clinical populations – and, crucially, no study to date has examined sensitivity to contingency degradation as a measure of goal-directed control in individuals with AUD (Doñamayor et al., Reference Doñamayor, Ebrahimi, Arndt, Weiss, Schlagenhauf and Endrass2022; Giannone et al., Reference Giannone, Ebrahimi, Endrass, Hansson, Schlagenhauf and Sommer2024). Moreover, most human paradigms use monetary or point rewards, instead of substance-related reinforcers in animal work. Recent translational accounts, however, suggest that impairments in goal-directed control in AUD may only be observable in the presence of alcohol-related cues and contexts (Giannone et al., Reference Giannone, Ebrahimi, Endrass, Hansson, Schlagenhauf and Sommer2024; van Timmeren et al., Reference van Timmeren, Quail, Balleine, Geurts, Goudriaan and van Holst2020), underscoring the importance of disorder-relevant reinforcers.
Here, we adapted a free-operant contingency degradation paradigm of O’Callaghan et al. (Reference O’Callaghan, Vaghi, Brummerloh, Cardinal and Robbins2019) to directly compare instrumental responding for an alcohol versus a juice reinforcer in individuals with AUD and healthy control participants (HC). Juice served as a natural, non-drug reinforcer, whereas alcohol constituted a disorder-relevant conditioned reinforcer administered at non-intoxicating doses. This design allowed us to test whether sensitivity to action-outcome contingencies is altered in individuals with AUD and whether such alterations are reinforcer-specific. We hypothesized (1) that individuals with AUD would show reduced goal-directed control, expressed as diminished behavioral adjustments and attenuated causality judgments in response to contingency degradation relative to HC participants, and (2) that these impairments would be more pronounced when instrumental responding was reinforced by alcohol rather than juice.
Methods
Participants
A total of 106 individuals were recruited from the general population via public advertisement at Charité – Universitätsmedizin Berlin as part of the Collaborative Research Centre 265 (CRC 265; Heinz et al., Reference Heinz, Kiefer, Smolka, Endrass, Beste, Beck, Liu, Genauck, Romund, Banaschewski, Bermpohl, Deserno, Dolan, Durstewitz, Ebner-Priemer, Flor, Hansson, Heim, Spanagel and Kiebel2020; Spanagel et al., Reference Spanagel, Bach, Banaschewski, Beck, Bermpohl, Bernardi, Beste, Deserno, Durstewitz, Ebner-Priemer, Endrass, Ersche, Feld, Gerchen, Gerlach, Goschke, Hansson, Heim, Kiebel and Heinz2024). Recruitment focused on individuals reporting regular alcohol use and alcohol-related problems; only non-treatment-seeking individuals were included. General inclusion criteria were age 18–49 years and sufficient German language skills. AUD diagnoses were assessed on-site using the German version of the Structured Clinical Interview for DSM-5 (SCID-5; Beesdo-Baum, Zaudig, & Wittchen, Reference Beesdo-Baum, Zaudig and Wittchen2019) by trained staff. Exclusion criteria comprised current or past severe psychiatric disorders (including psychotic or bipolar disorders, current severe major depressive episodes, or borderline personality disorder), alcohol-related withdrawal symptoms or clinical indication for detoxification, major neurological disorders or severe traumatic brain injury, current pregnancy or breastfeeding, current substance use disorders other than alcohol, nicotine, or cannabis, and recent use of centrally acting medication prior to assessment.
Two participants were excluded prior to analysis due to missing taste-rating data. Task-related exclusion criteria were (1) a taste rating ≤ 0.5 for either reinforcer type or (2) a taste-rating difference > 0.4 between alcohol and juice, with ratings obtained on a pleasantness scale (0–1, higher values indicating greater liking). Applying these criteria, 20 participants were excluded due to low taste ratings. In addition, three participants were excluded due to incomplete task data, resulting in a final sample of 81 participants for analysis: 49 participants with AUD (M = 31.22 years, SD = 8.35, range 18–49, 28 female/21 male) and 32 HC participants (M = 27.44 years, SD = 6.71, range 19–49, 22 female/10 male). All participants provided written informed consent and received €10/hour compensation. The study was approved by the ethics committee of Charité – Universitätsmedizin Berlin (EA2/028/19).
Experimental task
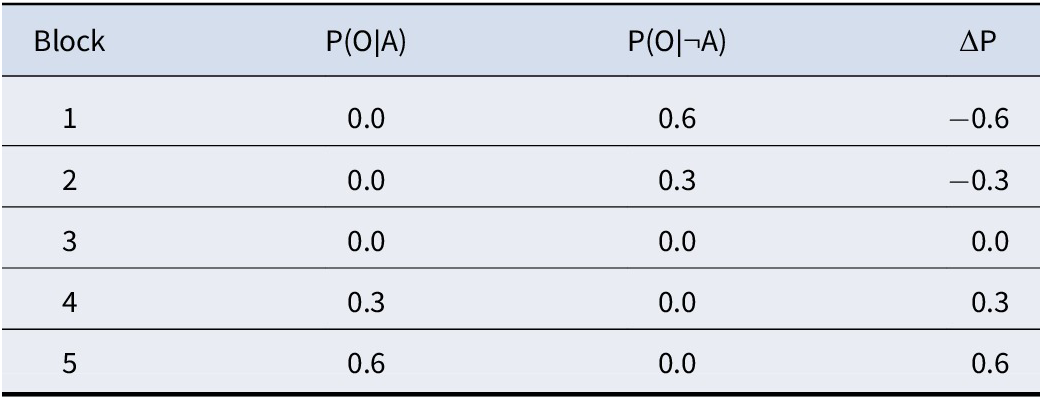
Participants performed a free-operant contingency degradation task assessing sensitivity to instrumental action-outcome contingencies, based on an established paradigm (O’Callaghan et al., Reference O’Callaghan, Vaghi, Brummerloh, Cardinal and Robbins2019). The task manipulated two conditional probabilities: the probability of an outcome following an action, P(O∣A), and the probability of an outcome following no action, P(O∣¬A). Instrumental contingency was defined as ΔP = P(O∣A) − P(O∣¬A), such that positive values indicate that actions increase outcome likelihood, values near zero indicate no causal influence of action, and negative values indicate negative instrumental contingency, where actions reduce outcome likelihood (Hammond, Reference Hammond1980).
Alcohol and juice reinforcers were used in two separate conditions to contrast contingency learning for an addiction-relevant versus a natural, non-alcohol reward. Participants were instructed that they were operating either a ‘bar machine’ (alcohol condition) or a ‘juice machine’ (juice condition), and that pressing the button might trigger outcome delivery, that outcomes might also occur without pressing, or that pressing could reduce or have no influence on outcome delivery, with these relationships varying between blocks. Participants were encouraged to freely explore these relationships within each block (detailed instructions in the Supplementary Material). Each condition comprised five blocks with different instrumental contingencies (ΔP across −0.6 to +0.6; see Table 1), resulting in a total of 10 blocks. Block order within each reinforcer condition was pseudorandomized via a Latin-square design. Each block consisted of 60 consecutive bins of approximately 1 s. Within each bin, participants could perform multiple button presses or withhold responding, but only the first press within each bin was registered. At the end of each 1-s bin, an outcome was probabilistically determined and delivered according to the block-specific P(O∣A) and P(O∣¬A), without any explicit indication of bin boundaries to participants. Reinforcer delivery was paired with visual and auditory cues and administered using a syringe pump (0.5 ml per outcome; ≈0.5-s delivery at 60 ml/min), followed by a fixed 3-s ingestion interval during which participants were instructed to hold and swallow the sip, after which the task continued immediately with the next bin. The overall task structure, reinforcer conditions, and exemplary timing are illustrated in Figure 1.
Programmed instrumental contingency values (ΔP)

Table 1. Long description
The table consists of four columns and five rows of data.
Column headers are: Block, P ( O | A ), P ( O | not A ), and Delta P.
* Block 1: P ( O | A ) is 0.0, P ( O | not A ) is 0.6, and Delta P is minus 0.6.
* Block 2: P ( O | A ) is 0.0, P ( O | not A ) is 0.3, and Delta P is minus 0.3.
* Block 3: P ( O | A ) is 0.0, P ( O | not A ) is 0.0, and Delta P is 0.0.
* Block 4: P ( O | A ) is 0.3, P ( O | not A ) is 0.0, and Delta P is 0.3.
* Block 5: P ( O | A ) is 0.6, P ( O | not A ) is 0.0, and Delta P is 0.6.
Note: P ( O | A ) represents the probability of an outcome given an action. P ( O | not A ) represents the probability of an outcome given no action. Delta P represents the instrumental contingency.
Note: P(O∣A), probability of an outcome given an action; P(O∣¬A), probability of an outcome given no action; ΔP, instrumental contingency. Each reinforcer condition (alcohol, juice) included all five contingency blocks (10 total). Block order was counterbalanced across participants.
Underlying structure of the contingency degradation paradigm. (a) Alcohol reinforcer condition and (b) juice reinforcer condition. Participants viewed either a ‘bar-machine’ or ‘juice-machine’ and could freely choose to press or withhold responding at their own pace. Unbeknownst to participants, task time was segmented into consecutive 1-s bins. At the end of each bin, a single outcome decision (reward vs no reward) was made probabilistically according to the programmed action- and no-action outcome probabilities, P(O∣A) and P(O∣¬A), which jointly determined the instrumental contingency ΔP. Reinforcer delivery was accompanied by visual and auditory cues and administered as 0.5-ml sips via a syringe pump system. (c) Single-block example. Each block consisted of 60 consecutive 1-s bins (only a subset shown). Within each bin, multiple button presses were permitted, but only whether at least one press occurred within the bin was relevant for outcome determination. After each bin, outcomes (0.5 ml; ≈0.5-s delivery) were delivered with probability P(O∣A) or P(O∣¬A), accompanied by visual reinforcer cues and followed by a fixed 3-s ingestion interval. Reward delivery and ingestion time extended the overall block duration but did not add additional response bins. Contingencies were learned continuously across bins within blocks. After each block, pleasantness ratings and subjective contingency judgments (one example shown) were obtained before the next block began.

Figure 1. Long description
The diagram is divided into three horizontal sections labeled A, B, and C.
Panel A shows the alcohol reinforcer condition. On the left, a bar-machine sits on a wooden table. Two blue arrows point to boxes labeled Action and No Action. From these boxes, two more arrows labeled p(O vertical bar A) and p(O vertical bar tilde A) point to a second image of the machine where a wine glass is filled with liquid. To the right is a red syringe pump labeled 0.5 ml.
Panel B shows the juice reinforcer condition with a similar layout. It features a juice-machine on the left. Arrows lead through Action and No Action boxes to a second image where a glass of orange juice appears. A red syringe pump labeled 0.5 ml is on the far right.
Panel C illustrates a single-block timeline. A horizontal sequence of boxes represents 1 s bins. Below the bins, hand icons indicate button presses. Above the bins, icons of wine glasses represent reward delivery. Three specific events are highlighted:
* Contingent reward: A wine glass appears above a 3 s ingestion bin following a button press.
* Response not rewarded: A button press occurs but no reward follows.
* Non-contingent reward: A wine glass appears above a 3 s ingestion bin without a preceding button press.
To the right of the timeline are two horizontal rating scales. The top scale is for Pleasantness rating, ranging from 0 to 100. The bottom scale is for Causality judgement, ranging from -100 to 100.
We obtained two measures of sensitivity to changes in ΔP. Behavioral ΔP sensitivity was indexed by response rate per block, defined as the proportion of 1-s bins containing at least one press (i.e. presses per second, capped at 1/s). Subjective ΔP sensitivity was assessed after each block with three visual analogue scale ratings: (1) frequency of reward after button pressing, (2) frequency of reward without button pressing, and (3) the perceived causal influence of button presses. Ratings were obtained on 0–1 scales and analyzed on this original scale. This paradigm thus operationalizes goal-directed control both as behavioral adjustment to changing contingencies (response rates) and as the ability to explicitly express contingency knowledge (subjective causality judgements), allowing a dissociation between action control and explicit knowledge. In addition, participants rated the pleasantness of the delivered outcomes during a pre-task tasting, at baseline and after each block, providing an index of experienced reinforcer value across learning. Ratings were obtained on visual analogue scales (0–1). Exact wording for all rating scales is provided in the Supplementary Materials.
Experimental procedure
Participants were screened by a telephone interview and instructed to abstain from alcohol and other psychoactive substances (except nicotine) for 24 h prior to the on-site appointment. Upon arrival, sobriety was verified via breath alcohol testing (BAC = 0.00%). Participants then completed the SCID-5 (Beesdo-Baum et al., Reference Beesdo-Baum, Zaudig and Wittchen2019) and psychometric questionnaires.
Before performing the task, participants tasted and rated several alcoholic beverages (10% v/v ethanol) and juices on visual analogue scales regarding their pleasantness. For each person, the highest-rated alcoholic beverage and a preference-matched juice (difference ≤ 0.4) were selected as reinforcers (for details on tasting procedure, see Supplementary Material). During the subsequent task, participants could obtain up to 144 outcomes per reinforcer condition under an optimal response policy, corresponding to 72 ml total beverage volume and approximately 5.68 g ethanol (< 0.5 standard drinks; World Health Organization, 2018). The task was implemented in PsychoPy version 2022.2.0 (Peirce et al., Reference Peirce, Gray, Simpson, MacAskill, Höchenberger, Sogo, Kastman and Lindeløv2019).
Data analysis
Analyses were conducted in R version 4.3.3 (R Core Team, 2024). All tests were two-tailed and evaluated at a significance level of α = .05. To account for the hierarchical structure of the data, linear mixed-effects models (LMMs) were estimated with restricted maximum likelihood using the lme4 (Bates, Mächler, Bolker, & Walker, Reference Bates, Mächler, Bolker and Walker2015) and lmerTest packages (Kuznetsova, Brockhoff, & Christensen, Reference Kuznetsova, Brockhoff and Christensen2017). Following Barr (Reference Barr2013), maximal random-effects structures were specified and only simplified if models failed to converge. Significance tests relied on Satterthwaite’s approximation for degrees of freedom as implemented in the lmerTest package (Kuznetsova et al., Reference Kuznetsova, Brockhoff and Christensen2017), and 95% profile likelihood confidence intervals for fixed effects were computed using lme4 (Bates et al., Reference Bates, Mächler, Bolker and Walker2015). For significant interaction effects involving continuous predictors, follow-up simple-slope analyses based on estimated marginal trends were conducted using the emmeans package (Lenth & Piaskowski, Reference Lenth and Piaskowski2025). Marginal (for fixed effects only) and conditional (for fixed and random effects) R2 were computed and are reported in the Supplementary Material (Nakagawa & Schielzeth, Reference Nakagawa and Schielzeth2013). Reinforcer type (juice = −0.5, alcohol = 0.5) and group (HC = −0.5, AUD = 0.5) were effect coded.
As a first step, pleasantness ratings (rescaled to 0–1) were examined to rule out baseline group or reinforcer differences which might confound subsequent analyses of contingency learning. Pleasantness ratings were predicted by timepoint (coded 0 = pre-task tasting, 1 = baseline, 2–6 = task blocks), reinforcer type, group, and age, including all interactions among timepoint, reinforcer type, and group, with random intercept and random slopes for timepoint and reinforcer type per participant.
In a second step, behavioral sensitivity to instrumental contingencies was assessed by modeling response rates per block as a function of ΔP, reinforcer type, group, and age, including all interactions among ΔP, reinforcer type, and group. Random slopes for ΔP, reinforcer type, and their interaction were specified. To further assess behavioral sensitivity to contingency, a post hoc ratio-score analysis was conducted following Vaghi et al. (Reference Vaghi, Cardinal, Apergis-Schoute, Fineberg, Sule and Robbins2019), adapted to the present task structure. Unlike classical outcome-degradation procedures, the ratio score indexed sensitivity to reductions in contingency strength rather than outcome degradation per se.
Two contrasts were examined: (1) ΔP = 0.6 versus ΔP = 0.3 (partial degradation) and (2) ΔP = 0.6 versus ΔP = 0.0 (full degradation). For each contrast, R denoted the total number of button presses per block. Ratio scores were computed as:

Scores approaching 1 indicate greater responding under higher contingency, reflecting sensitivity to contingency reduction and goal-directed control. Scores near 0.5 indicate comparable responding across contingency levels, consistent with contingency-insensitive responding. Reinforcer conditions (alcohol versus juice) were compared across groups using paired-sample t-tests.
Two control analyses supplemented the primary response rate model: (1) block order and its interactions with reinforcer type and ΔP (including the three-way interaction) were added as fixed effects to account for possible effects of block order; (2) the model was re-estimated in participants with high overall response rates (top quartile, n = 21) to examine whether contingency sensitivity was preserved at elevated levels of responding.
The stability of contingency sensitivity was assessed using odd-even split-half reliability (Pronk, Molenaar, Wiers, & Murre, Reference Pronk, Molenaar, Wiers and Murre2022) on individual ΔP slopes, using a permuted approach (5,000 iterations, stratified by participant × reinforcer type × ΔP level) with Spearman–Brown correction.
Subjective sensitivity to instrumental contingencies was assessed by modelling explicit contingency judgments as a function of the same fixed effects used in the behavioral contingency analysis. In addition, a model including a quadratic ΔP term was estimated; however, this did not improve model fit, and the more parsimonious linear model is reported (see Supplementary Model Fit Indices). Because the LMM with a random intercept showed a singular fit, a linear model without random effects was estimated. Both approaches yielded the same pattern of fixed effects, confirming robustness.
The relationship between explicit contingency knowledge and behavior was examined in an additional LMM predicting response rates from causality judgments. Full model specifications and results are reported in the Supplementary Material.
To rule out pleasantness differences as a confound, all primary models were re-estimated with mean pleasantness per reinforcer type (averaged across timepoints, z-standardized) as a fixed-effect covariate. Robustness to the taste-based inclusion criterion was further examined by re-estimating behavioral and subjective contingency models in the full sample.
Model assumptions were assessed via the DHARMa residual diagnostics package (Hartig, Reference Hartig2025), checks for homoscedasticity, and influence analyses conducted with the influence.ME package (Nieuwenhuis, Grotenhuis, & Pelzer, Reference Nieuwenhuis, Grotenhuis and Pelzer2012). Following recommendations by Field and Wilcox (Reference Field and Wilcox2017) robust mixed-effects models were additionally fitted using the robustlmm package (Koller, Reference Koller2016); see Supplementary Material for details.
A preprint of this work has been made publicly available on PsyArXiv (Bode et al., Reference Bode, Musial, Ebrahimi, Grundmann, Krasniqi, Sebold, Endrass and Schlagenhauf2026).
Results
Sample characteristics
Groups differed significantly in age, with participants in the AUD group being older (M = 31.22 years, SD = 8.35) than HC participants (M = 27.44 years, SD = 6.71; t (75.54) = −2.25, p = .027). Sex distribution did not differ significantly between groups (χ2 (1) = 0.67, p = .414). Full descriptive statistics are provided in Table 2.
Sample characteristics of the alcohol use disorder and healthy control groups

Table 2. Long description
The table consists of five columns: Variable, A U D (n = 49), H C (n = 32), Statistic, and p.
* Age (M plus or minus S D, range; years): A U D is 31.22 plus or minus 8.35, 18–49; H C is 27.44 plus or minus 6.71, 19–49; t (75.54) = -2.25; p = .027.
* Sex (f/m/d; n): A U D is 28/21/0; H C is 22/10/0; chi-squared (1) = 0.67; p = .414.
* A U D criteria (M plus or minus S D, range): A U D is 3.73 plus or minus 1.70, 2–9; H C is 0.25 plus or minus 0.44, 0–1; t (57.49) = -13.72; p < .001.
* A U D I T (M plus or minus S D, range): A U D is 13.40 plus or minus 5.60, 4–24; H C is 4.78 plus or minus 2.81, 1–13; t (73.37) = -9.07; p < .001.
* P S S-10 (M plus or minus S D, range): A U D is 16.1 plus or minus 7.17, 4–37; H C is 12 plus or minus 6.87, 2–23; t (37.53) = -2.08; p = .044.
* Smoker (yes/no; n): A U D is 18/30; H C is 7/21; chi-squared (1) = 1.31; p = .252.
Note: All t-tests are Welch’s unequal-variance tests. AUD criteria according to the DSM-5 (American Psychiatric Association, 2013); AUDIT, ‘AUD Identification Test’ (Saunders et al., Reference Saunders, Aasland, Babor, de la Fuente and Grant1993); PSS-10, ‘Perceived Stress Scale’ (Cohen, Kamarck, & Mermelstein, Reference Cohen, Kamarck and Mermelstein1983).
a PSS-10 data available for n = 38 AUD and n = 19 HC only.
*p < .05, **p < .01, ***p < .001.
Pleasantness ratings
Subjective pleasantness ratings were lower for alcohol than juice (β = −0.05, SE = 0.02, t(131.57) = −2.48, 95% CI [−0.09, −0.01], p = .014) and declined significantly across time (β = −0.02, SE = 0.004, t(82.11) = −4.53, 95% CI [−0.02, −0.01], p < .001). A significant timepoint × reinforcer type interaction was observed (β = −0.03, SE = 0.003, t(855.38) = −9.59, 95% CI [−0.04, −0.03], p < .001). Follow-up simple-slope analyses confirmed that pleasantness declined across time for alcohol (slope = −0.03, SE = 0.004, 95% CI [−0.04, −0.02]) but not for juice (slope = −0.0007, SE = 0.004, 95% CI [−0.01, 0.01]). No significant main or interaction effects with group were observed. Results are shown in Figure 2; full LMM outputs in Supplementary Table S1.
Pleasantness ratings (0–1 scale; mean ± SE) for juice and alcohol reinforcers across seven timepoints (pre-task, six task blocks), displayed separately for healthy control participants (HC) and individuals with alcohol use disorder (AUD). Ratings reflect averaged visual analogue scale responses; error bars show standard errors of the mean.

Figure 2. Long description
The figure consists of two side-by-side line graphs. Both graphs share a y-axis labeled Pleasantness rating ranging from 0.4 to 1.0 and an x-axis labeled Timepoint ranging from 0 to 6. A legend at the bottom indicates teal circles for Juice and yellow circles for Alcohol.
Left Panel (H C):
* Juice ratings remain relatively stable and high, fluctuating between 0.8 and 0.84 across all timepoints.
* Alcohol ratings start at approximately 0.77 at timepoint 0 and show a steady linear decrease to approximately 0.53 at timepoint 6.
Right Panel (A U D):
* Juice ratings start at 0.75 at timepoint 0, rise to 0.8 at timepoint 1, and then gradually decline to approximately 0.74 by timepoint 6.
* Alcohol ratings start at 0.76 at timepoint 0 and show a downward trend similar to the H C group, ending at approximately 0.57 at timepoint 6.
In both panels, error bars representing S E are visible for each data point, with the Alcohol group showing larger error bars at later timepoints compared to the Juice group.
Behavioral contingency sensitivity
Participants adapted their response rates to the programmed contingencies, as indicated by a significant main effect of ΔP (β = 0.14, SE = 0.03, t(79.00) = 5.38, 95% CI [0.09, 0.19], p < .001). No main effects of reinforcer type or group were observed. A significant ΔP × reinforcer type interaction was present (β = −0.07, SE = 0.03, t(79.00) = −2.54, 95% CI [−0.13, −0.02], p = .013). Follow-up simple-slope analyses showed that response rates increased with ΔP for juice (slope = 0.14, SE = 0.03, 95% CI [0.09, 0.19]), but not for alcohol (slope = 0.07, SE = 0.03, 95% CI [0.0005, 0.13]). Results are illustrated in Figure 3a, with full LMM outputs reported in Supplementary Table S2.
Contingency learning and explicit knowledge. Panel a shows response rates, defined as the proportion of 1-s bins containing at least one press (i.e. presses per second, capped at 1/s), across instrumental contingencies (ΔP), separately for healthy control participants (HC) and individuals with alcohol use disorder (AUD), and for the two reinforcers (juice, alcohol taste). Panel b shows causality judgements across the same ΔP values. In Panels a and b, color indicates reinforcer and points represent means, with error bars indicating SE.

Figure 3. Long description
A multi-panel figure with four line graphs arranged in a two-by-two grid.
Top row, Panel A, Response rate.
The y-axis represents Response rate from 0.1 to 0.5. The x-axis represents Delta P with values minus 0.6, minus 0.3, 0.0, 0.3, and 0.6.
Left graph (H C): The teal line (Juice) shows a steady linear increase from 0.22 to 0.39. The yellow line (Alcohol) starts higher at 0.29, dips at minus 0.3, then increases to 0.35.
Right graph (A U D): The teal line shows a linear increase from 0.24 to 0.39. The yellow line shows a more erratic pattern, dipping significantly at 0.0 before rising to 0.32.
Bottom row, Panel B, Causality judgements.
The y-axis represents Causality judgements from minus 0.8 to 0.4. The x-axis represents Delta P with the same values as Panel A.
Left graph (H C): Both lines show a strong positive linear correlation. The yellow line (Alcohol) rises more steeply between 0.0 and 0.3 compared to the teal line (Juice).
Right graph (A U D): Both lines are nearly identical, showing a sharp, consistent linear increase from minus 0.7 at Delta P minus 0.6 to 0.5 at Delta P 0.6.
A legend at the bottom indicates teal points for Juice and yellow points for Alcohol. All points include vertical error bars representing S E.
Including block order did not improve model fit or alter results; the ΔP effect and ΔP × reinforcer type interaction also remained significant in high responders (n = 21; see Supplementary Control Analyses).
An additional post hoc ratio-score analysis confirmed this pattern for the contrast between ΔP = 0.6 and ΔP =0.3. Across groups, ratio scores were lower for alcohol (M = 0.51, SD = 0.13) than for juice (M = 0.56, SD = 0.13), with a paired-sample comparison showing a significant difference (t (80) = −2.36, p = .021, 95% CI [−0.08, −0.01], d = −0.26). For the contrast between ΔP = 0.6 and ΔP = 0.0, ratio scores did not differ significantly between alcohol (M = 0.58, SD = 0.15) and juice (M = 0.59, SD = 0.14; t (80) = −0.87, p = .388, 95% CI [−0.06, 0.02], d = −0.10; for visualization see Supplementary Material S1). These findings suggest that responding for alcohol was less contingency-sensitive, as indicated by reduced adaptation under partial degradation (ΔP = 0.6 versus ΔP =0.3). This difference was not observed under full degradation (ΔP = 0.6 versus ΔP = 0.0), suggesting that the reinforcer effect may be most apparent when outcome contingencies were lower but not eliminated.
Split-half reliability of individual ΔP slopes was high for both juice (r_SB = .95) and alcohol (r_SB = .96), supporting construct stability of behavioral contingency sensitivity across blocks.
Subjective contingency sensitivity
Causality judgments closely tracked the programmed instrumental contingencies, as indicated by a significant main effect of ΔP (β = 1.07, SE = 0.04, t(801) = 29.32, 95% CI [1.00, 1.14], p < .001). No main effects of reinforcer type or group, and no ΔP × reinforcer type interaction were observed. However, a significant ΔP × group interaction was present (β = 0.23, SE = 0.07, t(801) = 3.18, 95% CI [0.09, 0.37], p = .002). ΔP was positively associated with causality judgments in both groups, with a steeper slope in participants with AUD (slope = 1.19, SE = 0.05, 95% CI [1.10, 1.28]) compared to healthy control participants (slope = 0.95, SE = 0.06, 95% CI [0.84, 1.06]). Results are shown in Figure 3b, with full LMM outputs available in Supplementary Table S4.
A mixed-effects model relating subjective contingency knowledge to behavioral contingency sensitivity is reported in Supplementary Table S6 and illustrated in Supplementary Figure S2.
Control analyses
Robust mixed-effects models reproduced the fixed effects pattern across all outcome variables (Supplementary Tables S8–S11). Including mean pleasantness per reinforcer type as a covariate neither improved model fit nor altered fixed effects (see Supplementary Control Analyses and see Supplementary Tables S3, S5, and S7). The behavioral contingency and subjective contingency models were additionally re-estimated in the full sample; effects of interest remained unchanged, confirming robustness of findings to the taste-based inclusion criterion (see Supplementary Control Analyses). Response rates across ΔP levels for the taste-excluded subsample are shown descriptively in Supplementary Figure S3.
Discussion
In the present study, we examined goal-directed control in individuals with AUD using a contingency degradation paradigm with disorder-specific and natural reinforcers (alcohol versus juice). Contrary to our hypotheses, individuals with AUD showed no reduction in contingency sensitivity compared to healthy control individuals, neither across reinforcer conditions nor when responding for alcohol versus juice. Instead, a reinforcer-specific pattern was observed across groups, such that behavioral contingency sensitivity was reduced when responding for alcohol reinforcers. In contrast to this behavioral pattern, explicit causality judgments indicated preserved contingency tracking across both reinforcer types and groups, with individuals with AUD showing even stronger contingency sensitivity than healthy control individuals, arguing against impaired instrumental knowledge as an explanation. Finally, although alcohol taste was rated as less pleasant over time than juice in both groups, the contingency sensitivity effects remained unchanged when controlling for pleasantness.
While our findings do not support habit accounts of AUD suggesting a generalized impairment of goal-directed control and a shift toward habitual control (Everitt & Robbins, Reference Everitt and Robbins2005, Reference Everitt and Robbins2016; Lüscher et al., Reference Lüscher, Robbins and Everitt2020), they are largely consistent with the existing human literature. Although some studies report reduced goal-directed or model-based control in AUD or heavy-drinking samples (Doñamayor et al., Reference Doñamayor, Strelchuk, Baek, Banca and Voon2018; Sebold et al., Reference Sebold, Deserno, Nebe, Schad, Garbusow, Hägele, Keller, Jünger, Kathmann, Smolka, Rapp, Schlagenhauf, Heinz and Huys2014; Sjoerds et al., Reference Sjoerds, de Wit, van den Brink, Robbins, Beekman, Penninx and Veltman2013), others have observed no reduction in goal-directed control at the group level, even in alcohol-dependent or recently detoxified individuals (Nebe et al., Reference Nebe, Kroemer, Schad, Bernhardt, Sebold, Müller, Scholl, Kuitunen-Paul, Heinz, Rapp, Huys and Smolka2018; Sebold et al., Reference Sebold, Nebe, Garbusow, Guggenmos, Schad, Beck, Kuitunen-Paul, Sommer, Frank, Neu, Zimmermann, Rapp, Smolka, Huys, Schlagenhauf and Heinz2017; van Timmeren et al., Reference van Timmeren, Quail, Balleine, Geurts, Goudriaan and van Holst2020; Voon et al., Reference Voon, Derbyshire, Rück, Irvine, Worbe, Enander, Schreiber, Gillan, Fineberg, Sahakian, Robbins, Harrison, Wood, Daw, Dayan, Grant and Bullmore2015). From this perspective, the lack of reduced goal-directed control in our sample with AUD is not necessarily surprising, particularly as it comprised non-treatment-seeking individuals with predominantly mild-to-moderate AUD.
Importantly, our data revealed a different and, to our knowledge, novel pattern. Rather than a diagnosis-dependent deficit, we observed a reinforcer-specific attenuation of goal-directed control when alcohol served as the reinforcer, present across individuals with AUD and HC individuals alike. Notably, the HC group was not alcohol-naïve but comprised social drinkers. Contingency sensitivity was intact in the juice condition within the same individuals and task framing, arguing against generalized performance differences or global impairments in goal-directed control as an alternative explanation. These findings provide the first direct evidence that alcohol-specific reductions in goal-directed control may already be observed at earlier stages of alcohol use. They suggest that alcohol-related contexts can modulate goal-directed control even when overall behavioral control capacities remain intact, in line with accounts emphasizing the contextual and motivational flexibility of goal-directed control (Giannone et al., Reference Giannone, Ebrahimi, Endrass, Hansson, Schlagenhauf and Sommer2024; Patzelt et al., Reference Patzelt, Kool, Millner and Gershman2019). At the same time, the present task design constrains the interpretation of these findings. Unlike classical rodent procedures, which induce habitual responding through excessive overtraining of stable action-outcome contingencies (Balleine & Dickinson, Reference Balleine and Dickinson1998; Dickinson et al., Reference Dickinson, Balleine, Watt, Gonzalez and Boakes1995), the present task required participants to continuously update action-outcome associations across blocks, including negative contingency conditions in which responding actively reduced reward probability. This task is therefore better suited to measure goal-directed control rather than habit expression (Balleine & O‘Doherty, Reference Balleine and O‘Doherty2010; Molinero et al., Reference Molinero, Martínez-López, Morís, Quintero, Cobos, López and Luque2025). The alcohol-specific attenuation of goal-directed responding observed here may be interpreted as a context-dependent reduction of goal-directed control rather than increased habitual responding.
One plausible explanation for this effect is a shared reinforcement history with alcohol. Prior work has demonstrated that repeated alcohol use is sufficient to establish strengthened stimulus – response and stimulus-outcome associations, as well as attentional and approach biases, even in social drinkers (Field & Cox, Reference Field and Cox2008; Jones, Rose, Cole, & Field, Reference Jones, Rose, Cole and Field2013). In the present task, alcohol reinforcers were embedded in an explicitly bar-like context, which likely activated alcohol-related expectations in both groups and shifted responding toward reduced engagement of goal-directed response policies. Animal work additionally demonstrates that alcohol-reinforced responding is preferentially resistant to outcome devaluation compared to food rewards, even in non-dependent animals receiving non-intoxicating doses, suggesting that alcohol’s reinforcing properties may be sufficient to attenuate goal-directed control independently of diagnosis (Dickinson et al., Reference Dickinson, Wood and Smith2002), and that alcohol-paired contexts reduce sensitivity to contingency changes specifically (Giannone et al., Reference Giannone, Ebrahimi, Endrass, Hansson, Schlagenhauf and Sommer2024; Ostlund, Maidment, & Balleine, Reference Ostlund, Maidment and Balleine2010) – directly paralleling the current paradigm. The present findings may therefore reflect a human analogue of such context-driven effects.
More broadly, contemporary accounts conceptualize that goal-directed and habit-like responding do not reflect fixed modes, but a dynamically shifting balance between control processes, shaped by reinforcement history and modulated by specific cues and task demands (Giannone et al., Reference Giannone, Ebrahimi, Endrass, Hansson, Schlagenhauf and Sommer2024). Reinforcer and task contexts may thus modulate not only action selection but the extent to which goal-directed control is engaged. From a control-theoretic perspective, goal-directed control is engaged only when its expected benefits outweigh its subjective costs, such as effort, uncertainty, or cognitive demand (Eder & Dignath, Reference Eder and Dignath2019). In the present task, uncertainty introduced by partial contingency degradation likely reduced the expected value of exerting goal-directed control and, in combination with alcohol-related contextual cues, shifted behavior toward less contingency-sensitive adaptation even in individuals with intact goal-directed capacities. From this perspective, the observed effect does not require advanced stages of AUD but can arise whenever alcohol-related cues and uncertainty jointly lower the utility of goal-directed regulation. While context-dependent reductions in goal-directed control may be adaptive in many situations, alcohol-related cues may render goal-directed control less reliable and increase the influence of automatic response tendencies. Contextual factors such as stress may similarly modulate goal-directed control and warrant future investigation, given associations between acute and chronic stress and alterations in goal-directed control (Radenbach et al., Reference Radenbach, Reiter, Engert, Sjoerds, Villringer, Heinze, Deserno and Schlagenhauf2015), and evidence of differential effects in AUD versus HC individuals (Wyckmans et al., Reference Wyckmans, Chatard, Kornreich, Gruson, Jaafari and Noël2024).
Consistent with this interpretation, the observed reinforcer effect further aligns with accounts of cue-driven automaticity rather than classic overtrained habits. Pavlovian alcohol cues are known to influence instrumental responding even when outcome-value updating remains intact, producing behavior that arises through motivational capture (Garbusow et al., Reference Garbusow, Schad, Sebold, Friedel, Bernhardt, Koch, Huys, Steinacher, Kathmann, Geurts, Sommer, Müller, Nebe, Paul, Wittchen, Zimmermann, Walter, Smolka, Sterzer and Heinz2016; Hogarth & Chase, Reference Hogarth and Chase2012). Incentive-sensitization theory offers one explanatory framework, proposing that repeated alcohol use enhances cue-triggered ‘wanting’ independently of experienced ‘liking’ (Robinson & Berridge, Reference Robinson and Berridge1993, Reference Robinson and Berridge2001). Alcohol reinforcer pleasantness declined over time across groups in the present study, while behavioral contingency-sensitive adaptation was selectively reduced for alcohol compared to juice reinforcer. This dissociation suggests that behavior in alcohol contexts may be increasingly driven by cue-triggered motivational processes rather than by current outcome value potentially constituting a vulnerability factor for problematic drinking even in social drinkers.
Several methodological considerations qualify the interpretation of the present findings. First, the healthy control group was not alcohol-naïve. Although the inclusion of a juice reinforcer condition allowed us to demonstrate reinforcer specificity within the task, the absence of an alcohol-naïve control group limits conclusions about whether alcohol-specific effects reflect a consequence of repeated alcohol exposure or are relevant for the development of AUD. Future studies including alcohol-naïve participants or longitudinal designs will be necessary to disentangle these possibilities. Second, the AUD sample predominantly comprised individuals with mild-to-moderate severity who were not seeking treatment, limiting generalization to more severe or chronic AUD and likely restricting the range of severity necessary to detect moderation effects. Future work with more heterogeneous samples could additionally examine moderation by individual differences in stress reactivity, craving, and reinforcement history. Third, explicit craving ratings were not collected; although controlling for pleasantness did not alter main effects, craving ratings would have provided a more direct measure of motivational and satiety effects. Finally, although both reinforcers were delivered in small volumes unlikely to produce pharmacologically meaningful or calorie-driven post-ingestive effects (Tellez et al., Reference Tellez, Ren, Han, Medina, Ferreira, Yeckel and de Araujo2013), differences in the primary reinforcing properties of juice and alcohol at these doses cannot be fully excluded and should be addressed in future work.
The present findings support a dynamic, context-dependent view of goal-directed control in alcohol use. Across groups, individuals retained the capacity to track instrumental contingencies, yet behavioral contingency sensitivity was selectively attenuated when alcohol served as the reinforcer, particularly under partial contingency degradation. Rather than indicating a generalized reduction in goal-directed control in AUD, these findings suggest that goal-directed control is context-dependent and behavior is less contingency-sensitive in alcohol-related contexts despite intact instrumental knowledge. By demonstrating alcohol-specific reductions in goal-directed control in both individuals with AUD and social drinkers, the present findings suggest that reduced goal-directed control in alcohol contexts may emerge as a consequence of repeated alcohol use independent of AUD diagnosis. Understanding how these context-dependent changes in goal-directed control contribute to AUD development will be important for refining mechanistic accounts of addiction and identifying targets for interventions.
Supplementary material
The supplementary material for this article can be found at http://doi.org/10.1017/S0033291726106278.
Data availability statement
The analysis code is accessible at github.com/agschlagenhauf/ConDeg_B01.git; behavioral data is available from the corresponding author upon request.
Acknowledgments
We thank Diana S. Prychynenko for her assistance with programming the experimental task and supporting data collection. We are also grateful to Anna Berglöf, Carlotta Dörfler, and Alexander Krickl for their help with data collection. Finally, we sincerely thank all participants for taking part in the study.
During manuscript preparation, the authors used Claude Sonnet 4.5 to assist with language editing and grammar checking, and to review analysis code for potential errors. AI assistance was limited to editorial support and code review and was not used to generate scientific content, develop ideas, or analyze data. All AI-generated suggestions were carefully reviewed by the authors, who verified their accuracy and take full responsibility for the final content, including all code and analyses.
Author contribution
Conceptualization: C.E., T.E., F. S.; Formal analysis: E.L.B., building on initial script development by M.P.M.M. and C.E.; Methodology and Data collection: E.L.B., M.P.M.M., C.E.; Supervision: T.E., F.S.; Writing – original draft: E.L.B.; Writing – review and editing: E.L.B., M.P.M.M., C.E., C.C.G, S.K., M.S., T.E., F.S.
Funding statement
This research was funded by the German Research Foundation (DFG) within the Collaborative Research Center 265 (project no. 402170461, awarded to T.E. and F.S.).
Competing interests
The authors have nothing to disclose.
Ethical standards
The study was in line with the principles of the Declaration of Helsinki. Ethics approval was granted by the ethics committee of Charité – Universitätsmedizin Berlin (EA2/028/19).


 Open access

