Introduction
Soil organic carbon (SOC) plays a vital role in the carbon (C) cycle of paddy ecosystems and the maintenance of soil quality in agroecosystems (Balesdent et al., Reference Balesdent, Basile-Doelsch, Chadoeuf, Cornu, Derrien, Fekiacova and Hatté2018). Meanwhile, SOC change can be used as an important indicator to evaluate variation in soil quality because SOC is tightly associated with the biogeochemical cycles of most major nutrients and provides energy and substrates for microbial activities (Li et al., Reference Li, Zhang, Pu, Li, Xu, Jia, Deing and Gong2016). A higher SOC content can improve soil quality and represents a substantial contribution to the reduction of C emissions via C sequestration (Plaza-Bonilla et al., Reference Plaza-Bonilla, Álvaro-Fuentes and Cantero-Martínez2014). Therefore, it is beneficial to maintain soil quality and improvement of soil productivity by increasing SOC content.
Labile organic carbon (LOC) is necessary for providing nutrient elements and energy for plant growth and microbial metabolism by its quick decomposition (Liu et al., Reference Liu, Yan, Mei, Zhang and Fan2013; Li et al., Reference Li, Wen, Li, Li, Yang, Lin, Song, Gooper and Zhao2018). In recent years, many studies have focused on changes of total SOC content under different field management conditions (Zhang et al., Reference Zhang, Zhuang, Zhao, He, Yu, Shi and Xing2016; Han et al., Reference Han, Wiesmeier, Conant, Kühnel, Sun, Kögel-Knabner, Hou, Cong, Liang and Ouyang2018). However, information is still scarce about the effects of different crop systems, tillage and fertilizer practices on SOC content and soil LOC fractions, such as cumulative carbon mineralization (Cmin), permanganate oxidizable carbon (KMnO4-C), dissolved organic carbon (DOC), particulate organic carbon (POC), light fraction organic carbon (LFOC) and microbial biomass carbon (MBC) (Sheng et al., Reference Sheng, Zhou, Zhang, Kuzyakov, Zhou, Ge and Wang2015). Many researchers have analysed how SOC content and its labile fractions are changed under different fertilizer management conditions, which has been used extensively to assess soil fertility under long-term fertilizer regime (Luan et al., Reference Luan, Gao, Huang, Tang, Li, Zhang and Chen2019; Nazia et al., Reference Nazia, Liang, Huang, Wang, Xu, Li, Gao and Zhang2019). Soil Cmin have been shown to increase with the application of organic manure nitrogen (N) input practices (Haynes, Reference Haynes2005; Tang et al., Reference Tang, Xiao, Tang, Li, Wang, Li, Cheng and Pan2018). Some results have indicated that POC and LFOC contents were higher with organic manure N input management than with inorganic N fertilizer practices (Fortuna et al., Reference Fortuna, Harwood and Paul2003; Nissen and Wander, Reference Nissen and Wander2003). Long-term addition of organic matter N (organic manure or crop residue) to soils has been demonstrated to increase soil DOC and soil MBC contents (Xu et al., Reference Xu, Lou, Sun, Wang, Baniyamuddin and Zhao2011; Liu et al., Reference Liu, Yan, Mei, Zhang and Fan2013). Permanganate oxidizable carbon-C has been considered as an early, sensitive indicator for the impacts of organic manure application or inorganic N input management on changes of the active SOC fraction (Xu et al., Reference Xu, Lou, Sun, Wang, Baniyamuddin and Zhao2011).
Soil carbon management index (CMI) has been used as an index to express the effects of different types of field management on the SOC pool and C sequestration. The soil CMI provides a way to measure the rate of soil C dynamics in an agroecosystem compared with a more stable reference soil (Blair et al., Reference Blair, Lefroy and Lisle1995). The value of soil CMI is affected by different land-use types, tillage, crop residue and fertilizer regime (Brar et al., Reference Brar, Singh, Dheri and Kumar2013; Chaudhary et al., Reference Chaudhary, Dheri and Brar2017; Tang et al., Reference Tang, Xiao, Tang, Li, Wang, Li, Cheng and Pan2018). Some results indicate that SOC lability (L), lability index (LI), carbon pool index (CPI), soil CMI and SOC stocks with organic manure and crop residue N input treatments are higher than those with chemical fertilizer and no organic manure N input (Li et al., Reference Li, Wen, Li, Li, Yang, Lin, Song, Gooper and Zhao2018; Tang et al., Reference Tang, Xiao, Tang, Li, Wang, Li, Cheng and Pan2018). Therefore, soil CMI is used as an indicator to assess the potential of organic manure N addition and crop residue N incorporation to improve soil quality and thus optimizing practices that slow down soil degradation (Xu et al., Reference Xu, Lou, Sun, Wang, Baniyamuddin and Zhao2011; Ghosh et al., Reference Ghosh, Meena, Alam, Dogra, Bhattacharyya, Sharma and Mishra2016).
Rice (Oryza sativa L.) cultivation in paddy systems is the major agricultural land use in the tropical and subtropical monsoon climate regions of Asia (Yang et al., Reference Yang, Ren, Sun and Zhang2012). The double-cropping rice production system (early rice and late rice) is the main crop rotation in southern China and the fertilizer regime (organic manure, chemical fertilizer, and so on) is a vital factor in paddy soil quality and fertility. Also, different long-term organic and inorganic N input managements have profound effects on soil properties such as pH and SOC content, which in turn influence soil physicochemical properties (Chaudhary et al., Reference Chaudhary, Dheri and Brar2017; Tang et al., Reference Tang, Xiao, Tang, Li, Wang, Li, Cheng and Pan2018). However, it is not currently known how different organic and inorganic N input treatments in a double-cropping rice system in southern China affect soil labile and non-LOC fractions under a 3-year fertilizer regime. The current authors hypothesized that: (Hypothesis 1) SOC content and its labile fractions (Cmin, MBC, DOC, POC, LFOC and KMnO4-C) are increased under different organic and inorganic N input conditions; (Hypothesis 2) soil CMI and CPI would be higher with organic manure N input than with chemical fertilizer N input. The objectives of the current study were: (1) to investigate soil bulk density (BD), SOC content and SOC stocks under different fertilizer conditions, and (2) to evaluate soil LOC fractions (Cmin, MBC, DOC, POC, LFOC and KMnO4-C), non-labile C fractions and CMI and CPI of paddy soil in a double-cropping rice system of southern China.
Materials and methods
Sites and cropping system
A field experiment with various organic and inorganic N input treatments was conducted in a double-cropping rice system in southern China. The experiment was established in 2017 and was located in Ning Xiang County (28°07′N, 112°18′E) of Hunan Province, China. Under a continental monsoon climate, the annual mean precipitation is 1553 mm and potential evapotranspiration of 1354 mm. The monthly mean temperature is 17.2°C. Soil texture in the plough layer (0–20 cm) is silt clay loam with 13.9% sand and 58.1% silt. At the beginning of the study, the surface soil characteristics (0–20 cm) were as follows: SOC 22.75 g/kg, total N 2.24 g/kg, available N 178.90 mg/kg, total phosphorous (P) 0.66 g/kg, available P 18.45 mg/kg, total potassium (K) 14.45 g/kg and available K 69.50 mg/kg, pH 6.80. There were two crops each year, early and late rice.
Experimental design
The experiment ensured all treatments received the same amount of N, phosphorus pentoxide (P2O5), potassium oxide (K2O) (the total amount of N, P2O5, K2O in chemical fertilizer and that from organic manure) during the early and late rice growing seasons, respectively. The experiment had five organic and inorganic N input treatments: (1) 100% N from chemical fertilizer (M0), (2) 30% N from organic manure and 70% N from chemical fertilizer (M30), (3) 50% N from organic manure and 50% N from chemical fertilizer (M50), (4) 100% N from organic manure (M100) and (5) without any N fertilizer input, as the control (CK). There were three replications and each plot size was 88.0 m2 (10.0 m × 8.0 m). For both early and late rice, the required quantity of N was applied at the rate of 135 and 165 kg/ha (60%, 30% and 10% at basal, tillering and full heading stages, respectively), 54 and 45 kg/ha of P2O5 as superphosphate, 67.5 and 90.0 kg/ha of K2O as potassium chloride, respectively. All the P2O5 and K2O fertilizers were applied at tillage before rice transplanting. The quantity of organic manure added to the paddy soil for the M30, M50 and M100 treatments was 828, 1380 and 2760 kg/ha, respectively, in the early rice growth period and 1012.5, 1687.5 and 3375.0 kg/ha, respectively, for the late rice growth period. The N, P2O5 and K2O content of organic manure in both rice growth periods was 48.9, 17.3 and 15.1 g/kg, respectively. Before transplanting rice seedlings, organic manure was spread manually onto the soil surface and incorporated to a cultivation depth of 20 cm. Plots were irrigated at the same time as the tillage management was carried out and kept at 2 cm above soil surface during transplanting of rice seedlings. Thereafter, water depth was kept at 5 cm above the soil surface during the seedling stage, followed by drainage and drying of the field at tillering, and finally alternating wet/dry irrigation in the later growth stages.
The early and late rice seedlings (varieties Xiangzaoxian24 and Jinyou 59, respectively) were transplanted manually into the paddy in April and July, and harvested with a combine in July and October, respectively. One-month-old rice seedlings were transplanted at a density of 2 80 000 plants/ha.
Soil sampling
Soil samples were collected at 0–20 cm depths by taking six cores at random from each plot on 25 October 2019 (after late rice harvest). The six soil cores were bulked to form a composite soil sample. Three soil samples per treatment were taken from each plot. After removing visible organic materials, stones and rice roots by hand, the samples were divided into two parts. One part of the fresh soil sample was passed through a 2 mm mesh sieve and kept at 4°C for measurement of soil DOC, MBC and Cmin within 2 weeks, and another part was air-dried and sieved through either a 0.15 mm mesh for the estimation of SOC and KMnO4-C (Shang et al., Reference Shang, Yang, Gao, Wu, Liu, Xu, Shen, Zou and Guo2011) or a 2 mm mesh prior to the measurement of POC and LFOC.
Soil laboratory analysis
Bulk density
Soil BD at 0–20 cm depth was determined by collecting undisturbed soil samples using metallic cores of known volume (15 cm internal diameter and 20.0 cm long). These soil samples were oven-dried at 105°C for 24 h, long enough to reach constant weight for calculation of the dry weight of soil samples (Blake and Hartge, Reference Blake, Hartge and Klute1986).
Soil organic carbon and soil organic carbon stocks
Soil organic C content was determined using the rapid titration method (wet combustion method) as described by Ellert and Bettany (Reference Ellert and Bettany1995).
The soil carbon stocks were calculated from the SOC contents measured in the 0–20 cm soil layer by multiplying them with the respective BD and thickness of the soil layer, and expressed as t/ha.
Soil labile organic C fractions
Permanganate oxidizable C was measured as described by Blair et al. (Reference Blair, Lefroy and Lisle1995). Particulate organic C was determined with the method described by Cambardella and Elliott (Reference Cambardella and Elliott1992). Microbial biomass C was measured by the fumigation–extraction method of Wu et al. (Reference Wu, Joergensen and Pommerening1990), while dissolved organic C (DOC) was determined by the method of Jones and Willett (Reference Jones and Willett2006) and finally the LFOC was determined using the density fractionation method, as described by Janzen et al. (Reference Janzen, Campbell, Brandt, Lafond and Townley-Smith1992).
Soil carbon management index
The soil CMI was calculated based on the method of Blair et al. (Reference Blair, Lefroy and Lisle1995) using the following equation:

where CPI was the soil CPI, LI was the lability index.
The CPI was calculated by the following equation:

In the current study, the control treatment was used as a reference for the calculation of CPI and CMI.
The LI was calculated as follows:

The lability of C (L) was calculated thus:

Statistical analysis
The data of each treatment means were compared using a one-way analysis of variance (ANOVA) following standard procedures at P ⩽ 0.05. All statistical analysis was performed using the SAS 9.3 software package (SAS, 2008). Moreover, redundancy analysis (RDA) using Canoco version 4.5 (Li et al., Reference Li, Wen, Li, Li, Yang, Lin, Song, Gooper and Zhao2018) was used to analyse the relationships between each LOC fraction as a percentage of SOC and the soil CMI under different fertilizer treatments.
Results
Soil bulk density
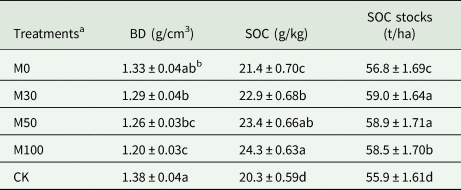
Soil BD ranged between 1.20 and 1.38 g/cm3 in all fertilizer treatments and was significantly (P < 0.05) lower in soils fertilized with organic manure (M30, M50 and M100) compared CK, which had the highest BD (Table 1). Increasing organic manure N input significantly (P < 0.05) decreased BD (1.29 g/cm3 for M30, 1.26 g/cm3 for M50 and 1.20 g/cm3 for M100). There was no statistically significant difference in BD between the M30 and M50 treatments.
Effects of different fertilizer regime on soil bulk density (BD), soil organic carbon (SOC) and SOC stocks under double-cropping rice system (0–20 cm)

a M0: 100% N from chemical fertilizer, M30: 30% N from organic manure and 70% N from chemical fertilizer, M50: 50% N from organic manure and 50% N from chemical fertilizer, M100: 100% N from organic manure, CK: without any N fertilizer input, as the control.
b Values are presented as mean ± s.e. (n = 3).
Different letters in the same column indicate significant difference at P < 0.05.
Soil organic carbon contents and stocks
Short-term continuous fertilizer input significantly (P < 0.05) increased SOC contents and stocks after 3 years for all treatments (Table 1). Treatments which received organic manure (M30, M50 and M100) had significantly (P < 0.05) higher SOC contents and stocks compared with M0 and CK treatments, storing as much as 2.56–3.12 t/ha more C at 0–20 cm soil layer than the CK treatment. Furthermore, SOC stocks with M30 and M50 treatments were significantly (P < 0.05) higher than those of the other treatments, while there was no difference in SOC stocks between the M30 and M50 treatments. The lowest SOC contents and SOC stocks after 3 years were observed in the CK treatment.
Soil labile organic carbon fractions
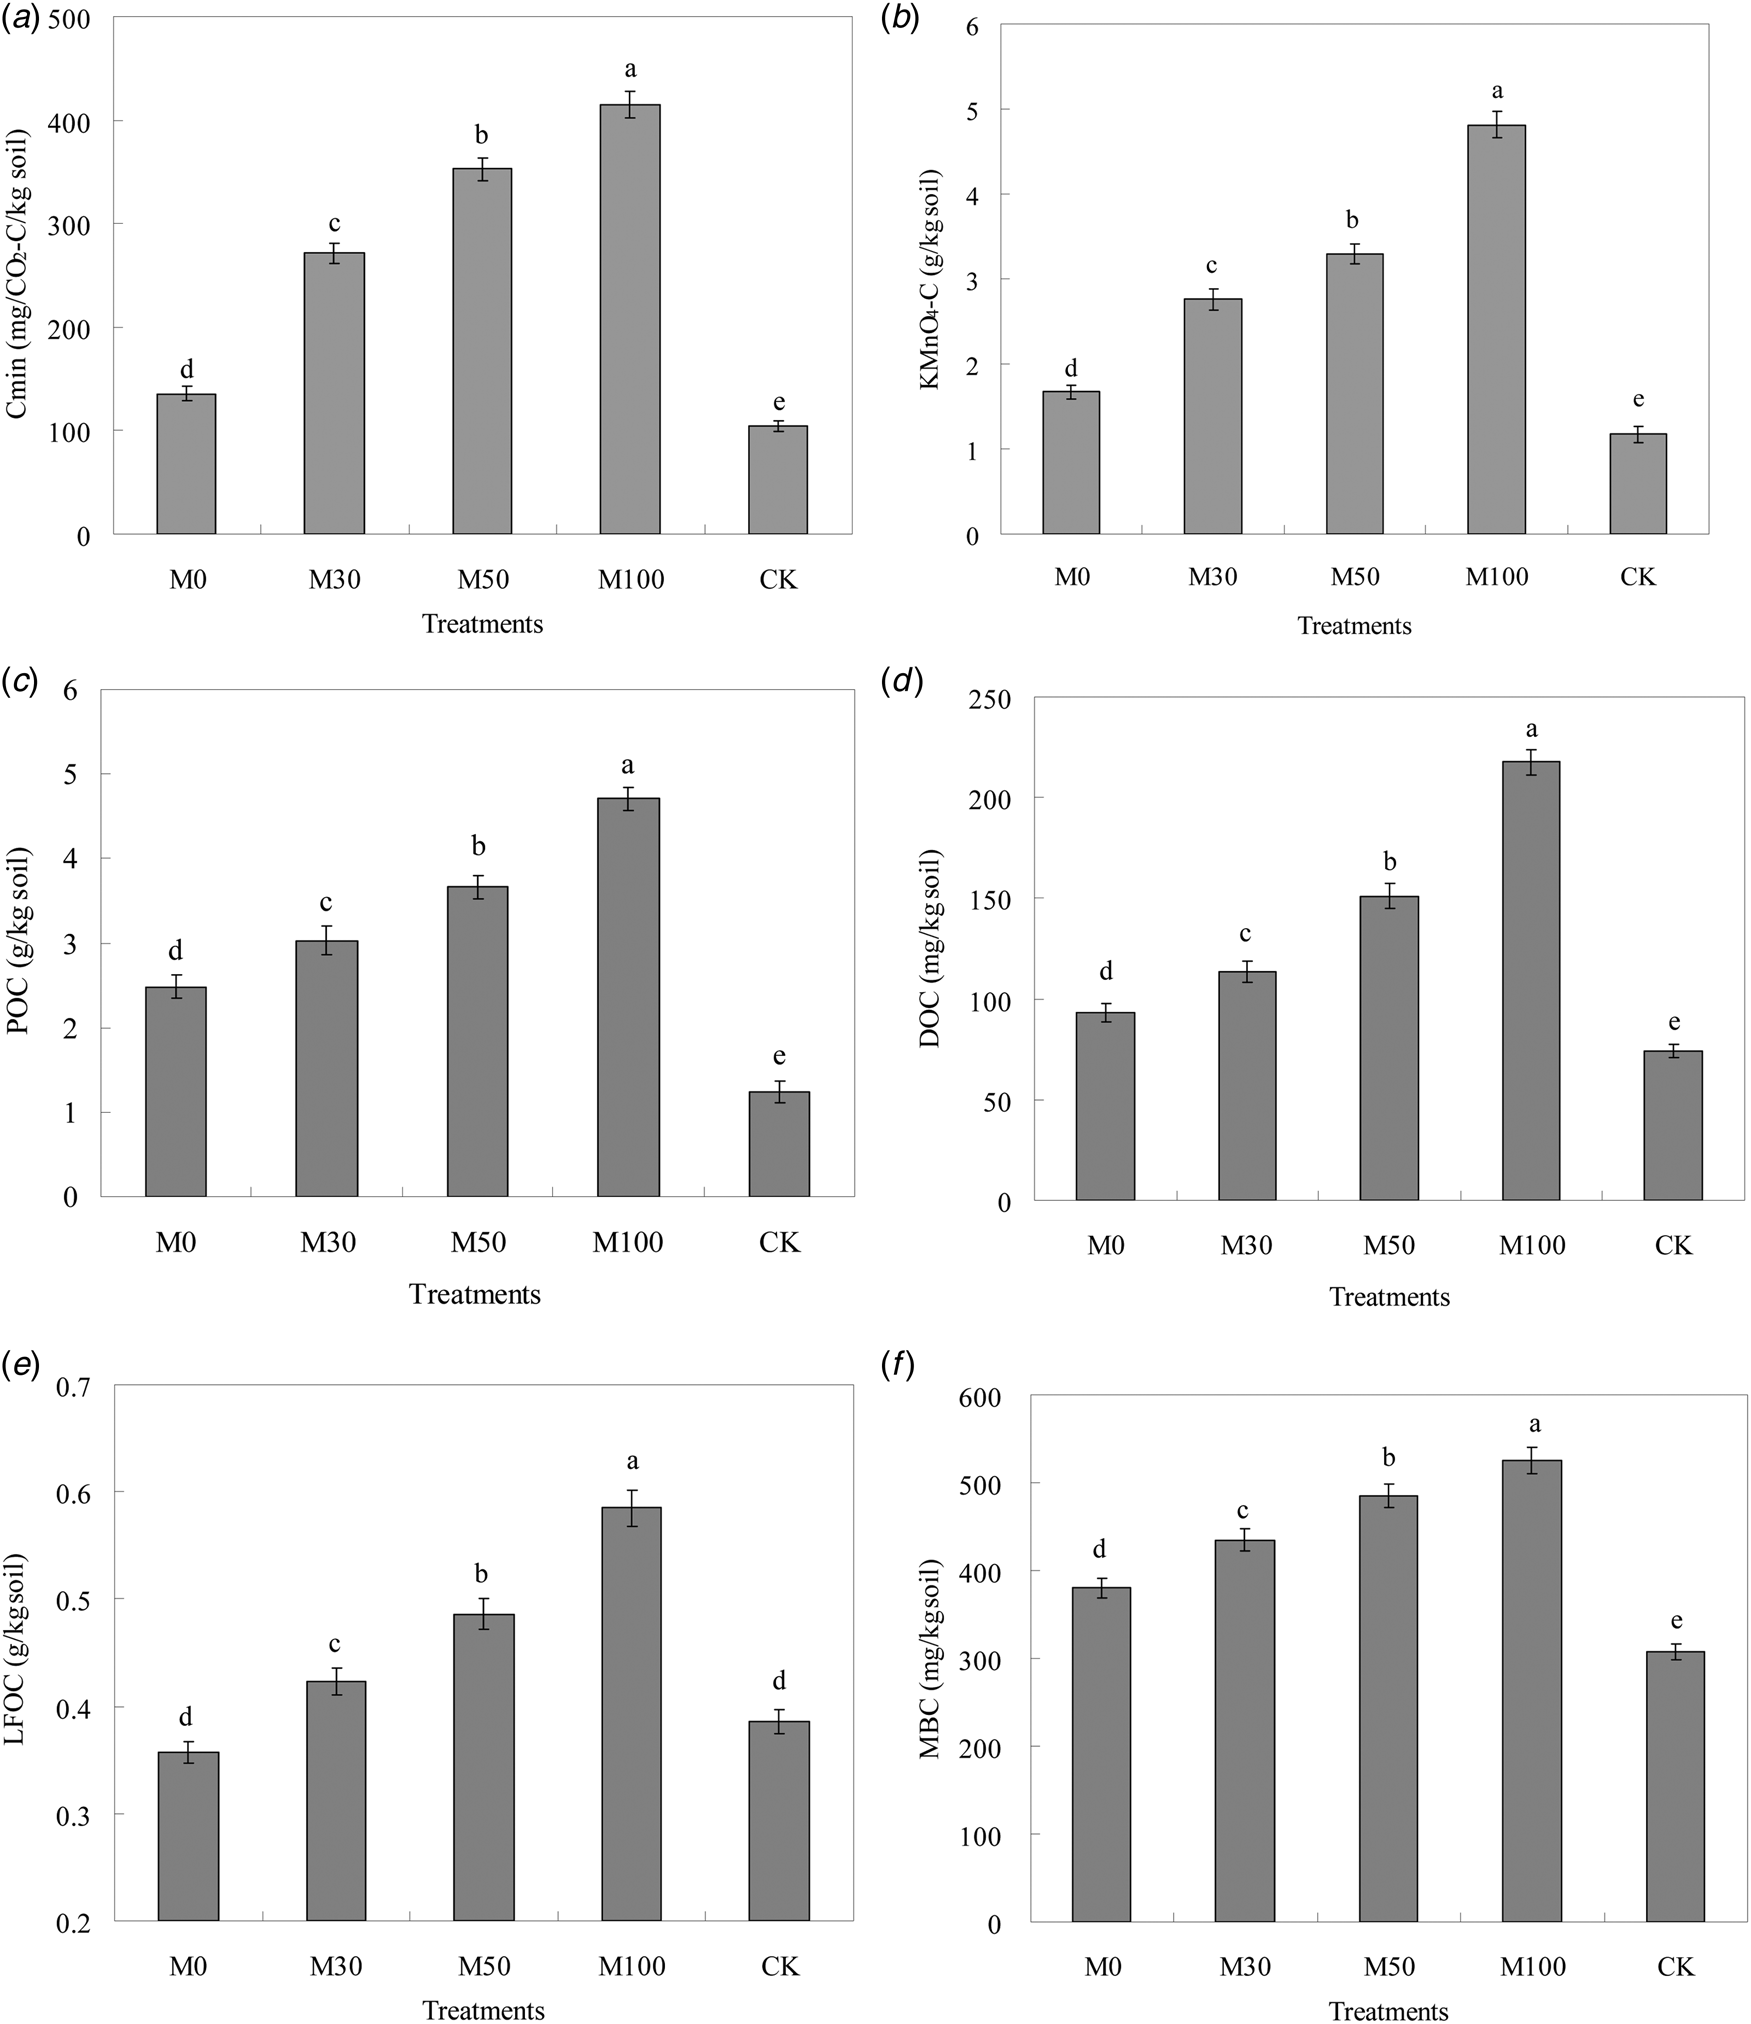
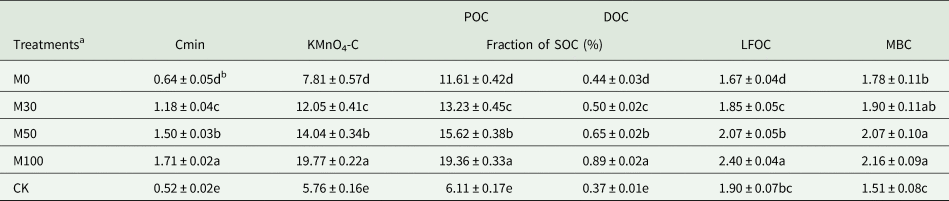
The effects of different fertilizer treatments for 3 years on soil LOC fractions (Cmin, MBC, DOC, POC, LFOC and KMnO4-C) are shown in Fig. 1. Meanwhile, the percentage of each LOC fraction relative to total SOC with different short-term fertilizer regime is shown in Table 2.
Effects of different fertilizer regime on labile organic C fractions in soil at 0–20 cm depth under double-cropping rice system. M0: 100% N from chemical fertilizer, M30: 30% N from organic manure and 70% N from chemical fertilizer, M50: 50% N from organic manure and 50% N from chemical fertilizer, M100: 100% N from organic manure, CK: without any N fertilizer input, as the control. (a) is Cmin, cumulative carbon mineralization in a 21-day incubation experiment; (b) is KMnO4-C, permanganate oxidizable carbon; (c) is POC, particulate organic carbon; (d) is DOC, dissolved organic carbon; (e) is LFOC, light fraction organic carbon; (f) is MBC, microbial biomass carbon. The investigated index value represents the mean of three replications. Error bars represent standard error of mean. Cmin, mineralizable C; KMnO4-C, permanganate oxidizable C; POC, particulate organic C; DOC, dissolved organic C; LFOC, light fraction organic C; MBC, microbial biomass C.
Different letters are significantly different at P < 0.05 level.

Effects of different fertilizer regimes on labile organic C fractions in the 0–20 cm soil layer of a double-cropping rice system

Cmin: mineralizable C; KMnO4-C: permanganate oxidizable C; POC: particulate organic C; DOC: dissolved organic C; LFOC: light fraction organic C; MBC: microbial biomass C.
a M0: 100% N from chemical fertilizer, M30: 30% N from organic manure and 70% N from chemical fertilizer, M50: 50% N from organic manure and 50% N from chemical fertilizer, M100: 100% N from organic manure, CK: without any N fertilizer input, as the control.
b Values are presented as mean ± s.e. (n = 3).
The cumulative amounts of carbon dioxide (CO2)-C (Cmin) in soils with organic manure treatments (271.3 mg CO2-C/g soil for M30, 352.6 mg CO2-C/g soil for M50 and 415.4 mg CO2-C/g soil for M100) were higher (P < 0.05) than in other treatments, and the lowest Cmin content (104.8 mg CO2-C/g soil) was found in the CK treatment. Application of organic manure treatments (M30, M50 and M100) significantly (P < 0.05) increased Cmin content, by 135.6, 216.9 and 279.7 mg CO2-C/g soil compared with M0 treatment, respectively. The Cmin content in M0, M30, M50, M100 and CK treatments were significantly (P < 0.05) different from each other (Fig. 1a). The range of values for mineralizable C (Cmin) formed 0.52–1.71 of SOC. Mineralizable C comprised a very small percentage of the total SOC, and the Cmin as a percentage of SOC was significantly (P < 0.05) higher in M30, M50 and M100 than in the M0 and CK treatments (Table 2).
Permanganate oxidizable C content was highest with the application of organic manure (M30, M50 and M100) to soils, and lowest in the M0 and CK treatments. The content of KMnO4-C in the M0 treatment was higher (P < 0.05) than in the CK treatment (Fig. 1b). The range of values for KMnO4 formed 5.76–19.77% of SOC with the mean value of 11.89% in all fertilizer treatments. The highest percentage of KMnO4-C was observed with M100 treatment, followed by M50 and M30 treatments, and was significantly (P < 0.05) different from the M0 and CK treatments. The M100 treatment had the highest percentage of KMnO4-C and the lowest percentage was found in the CK treatment.
The results indicated that POC contents in the M30, M50 and M100 treatments were significantly higher (P < 0.05) than in the M0 and CK treatments. Therefore, POC contents were increased with the application of organic manure (Fig. 1c). The range of values for POC formed 6.11–19.36% of SOC, and the mean value was 13.18% in all fertilizer treatments. The highest percentage of POC was observed in the M100 treatment, followed by M50 and M30 treatments, which were significantly (P < 0.05) different from the M0 and CK treatments. The lowest percentage of POC were found in the M0 treatment, followed by the CK treatment.
The DOC content was highest in treatments applying organic manure to soils and lowest the M0 and CK treatments. Application of organic manure resulted in higher levels of DOC, with contents 1.53, 2.04 and 2.94 times higher for M30, M50 and M100 treatments, respectively, compared with the CK treatment. Compared with M0 and CK treatments, DOC contents were increased significantly (P < 0.05) under M30, M50 and M100 treatments (Fig. 1d). The values for DOC formed 0.37–0.89% of SOC that were affected significantly (P < 0.05) by different fertilizer treatments, with the highest percentage in the M100 treatment and the lowest in the CK treatment.
The short-term application of organic manure (M30, M50 and M100) resulted in a significant increase in LFOC content compared with M0 and CK treatments. In surface soil (0–20 cm), the LFOC content was 9.59, 25.91 and 51.55% higher in the M30, M50 and M100 treatments, respectively, than in the CK treatment. However, there was no statistically significant difference in LFOC content between the M0 and CK treatments (Fig. 1e). The range of values for LFOC formed 1.67–2.40% of SOC with the mean value of 1.98 in all fertilizer treatments. Meanwhile, the percentage of LFOC with M100 treatment was significantly higher (P < 0.05) than that of M0, M30, M50 and CK treatments.
The MBC content ranged from 307.34 to 524.99 mg/kg, constituting about 1.51–2.16% of total SOC (Fig. 1f, Table 2). The short-term application of organic manure (M30, M50 and M100) resulted in a significant increase (P < 0.05) in MBC content compared with the M0 and CK treatments. MBC content in CK and M0 treatments were significantly (P < 0.05) different from each other. The values for MBC formed of SOC as influenced by different fertilizer treatments showed a similar trend to the MBC content, with higher percentage with M30, M50 and M100 treatments, and lower percentage with CK and M0 treatments.
Soil carbon pool index and carbon management index
The effects of different short-term fertilizer treatments for 3 years on soil CPI and soil carbon management index (CMI) are shown in Table 3. Changes in soil CPI with different fertilizer treatments decreased in the order M100>M50>M30>M0>CK, with values ranging from 1.00 to 1.20. The impacts of different fertilizer treatments on soil CMI were similar to soil CPI, with highest soil CMI with M30, M50 and M100 treatments, and lowest with CK treatment. The highest values of soil CMI were associated with the application of organic manure practices (M30, M50 and M100), followed by M0 treatment. There was no statistically significant difference in soil CMI between the M30, M50 and M100 treatments, but there was a significant difference (P < 0.05) between the M0 and CK treatments.
Effects of different fertilizer regimes on non-labile C and carbon indices in the 0–20 cm soil layer of a double-cropping rice system

L: lability of C (dimensionless); CPI: soil carbon pool index; LI: lability index; CMI: carbon management index.
a M0: 100% N from chemical fertilizer, M30: 30% N from organic manure and 70% N from chemical fertilizer, M50: 50% N from organic manure and 50% N from chemical fertilizer, M100: 100% N from organic manure, CK: without any N fertilizer input, as the control.
b Values are presented as mean ± s.e. (n = 3).
Redundancy analysis of the percentage of each labile organic carbon fraction to soil organic carbon
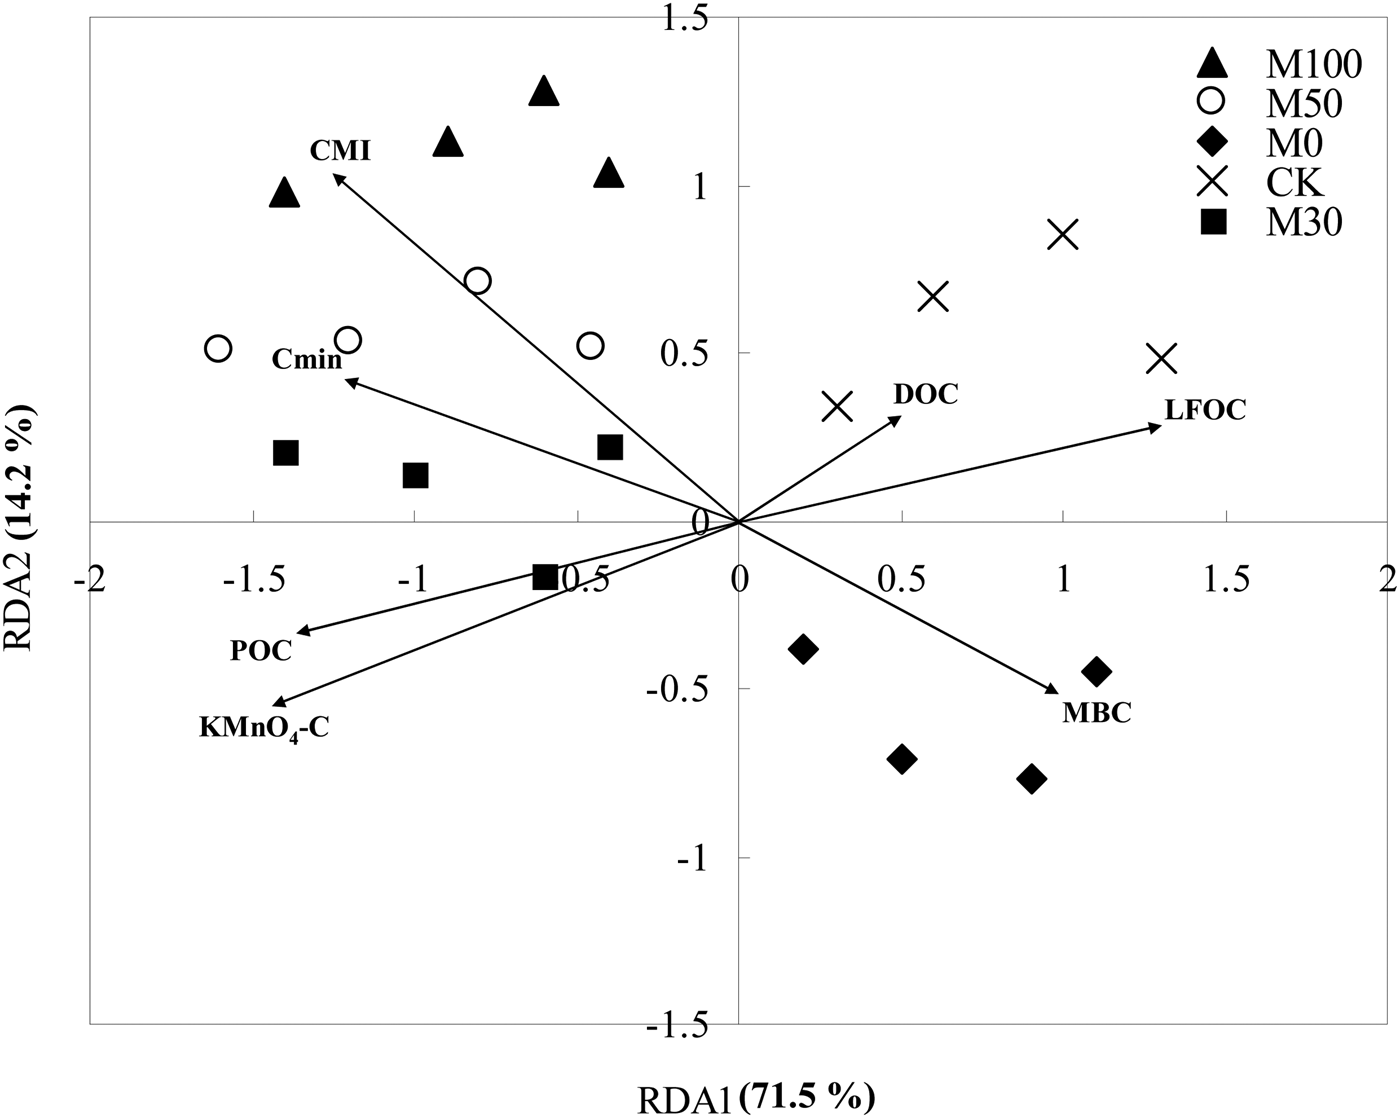
Redundancy analysis (RDA) indicated that each LOC fraction as a percentage of SOC as well as soil CMI as responses was conducted to help understand which types of C were causing the changes in LOC fractions (Fig. 2). The RDA1 and RDA2 accounted for 85.68% of total variation and all the explanatory variables had significant impacts on the percentage of each LOC fraction in SOC and soil CMI (P < 0.05). The results showed that percentage of MBC, LFOC and DOC in SOC were closely related to the positive axis of RDA1. The Cmin, POC and KMnO4-C in total SOC, as well as soil CMI, were closely correlated with the negative axis of RDA1. The application of organic manure treatments (M30, M50 and M100) differentiated significantly from other treatments along the negative axis of RDA1 and all of them were clearly separated from each other. The CK treatment was significantly separated from other treatments along the positive axis of RDA1 and correlated with higher DOC and LFOC contents.
Redundancy analysis (RDA) of the percentage of each labile organic C fraction (Cmin, MBC, DOC, POC, LFOC, KMnO4-C) in SOC as well as CMI under different fertilizer regimes. ◆M0: 100% N from chemical fertilizer, ■M30: 30% N from organic manure and 70% N from chemical fertilizer, ○M50: 50% N from organic manure and 50% N from chemical fertilizer, ▴M100: 100% N from organic manure, × CK: without any N fertilizer input, as the control. Cmin, mineralizable C; KMnO4-C, permanganate oxidizable C; POC, particulate organic C; DOC, dissolved organic C; LFOC, light fraction organic C; MBC, microbial biomass C; CMI, soil carbon management index.

Discussion
Effect of fertilizer managements on soil bulk density, soil organic carbon contents and stocks
In the present study, soil BD was affected by differing short-term fertilizer managements, especially the application of organic manure treatments where it decreased. This could be due to the formation of macro-pores and macro-aggregates induced by the cementing action of organic acids and polysaccharides excreted by microorganism during decomposition of the applied organic manure (Rasool et al., Reference Rasool, Kukal and Hira2008; Yu et al., Reference Yu, Ding, Luo, Geng and Cai2012; Brar et al., Reference Brar, Singh, Dheri and Kumar2013). Compared with the control treatment, soil BD also decreased with chemical fertilizer alone, a finding supported by Liu et al. (Reference Liu, Teclemariam, Yan, Yu, Gu, Liu, He and Liu2014). The soil BD decreases may be due to higher levels of rice root residue and rhizodeposition inputs when chemical fertilizer was used compared with the without fertilizer input treatment (Jiang et al., Reference Jiang, Jiang, Jia, Li and Xu2006). Meanwhile, the results also indicated that the highest SOC content was correlated with the lowest BD in organic manure treatments, while chemical fertilizer alone had moderate levels of SOC content and BD, and the control treatment had the lowest SOC content, correlated with the highest BD. Lack of organic manure input was the main reason for the increased BD in surface soil layers since organic matter stabilizes soil aggregates against slaking, dispersion and collapse (Logsdon and Karlen, Reference Logsdon and Karlen2004): this agrees with the current findings that increases in SOC content were related to decreased soil BD in different fertilizer treatments.
Some studies have reported that SOC content is influenced by different field management practices, such as tillage (Liu et al., Reference Liu, Teclemariam, Yan, Yu, Gu, Liu, He and Liu2014) and fertilizer practices (Yan et al., Reference Yan, Wang and Yang2007; Xu et al., Reference Xu, Lou, Sun, Wang, Baniyamuddin and Zhao2011; Yang et al., Reference Yang, Ren, Sun and Zhang2012). In the present study, SOC content in the control treatment was slightly decreased after 3 years of double-cropping rice compared with initial soil levels (22.75 g/kg). This could be attributed to increased grain yield from modern, higher-yielding varieties, and the fact that, counter to current farmers' practice in southern China, the above-ground crop residue was removed from the soil each year. At present, farmers generally leave the root and part of the crop residue in the paddy soil.
In the current study, SOC contents and stocks in paddy soil were influenced by different fertilizer practices. Compared with the control treatment, SOC content was increased marginally with chemical fertilizer alone. These results contrast with previous studies, which found that the use of chemical fertilizer induced a decrease in SOC content (Mulvaney et al., Reference Mulvaney, Khan and Ellsworth2009; Lou et al., Reference Lou, Wang and Liang2011). These differences seem to depend on initial soil C status, field ecosystem, quantity and quality of residue returned, and the quantity and types of fertilizer applied (Hamer et al., Reference Hamer, Potthast and Makeschin2009). The increases in SOC content and stocks in the topsoil layer in the current study may be due to higher quantities of available nutrients for better rice growth, resulting in increased root residue and exudates being returned to the paddy soil. This is supported by reports from other long-term field experiments (Fan et al., Reference Fan, Ding, Xiang, Qin, Zhang and Ziadi2014; Kätterer et al., Reference Kätterer, Börjesson and Kirchmann2014).
Compared with M0 and control treatments, the SOC content and stocks increased considerably with the application of organic manure, which could possibly be attributed to the larger percentage of recalcitrant organic compounds in manure than in chemical fertilizers (Liu et al., Reference Liu, Teclemariam, Yan, Yu, Gu, Liu, He and Liu2014). The increase of SOC content in the organic manure treatments was mainly due to the fact that the input of organic matter was higher than the amount removed. This implies that a high amount of organic material input through manure application is required for increasing the soil organic C pools. Therefore, higher SOC stocks in the paddy soil may be attributed to both higher organic matter inputs and lower C decomposition rates with the application of manure than with chemical fertilizers (Kögel-Knabner et al., Reference Kögel-Knabner, Ekschmitt, Flessa, Guggenberger, Matzner, Marschner and Lützow2008; Kalbitz et al., Reference Kalbitz, Kaiser, Fiedler, Kölbl, Amelung, Bräuer, Cao, Don, Grootes, Jahn, Schwark, Vogelsang, Wissing and Kögel-Knabner2013). The significant increases in non-labile C in the organic manure treatments soils indicated that manure addition could be a strategy to improve SOC stabilization in the long term (Ding et al., Reference Ding, Han, Liang, Qiao, Li and Li2012).
Effect of fertilizer managements on soil labile organic carbon fractions
Previous results have indicated that LOC fractions are markedly increased with the application of organic manure (Ding et al., Reference Ding, Han, Liang, Qiao, Li and Li2012; Liang et al., Reference Liang, Chen, Gong, Fan, Yang, Lal and Kuzyakov2012). These results are consistent with the current authors' first hypothesis, that SOC content and its labile fractions are increased by the application of organic manure N input managements. The reason may be that soil LOC pool and soil microbial activities are changed with the application of organic manure managements, therefore, the conversion of plant residue-C into labile forms of organic C are also increased (Whalen et al., Reference Whalen, Gul, Poirier, Yanni, Simpson, Clemente, Feng, Grayston, Barker, Gregorich, Angers, Rochette and Janzen2014).
The Cmin, DOC and MBC contents are sensitive indicators of soil quality and cycle nutrient (Benbi et al., Reference Benbi, Brar, Toor and Singh2015). It is widely accepted that Cmin, DOC and MBC contents increase under application of organic manure, suggesting that application of organic manure has a beneficial effect on the activity of microorganisms, probably by providing a readily available source of C substrate and improving the soil physical environment (Lou et al., Reference Lou, Wang and Liang2011; Yang et al., Reference Yang, Ren, Sun and Zhang2012). However, other results have shown that Cmin, DOC and MBC contents increase under application of mineral fertilizers conditions (Lou et al., Reference Lou, Wang and Liang2011). In the present study, the values for percentage of MBC in SOC with chemical fertilizer treatment was higher than that of the CK treatment, suggesting that inputs of C from root residue/rhizodeposition in this treatment promoted the growth of the microbial biomass but did not contribute as much to the total SOC. Similar results were also found by Jiang et al. (Reference Jiang, Jiang, Jia, Li and Xu2006) in China.
Soil DOC is a vital source of C for microbial metabolic maintenance needs (Xu et al., Reference Xu, Lou, Sun, Wang, Baniyamuddin and Zhao2011). This explains why in the current study soils with the highest DOC also had the highest Cmin and MBC (Montaño et al., Reference Montaño, García-Oliva and Jaramillo2007). Furthermore, short-term application of organic manure had a significant effect on DOC content, which is in agreement with Zsolnay and Görlitz (Reference Zsolnay and Görlitz1994), confirming that the primary source of DOC was manure input. While DOC as a percentage of SOC was highest for the M100, M50 and M30 treatments, it was lowest for the CK treatment, possibly reflecting the higher levels of decomposed organic C in the organic manure (M30, M50 and M100) treatments, as evidenced by its high percentage of DOC (Wright et al., Reference Wright, Provin, Hons, Zuberer and White2005).
Soil POC and LFOC belong to physically uncomplexed organic matter which has been isolated on the basis of particle size and/or density using physical fractionation techniques (Fortuna et al., Reference Fortuna, Harwood and Paul2003). The current results showed that the percentage of POC and LFOC varied from 6.11% to 19.36% and 1.90 to 2.40%, respectively, reflecting the annual inputs of fresh C in the experimental treatments. The current results are supported by previous reports (Haynes, Reference Haynes2005; Yang et al., Reference Yang, Ren, Sun and Zhang2012), indicating that higher C input induced by fertility managements resulted in significantly larger physically uncomplexed organic carbon (POC and LFOC) pools. Gosling et al. (Reference Gosling, Parsons and Bending2013) also indicated that POC and LFOC were increased under the application of organic matter. Whalen et al. (Reference Whalen, Gul, Poirier, Yanni, Simpson, Clemente, Feng, Grayston, Barker, Gregorich, Angers, Rochette and Janzen2014) reported that quantities of C from organic manure were retained in soil particulate fractions, while LFOC contains more lignin derivatives, carbohydrate constituents and aliphatic compounds than POC. This also explains why, in the current study, the highest values for percentage of POC in SOC and percentage of LFOC in SOC were seen under application of organic manure (M30, M50 and M100).
Permanganate oxidizable C includes amino acids, simple carbohydrates, a portion of soil microbial biomass and other simple organic compounds, and is usually considered an important indicator of soil quality (Xu et al., Reference Xu, Lou, Sun, Wang, Baniyamuddin and Zhao2011). In the present study, the results showed that KMnO4-C was higher in total and as a percentage of the total C in soils treated with organic manure compared with chemical fertilizer alone and those without any N fertilizer input, confirming that organic manure input drives changes in pools of labile C, as already discussed for the other fertilizer measures of labile C.
Effect of fertilizer managements on soil carbon management index
It has been widely accepted that soil CMI is an important parameter to assess the capacity of nutrient managements to improve soil quality (Diekow et al., Reference Diekow, Mielniczuk, Knicker, Bayer, Dick and Kogel-Knaber2005; Tang et al., Reference Tang, Xiao, Tang, Li, Wang, Li, Cheng and Pan2018). The soil CMI, CPI and LI indexes reflected C sequestration and C cycling potential in different paddy ecosystems. In the present study, soil CMI in treatments with an application of organic manure (M30, M50 and M100) were higher than that of chemical fertilizer alone (M0) and without N fertilizer input (CK). This is consistent with Hypothesis 2, that soil CMI would be higher with organic manure N input than with chemical fertilizer N input. These findings are consistent with previous studies on long-term fertilizer field experiments (Xu et al., Reference Xu, Lou, Sun, Wang, Baniyamuddin and Zhao2011; Ghosh et al., Reference Ghosh, Meena, Alam, Dogra, Bhattacharyya, Sharma and Mishra2016). The findings were attributed to increases in annual C addition and the changes in organic matter quality, thus affecting the susceptibility of C to KMnO4 oxidation (Tirol-Padre and Ladha, Reference Tirol-Padre and Ladha2004). In the current study, the soil CMI was higher in the M0 treatment than in the CK treatment in the 0–20 cm soil layer. This may be due to input of C from roots, crop residues and application of chemical fertilizer with tillage, higher crop residue recycling and other biological activities in soil layer (Chaudhary et al., Reference Chaudhary, Dheri and Brar2017). Soil CMI was highly correlated with the amount of each LOC fraction and total SOC content. These results reinforce soil CMI as a reliable index to assess the quality of nutrient management in the double-cropping rice system of southern China.
Conclusions
The current results clearly show that 3 years of organic manure application decreased SBD but increased SOC content, SOC stocks and LOC fractions (Cmin, MBC, DOC, POC, LFOC and KMnO4-C) compared with chemical fertilizer or without N fertilizer input treatments in a double-cropping rice system of southern China. The results also indicated that soil carbon cycling services and soil quality increased through the application of organic manure managements. Great increases in the values of soil CMI with the application of organic manure treatments indicated C sequestration and carbon cycling soil ecosystem services were enhanced compared with chemical fertilizer alone treatment. In the present study, M30 and M50 treatments were found to be the most efficient fertilizer managements in sequestering organic carbon; a larger amount of organic carbon storage and sequestration could also be achieved under M30 and M50 conditions. In conclusion, application of 30 and 50% N of organic manure could be the most beneficial strategies for improving SOC status and maintaining soil quality in a double-cropping paddy soil of southern China.
Financial support
This study was supported by the National Natural Science Foundation of China (31872851), the Innovative Research Groups of the Natural Science Foundation of Hunan Province (2019JJ10003).
Conflicts of interest
The authors do not have any conflicts of interest.
Ethical standards
None.