Introduction
The interaction between plants and microorganisms might occur in the endosphere, phyllosphere or rhizosphere of the plant. Endosymbiosis is a specific type of symbiosis between microorganisms and plants (Santoyo et al., Reference Santoyo, Moreno-Hagelsieb, del Carmen Orozco-Mosqueda and Glick2016). Endophytes are microorganisms (bacteria and fungi) living inside the plant tissues for at least part of their life-cycle, without causing any disease symptoms in the host plant (Wilson, Reference Wilson1995). Bacteria are a very important element of sustainable agriculture, which ensure effective plant production. Recently, a growing interest in endophytic bacteria has been seen in the literature because these bacteria are known to improve plant growth and development. For example, endophytic bacteria play an integral role in the functioning of agroecosystems because they perform many important functions, such as activating growth and modulating plant metabolism.
Biodiversity and identification analyses are an opportunity to find microorganisms that possess beneficial and desired characteristics (Miliute et al., Reference Miliute, Buzaite, Baniulis and Stanys2015; Gałązka et al., Reference Gałązka, Gawryjołek, Grządziel, Frąc and Księżak2017). From an agricultural point of view, the most important features of endophytic bacteria are the production of phytohormones such as auxins, cytokinins and gibberellins and the reduction of ethylene by synthesizing an enzyme, namely 1-aminocyclopropane-1-carboxylate (ACC) deaminase. They can also enhance the bioavailability of phosphorus (P), sulphur (S) and iron (Fe), as well as fix atmospheric nitrogen (N). Furthermore, endophytes can be used as biocontrol agents, due to their capacity to inhibit the growth of pathogens through the production of antifungal or antibacterial compounds, such as siderophores, antibiotics and hydrogen cyanide (HCN) (Santoyo et al., Reference Santoyo, Moreno-Hagelsieb, del Carmen Orozco-Mosqueda and Glick2016). Studies on the identification and differentiation of the plant microbial community can contribute to the potential to reduce the incidence of plant disease, increase agricultural production and reduce pesticide inputs, resulting in more sustainable agricultural practices.
The endophyte community structure exhibits a high diversity of species, which is greatly affected by abiotic and biotic factors, and is strongly dependent on both the type of soil and the type of plant (Gaiero et al., Reference Gaiero, McCall, Thompson, Day, Best and Dunfield2013; Gałązka et al., Reference Gałązka, Gawryjołek, Grządziel, Frąc and Księżak2017; Grządziel and Gałązka, Reference Grządziel and Gałązka2018). Plants evolve as a result of agricultural practices such as irrigation, application of pesticides or fertilizers and mechanization. These processes cause many changes in the structure of microorganisms in the soil and plants. An important topic of research is evaluating microbial diversity and adaptability to new conditions of the surrounding environment. Monitoring bacterial diversity and understanding their role in nutrient cycling processes, plant development, growth and defence mechanisms will enable the identification and development of more sustainable plant growth-promoting bacteria (PGPB) (Knief et al., Reference Knief, Delmotte and Vorholt2011; Miliute et al., Reference Miliute, Buzaite, Baniulis and Stanys2015).
The identification of bacterial isolates using molecular techniques is crucial for the development of areas such as biotechnology, microbiology and medicine. Molecular methods used in microbiology have enabled more comprehensive studies of the abundance and community composition of endophytic bacteria (Frąc and Jezierska-Tys, Reference Frąc and Jezierska-Tys2010; Santoyo et al., Reference Santoyo, Moreno-Hagelsieb, del Carmen Orozco-Mosqueda and Glick2016). In the evaluation of bacterial diversity, the choice of appropriate methods is very important. The improvement of methods and tools used for microbiological assessment, monitoring of soil microbial diversity at different levels (family, genus, species) and linkages between microbial diversity and soil and plant ecosystems, are all very important.
Molecular techniques are probably the most efficient tools to identify and differentiate microorganisms. Among them, BOX – polymerase chain reaction (BOX-PCR), enterobacterial repetitive intergenic consensus – PCR (ERIC-PCR) (Versalovic et al., Reference Versalovic, Schneider, De Bruijn and Lupski1994) and PCR – denaturing gradient gel electrophoresis (PCR-DGGE) (Muyzer and Smalla, Reference Muyzer and Smalla1998) are the most important and commonly used. The genomes of prokaryotic and eukaryotic organisms may contain repetitive sequences, such as repetitive extragenic palindromic (REP) BOX and ERIC (Versalovic et al., Reference Versalovic, Schneider, De Bruijn and Lupski1994). The repetitive element PCR (Rep-PCR) is a method that differentiates microorganisms by using primers, complementary to interspersed repetitive consensus sequences that enable amplification of diverse-sized DNA fragments. BOX-PCR and ERIC-PCR have been demonstrated to be useful molecular typing techniques for a variety of bacteria, such as Rhizobium meliloti (De Bruijn, Reference De Bruijn1992), Stenotrophomonas maltophilia (Lin et al., Reference Lin, Chiou, Chang and Yang2008), Comamonas sp. (Narayan et al., Reference Narayan, Pandey and Das2010) and Delftia cidovorans (Kawamura et al., Reference Kawamura, Yagi, Hatakeyama, Hasegawa, Ohkura, Ohkusu, Takahashi and Kojima2011).
The PCR-DGGE has been classified as a technique based on the separation of DNA fragments with the same length, but the different sequence, in a linear urea-formamide gradient (Myers et al., Reference Myers, Maniatis and Lerman1987). It has been widely used in the identification and assessment of bacterial diversity, for example with Rhizobium tropici and R. leguminosarum (De Oliveira et al., Reference De Oliveira, Coutinho, Sobral, Guimaraes, Van Elsas and Manfio1999), Variovorax sp. (Bers et al., Reference Bers, Sniegowski, Albers, Breugelmans, Hendrickx, De Mot and Springael2011), Stenotrophomonas maltophila (Brooke, Reference Brooke2012), Delftia sp. and Comamonas sp. (Boon et al., Reference Boon, Goris, De Vos, Verstraete and Top2001). Compared with other methods, rep-PCR and PCR-DGGE are characterized by high reproducibility and a high degree of differentiation. The combination of two or more techniques will increase the discriminatory power of the analysis significantly. ERIC-PCR, BOX-PCR and PCR-DGGE methods are quick, easy to perform, cost-effective and applicable to a large number of isolates. The application of molecular DNA fingerprinting techniques to microbiology has demonstrated the enormous diversity of microorganisms important for proper functioning of plants in changing environmental conditions.
The aim of the current study was the isolation, identification and evaluation of genomic diversity of bacteria from the roots and stems of selected crops, including maize, broad bean, wheat, rye, as well as wild plants which often accompany these crops, such as horsetail and burdock. Plants were selected based on agricultural use and economic value. The current study was undertaken to further characterize the biotechnological potential of tested isolates and to develop a foundation for future studies of bio-stimulators.
Materials and methods
Plant materials
Plant samples consisting of four different crops and two wild plants were collected during the summer of 2014 from the Institute of Soil Science and Plant Cultivation experimental field located in Grabow, the Masovian Voivodeship, Poland (52°13′N, 19°37′E). For the isolation of endophytes, healthy and mature plants of Zea mays L. (maize), Vicia faba L. (broad bean), Secale cereale L. (rye), Triticum aestivum L. (wheat), Arctium lappa L. (burdock) and Equisetum arvense L. (horsetail) were selected. Roots and stems of the plants were transported to the laboratory at 4 °C in a portable cooler.
Isolation of endophytic bacteria
Soil particles were removed and the plant roots and stems washed and rinsed carefully with distilled water. Afterwards, the roots and stems were cut into 5–10 cm pieces and the surfaces sterilized by immersing them in 70% ethanol for 3 min, sodium hypochlorite (2.5%) for 2 min and ethanol for 30 s. Afterwards, the plants were rinsed four times in distilled water and dried. Plant tissues were placed in sterile Petri dishes, cut into 1-cm fragments using sterile tools and mashed gently. Subsequently, macerated root and stem fragments were placed on a tryptic soy agar (TSA) medium and incubated at 28 °C for 120 h. The dominant colonies were transferred to the TSA medium to obtain a pure colony. The isolates were maintained in a TSA medium and stored at 4 °C. Gram-staining was also performed. After colony staining, the purity was evaluated using an optical microscope at 100 × magnification (Nikon Eclipse 50i, Tokyo, Japan).
16S rRNA Gene amplification and Sanger sequencing
Genomic DNA was extracted from endophytic bacterial isolates using a MasterPure™ Complete DNA and RNA Purification Kit (MP Biomedicals, OH, USA) according to the manufacturer's protocol. Amplification of 16S rDNA was conducted according to K. Walker (personal communication). The following primers were used in the PCR reaction: 27F and 1492R (Lane, Reference Lane, Stackebrandt and Goodfellow1991). The 20 µl reaction mixture consisted of 4 µl of 5 × Silver Hot Start PCR MIX LOAD (Syngen), 0.3 µl of each primer (10 µm), 2 µl DNA (100 ng) and sterile MilliQ water. Polymerase chain reaction amplification was performed in the thermocycler (Professional 96 Basic Gradient, Biometra, Germany) in the following conditions: initial denaturation at 95 °C for 15 min was followed by 35 cycles of denaturation at 95 °C for 30 s, annealing at 52 °C for 1 min, extension at 72 °C for 1.5 min and a final extension at 72 °C for 7 min. Afterwards, 16S rRNA Sanger sequencing was performed at the Genomed Laboratory in Warsaw, Poland. Fingerprinting DNA analyses were carried out to confirm the effect of the plant genotype on the degree of differentiation of the tested microorganisms. The PCR-DGGE, BOX-PCR and ERIC-PCR techniques were used for molecular level differentiation of isolates and are useful methods to reduce the number of the isolated cultures that are identical or very similar. Moreover, these techniques improve the selection process of bacterial isolates that will be tested in vitro to determine their potential as plant growth promoters.
Denaturing gradient gel electrophoresis
To evaluate genomic diversity between the isolates that occurred in multiple host plants, 18 out of 45 identified isolates were subjected to comparative assessment by PCR-DGGE. The isolates were selected based on literature data that reported plant growth promoting activities of these species (Lodewyckx et al., Reference Lodewyckx, Vangronsveld, Porteous, Moore, Taghavi, Mezgeay and van der Lelie2002). The following bacteria were selected: 11 isolates of Delftia sp. (five from maize, two from wheat, three from rye and one from broad bean), three isolates of Stenotrophomonas sp. (one from horsetail, one from maize and one from burdock), two isolates of Brevundimonas sp. (both from horsetail) and two isolates Rhizobium sp. (one from horsetail and one from broad bean). The amplification was conducted using specific primers, GC-338F and 518R, for 32 cycles of initial denaturation, 3 min at 95 °C, 30 s at 95 °C, 30 s at 55 °C, 30 s at 72 °C and a final extension of 5 min at 72 °C in the thermocycler (Professional 96 Basic Gradient Biometra, Germany) (Nakatsu et al., Reference Nakatsu, Torsvik and Øvreås2000). The 25 µl PCR mixture was composed of 12.5 µl of 2 × Dream Taq Green PCR Master Mix (Thermo Scientific, Waltham, MA, USA), 1 µl of each primer (0.4 µm), 1 µl DNA (10 ng) and sterile MilliQ water. The PCR products were separated by electrophoresis in a polyacrylamide gel at a concentration of 8% (v/v), with a gradient of denaturant (urea and formamide) from 40 to 60%. The reaction was carried out in a DCode Mutation Detection system (BioRad, Richmond, CA, USA), filled with 1 × TAE buffer for 16 h at 60 °C, at the 55 V condition. After separation, the gel was stained using 10 000 × diluted in 1 × TAE SYBR® Gold Nucleic Acid Gel Stain (Thermo Scientific, Waltham, MA, USA) and visualized on a UV transilluminator. The fingerprint images were analysed with Quantity One 4.6.9 (BioRad, Richmond, CA, USA) software.
Repetitive-polymerase chain reaction
The Rep-PCR method was used to determinate the genotypic diversity of the selected bacteria. The following primers were used: ERIC1, ERIC2 and BOX1AR (Versalovic et al., Reference Versalovic, Schneider, De Bruijn and Lupski1994). Each reaction contained 12.5 µl of 2 × Dream Taq Green PCR Master Mix (Thermo Scientific, Waltham, MA, USA), 0.5 µl of each primer (5 µm), 1 µl of DNA (50 ng) and sterile ultrapure MilliQ water, for a total volume of 25 µl. The BOX-PCR and ERIC-PCR cycling programs started with an initial denaturation of 95 °C for 3 min, followed by 35 cycles at 95 °C for 30 s, primer annealing at 50 °C (ERIC) and 53 °C (BOX) for 30 s, primer extension for 1 min at 72 °C and a final extension step at 72 °C for 15 min in thermocycler (Professional 96 Basic Gradient Biometra, Germany).
Data analysis
Assembling sequences into a single contig was done using Unipro UGENE v1.24.0. The identification of the isolates was performed using the Ribosomal Database Project (http://rdp.cme.msu.edu/) and the Basic Local Alignment Search Tool (BLAST) (http://blast.ncbi.nlm.nih.gov/blast/Blast.cgi). The similarity of obtained sequences to reference sequences, as well as a classification to the genus level, were performed using the National Centre for Biotechnology Information biological database. The phylogenetic trees were constructed using the Neighbour-Joining algorithm in Molecular Evolutionary Genetics Analysis (MEGA) software version 7.0.18 (https://www.megasoftware.net/). The patterns of 16S rDNA DGGE fragments obtained were subjected to numerical analysis and the degree of genomic similarity of bacterial isolates was determined. The results were presented in the form of dendrograms and the similarity matrix. A similarity matrix was estimated according to the Dice formula (Dice's coefficient method) (Dice, Reference Dice1945). Using the package RStudio (http://www.rstudio.com/), a heatmap, presented in a percentage scale of similarity, was generated.
The patterns of all the isolates (obtained by the BOX-PCR and ERIC-PCR methods) were analysed using the Bio-Profil software (Vilber Lourmat, France). A dendrogram was constructed using the unweighted pair group method with arithmetic means (UPGMA).
Results
Bacterial isolation and 16S rDNA sequencing
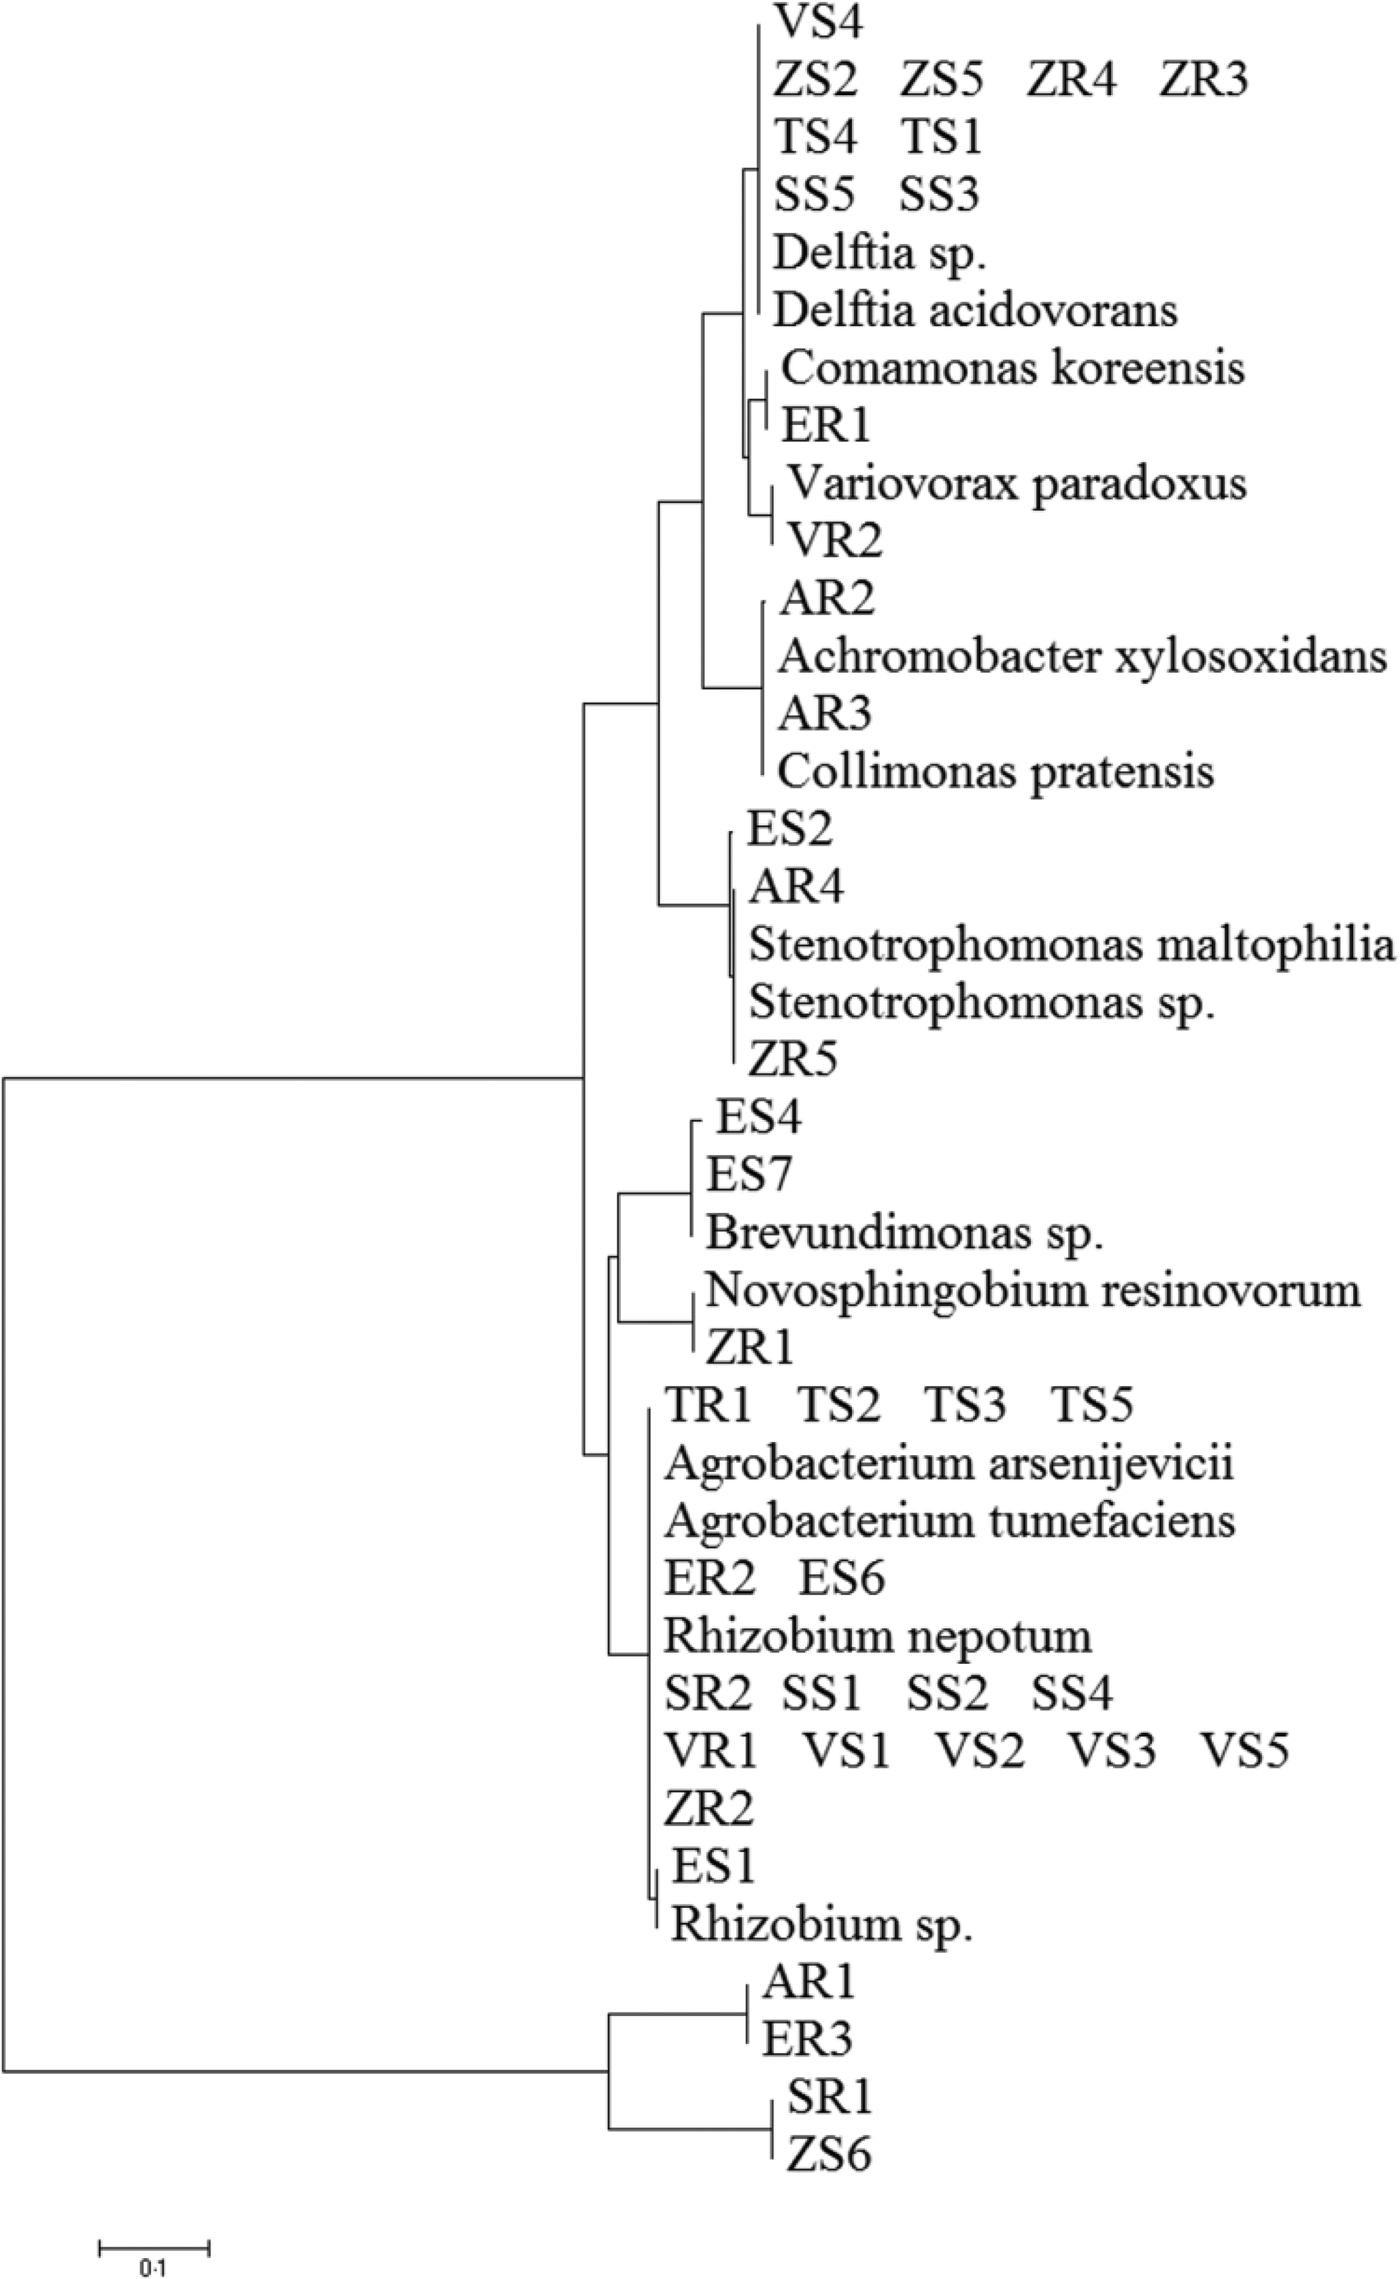
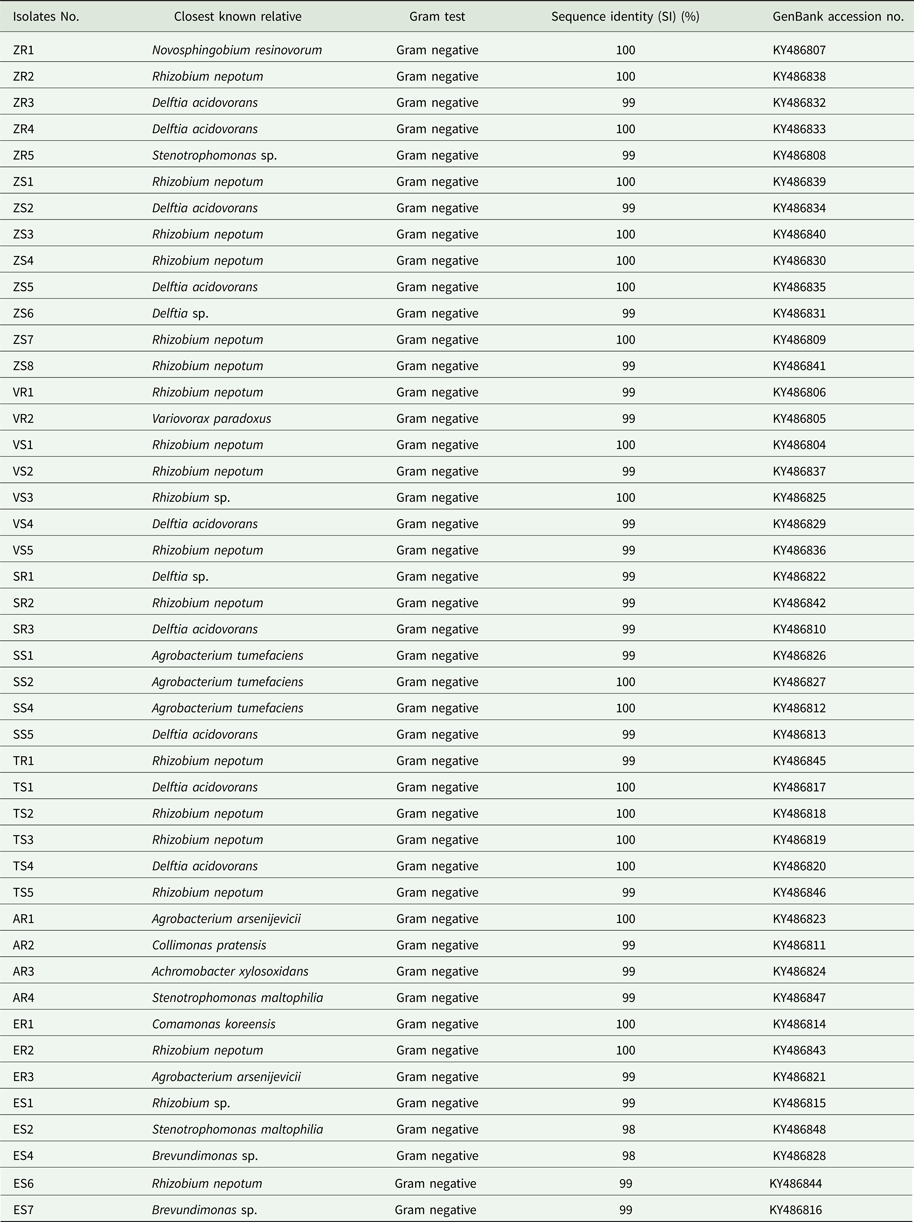
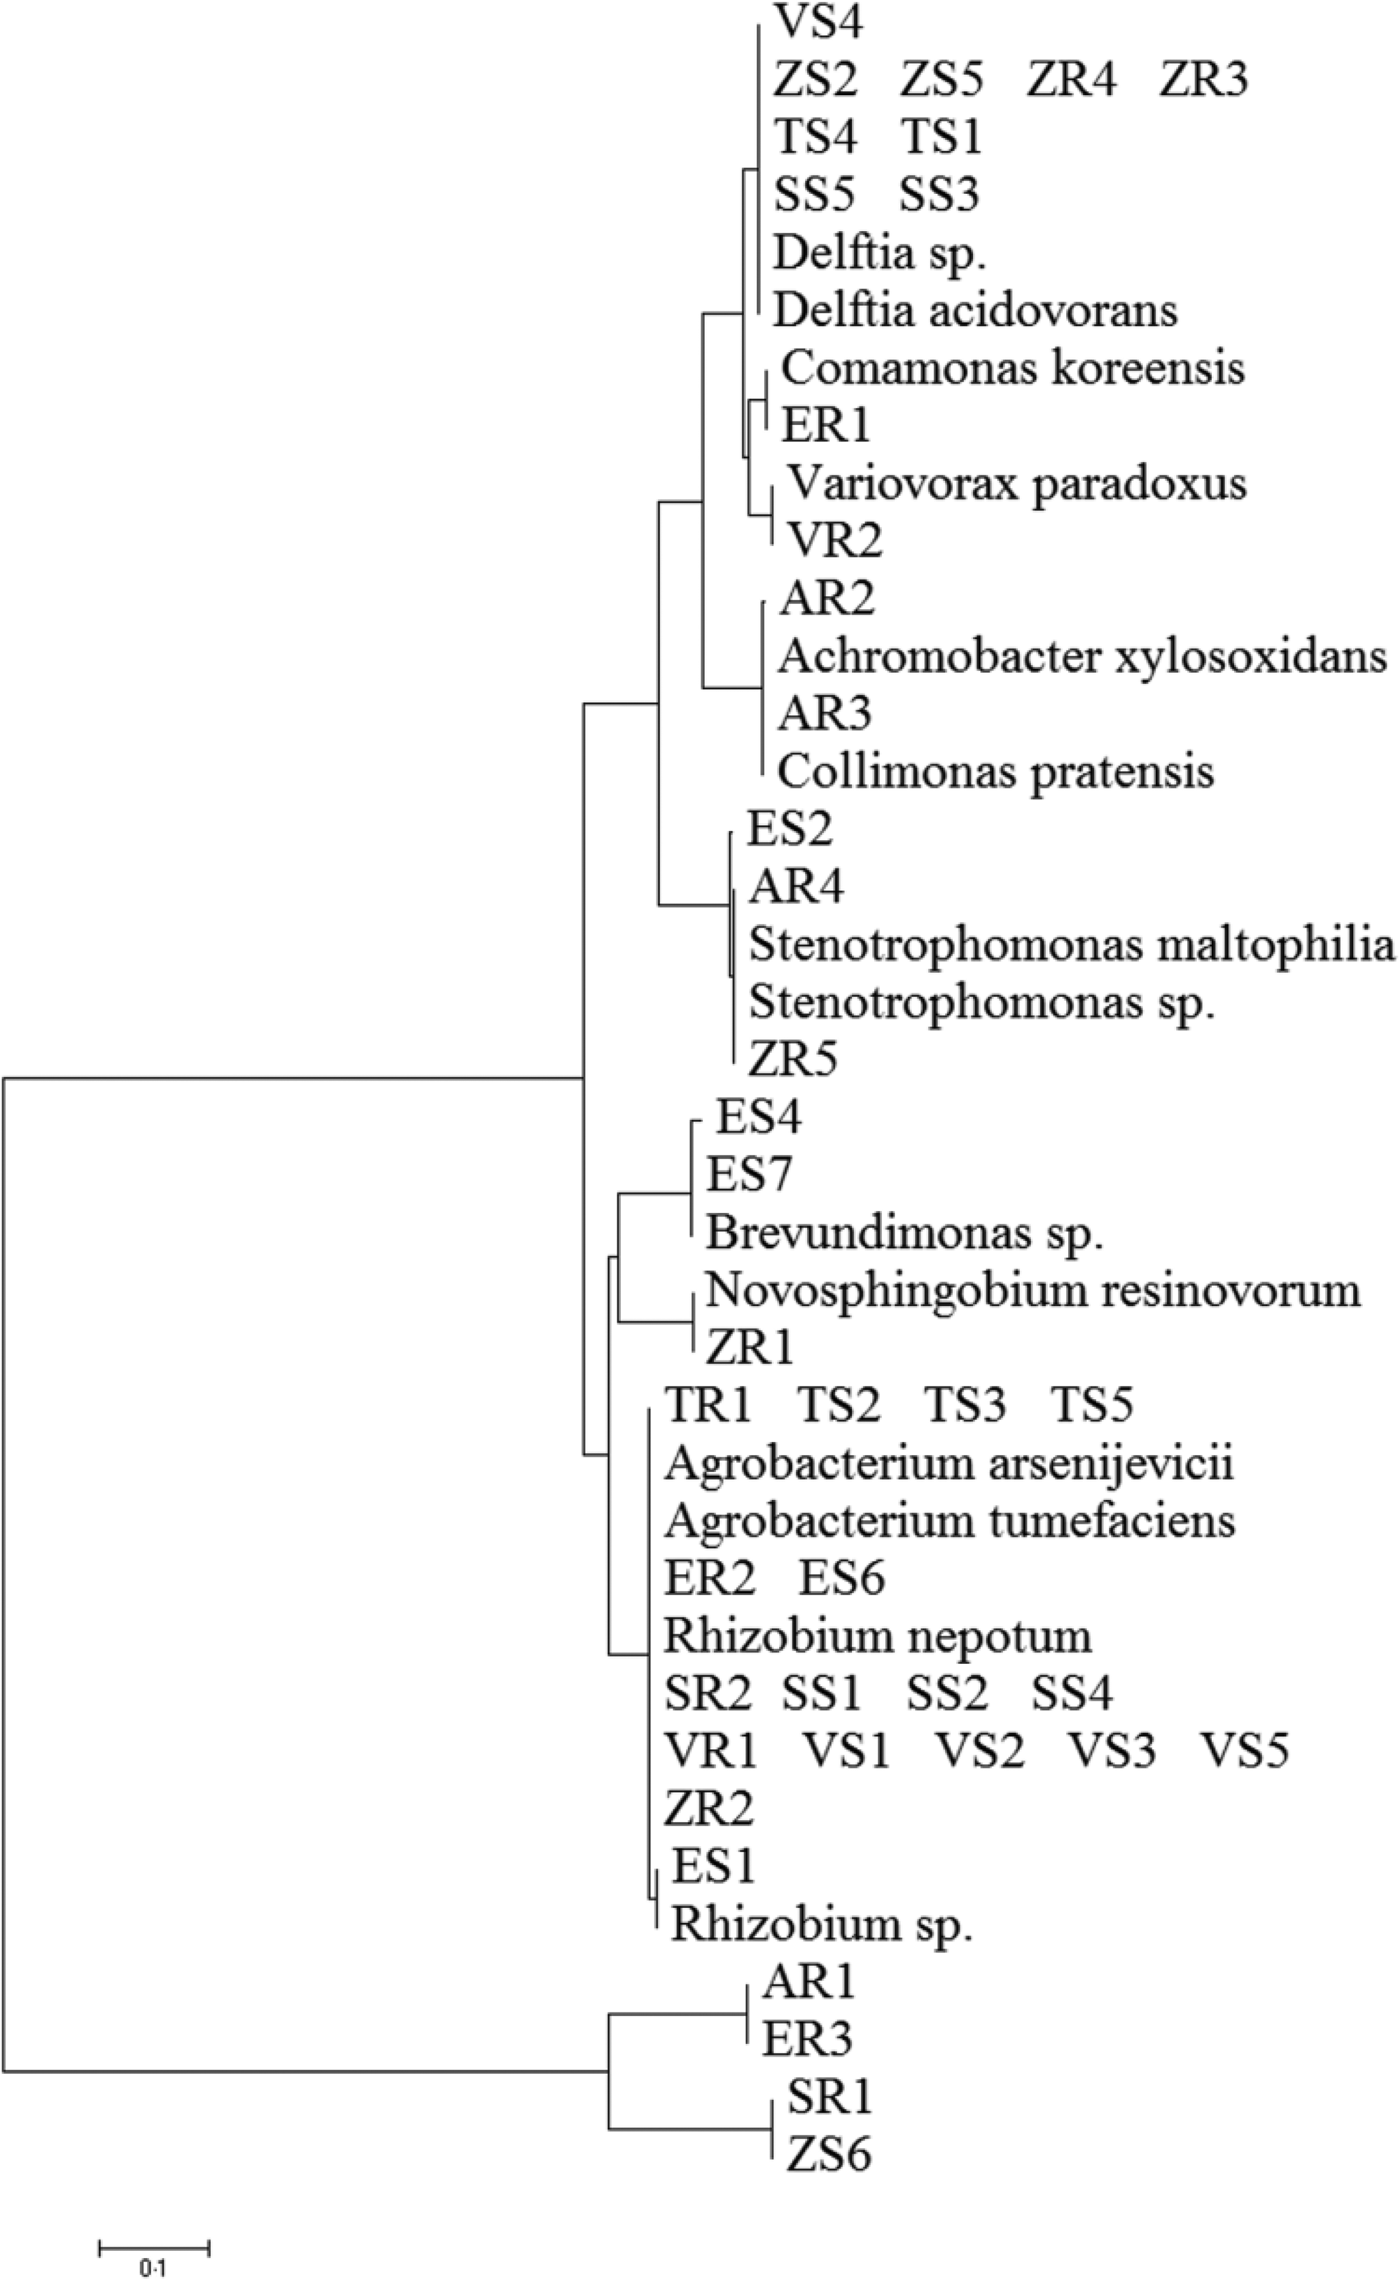
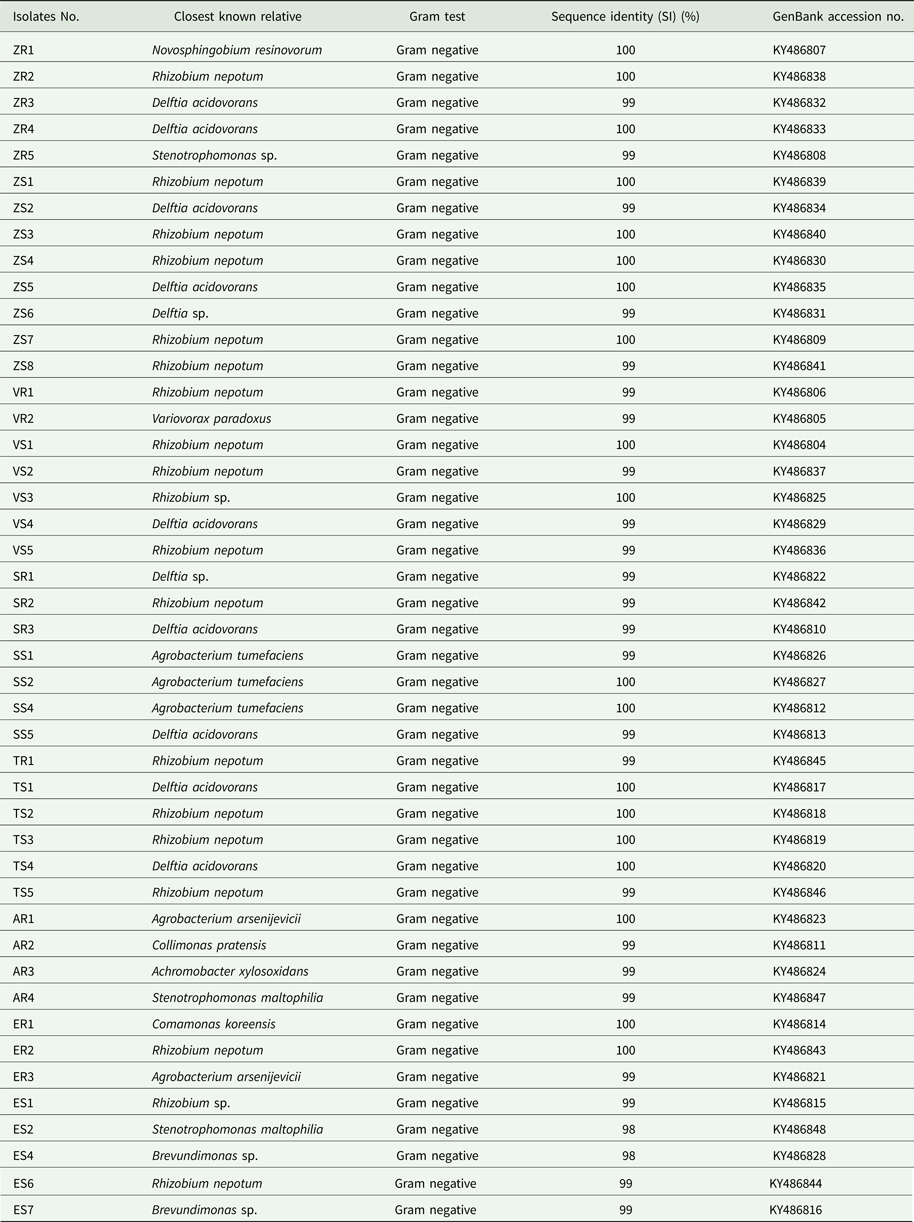
A total of 211 isolates were collected from all of the studied plants. Afterwards, 45 dominating bacterial colonies were selected (Table 1). Bacterial DNA was isolated following published protocols and the 16S rRNA gene was subjected to sequencing. The principal characteristics of the 45 isolates that were evaluated are given in Table 2. All isolates of endophytic bacteria were classified to the species level. Bioinformatics analysis grouped the bacterial isolates into ten genera: Rhizobium (19 isolates), Delftia (11 isolates), Agrobacterium (five isolates), Stenotrophomonas (three isolates), Brevundimonas (two isolates), Novosphingobium (one isolate), Variovorax (one isolate), Collimonas (one isolate), Achromobacter (one isolate) and Comamonas (one isolate). A total of 43 of the 45 isolates (0.96) possessed a 16S rDNA sequence with ⩾99% similarity to that of bacterial species collected with GenBank. Only two isolates identified as Stenotrophomonas maltophilia had a coefficient of similarity of 98%. The isolated bacteria were experimentally classified as Gram-negative. The sequences of 45 endophytic bacterial isolates were deposited at the GenBank and received accession numbers. Table 2 additionally shows the degree of sequence similarity of the16S rRNA gene with closely related taxa, as well as the inclusion of a given bacteria in the Gram group. All isolates of endophytic bacteria belonged to the Proteobacteria type – the largest group of bacteria. The majority of them (60%) were classified as α-Proteobacteria, 33% as β-Proteobacteria and 7% as γ-Proteobacteria. At the order level, bacteria were classified as 53.34% Rhizobiales, 33.34% Burkholderiales, 6.67% Xanthomonadales, 4.43% Caulobacterales and 2.21% Sphingomonadales. Among crops and weeds, no significant differences at the order level were observed, as both groups were dominated by the Rhizobiales and Burkholderiales orders. However, there were differences at the genera level; Rhizobium and Delftia genera were characteristic for crops, while Brevundimonas, Achromobacter, Collimonas and Comamonas for wild plants. Based on the obtained sequences, the phylogenetic tree was constructed (Fig. 1).
Phylogenetic analysis of 16S rRNA gene sequences of the bacterial isolates, along with the reference sequences from National Centre for Biotechnology Information.
The 45 isolates collected from different plants

Identification of isolates from plants by 16S rDNA sequence analysis
Polymerase chain reaction-denaturing gradient gel electrophoresis analysis
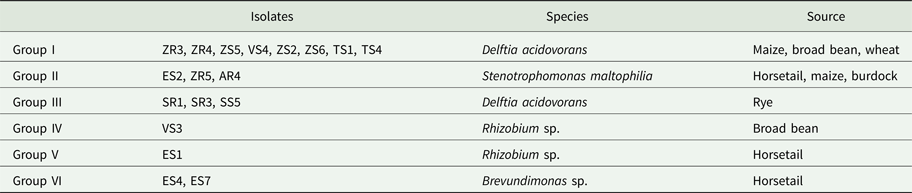
Based on band patterns obtained by PCR-DGGE, a similarity matrix for each of the bacterial isolates was generated. The bacterial isolates were grouped into clusters of similar profiles (Table 3).
Bacteria groups clustered using PCR-DGGE profiles
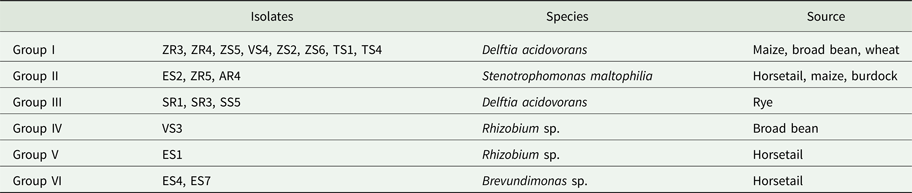
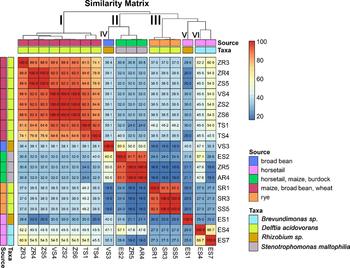
Based on the similarity matrix (Fig. 2), six main groups were created. Group I contained eight isolates, which were identified by 16S rRNA gene sequencing as D. acidovorans. The isolates of this group were isolated from maize, broad bean and wheat. Moreover, isolates obtained from maize (ZR4 and ZS5) were completely identical. Isolates obtained from broad bean (VS4) and maize (ZS2 and ZS6) were also completely identical. Hence, five genomotypes were designated in this group. Group II was composed of three isolates that were identified as Stenotrophomonas maltophilia. Each of these isolates was obtained from a different host plant (horsetail, maize and burdock). The highest similarity (100%) occurred between the ZR5 and AR4 isolates. This group included two genomotypes. Group III included three isolates, identified also as D. acidovorans. However, isolates classified into this group were isolated only from rye. Moreover, isolates SR3 and SS5 were 100% identical, which indicates the two genomotypes were identified in this group. Group VI contained two isolates of Brevundimonas sp. received from horsetail, which were 66.7% similar. The degree of similarity between the two isolates of Rhizobium sp. was low enough (40%) to divide them into two separate groups (IV and V). This might be because the isolates were obtained from two different host plants, one from the broad bean and the other from horsetail.
Diagram showing the similarity matrix of genomic DNA based on PCR-DGGE analysis. The matrix presents a comparison of each isolate of endophytic bacteria with the potential to promote plant growth with each other's, taking into account the source extraction of the bacterial isolates.
Repetitive element-polymerase chain reaction analysis
Of all 45 tested isolates, the most isolates (11) with potential ability to promote plant growth were assigned to genus Delftia. Therefore, the intrageneric differentiation by the technique of rep-PCR was performed on these isolates.
BOX-polymerase chain reaction fingerprinting
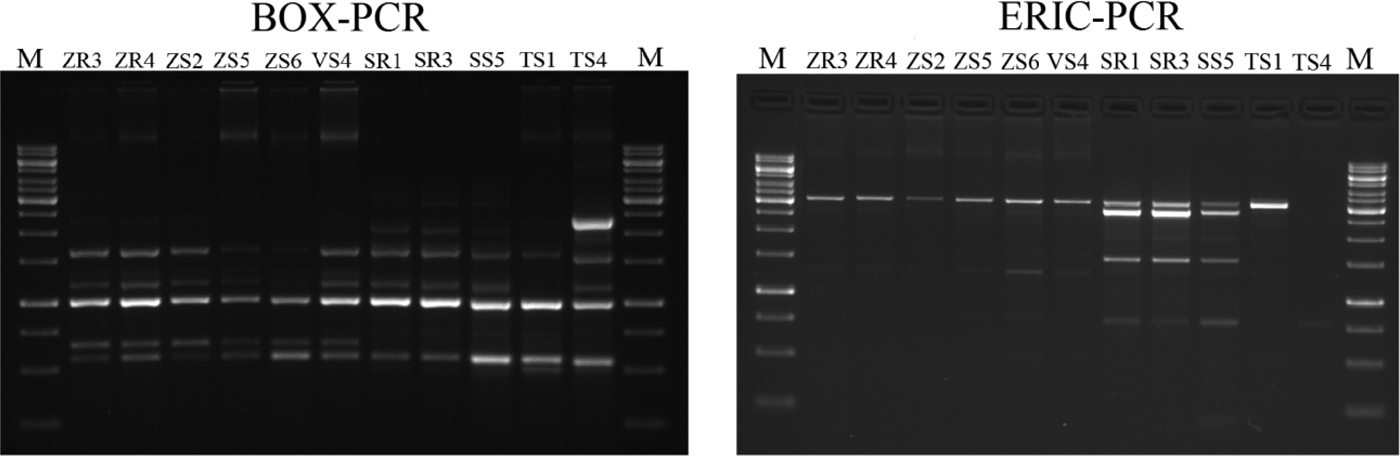
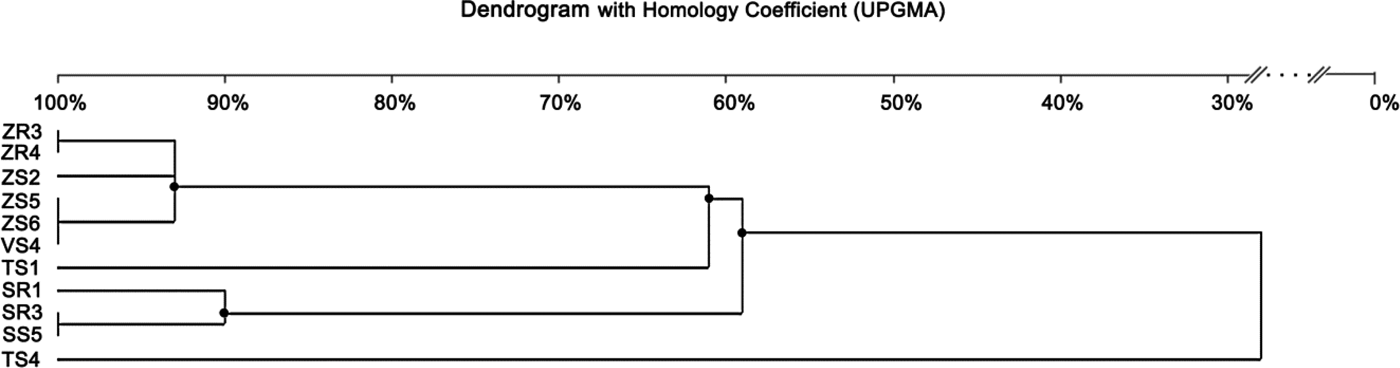
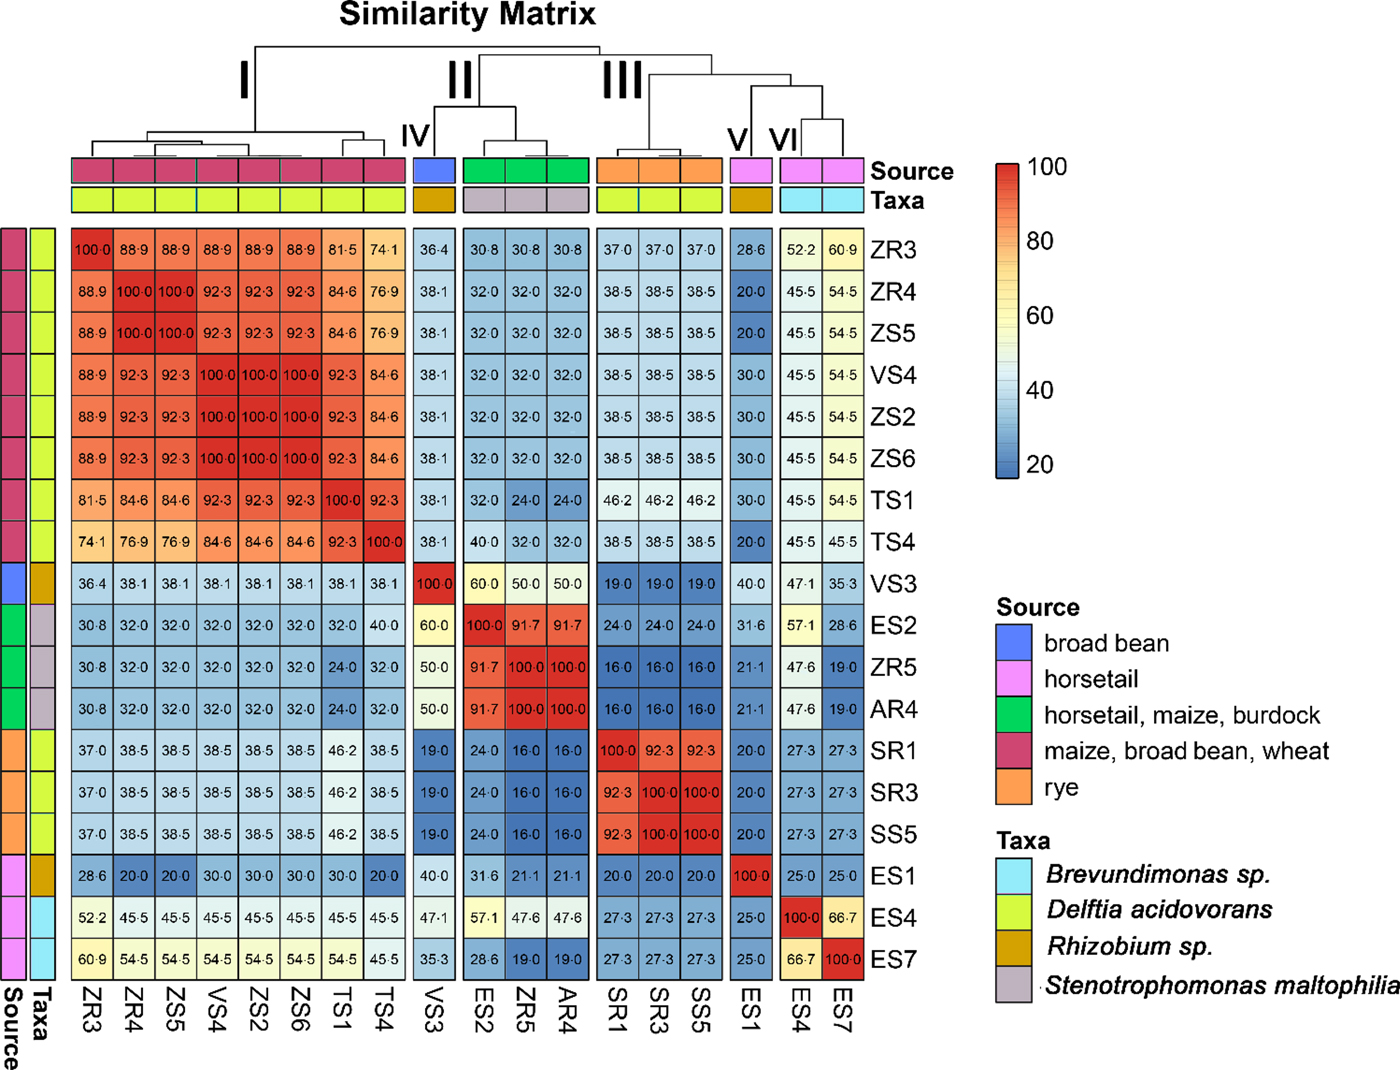
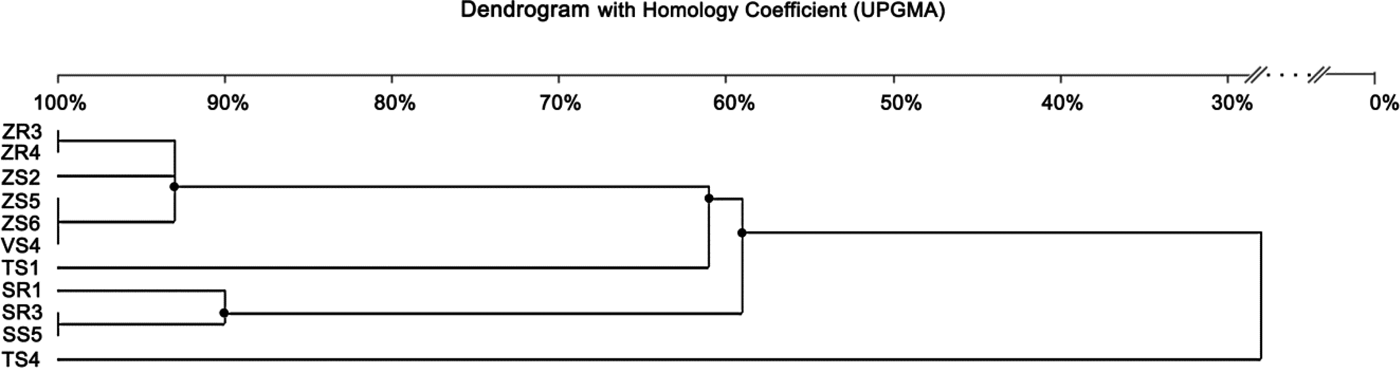
The BOX-PCR method was performed for 11 Delftia sp. isolates (Fig. 3). Afterwards, the amplification product was subjected to gel electrophoresis and a total of 77 bands were obtained. Generally, the number of bands per isolate varied between five and eight, ranging in size from 500 bp to 12.500 kb (Fig. 3). The maximum number of bands (eight) was observed for ZR3 and ZR4, while the lowest (five) was for VS4 and SS1. The dendrogram was generated based on the results of the BOX-PCR and revealed that isolates were distributed into two major clusters and two independent lineages (at the profile similarity coefficient of 85%). One cluster contained six isolates of D. acidovorans (isolated from maize and broad bean) with a similarity pattern between 93 and 100%. The largest similarity among the bands of genomic DNA occurred between the isolates ZR3 and ZR4 (100%), and ZS5, ZS6 and VS4 (100%). The second cluster comprised three isolates (received from rye) and had a similarity coefficient ranging from 90 to 100%. Two independent lines were represented by the isolates obtained from wheat. Based on the BOX-PCR analysis of 11 isolates of Delftia sp., seven genomotypes were distinguished (Fig. 4).
Agarose gel electrophoresis of BOX-PCR and ERIC-PCR fingerprinting patterns from genomic DNA of different isolates belonging to Delftia sp. Electrophoresis products on 1.5% agarose gel stained with ethidium bromide. On the left: BOX-PCR profile generated with the BOXA1R primer. On the right: ERIC-PCR profile generated with the ERIC1 and ERIC2 primers (M- molecular marker – GeneRuler 1 kb DNA Ladder, Thermo Scientific).
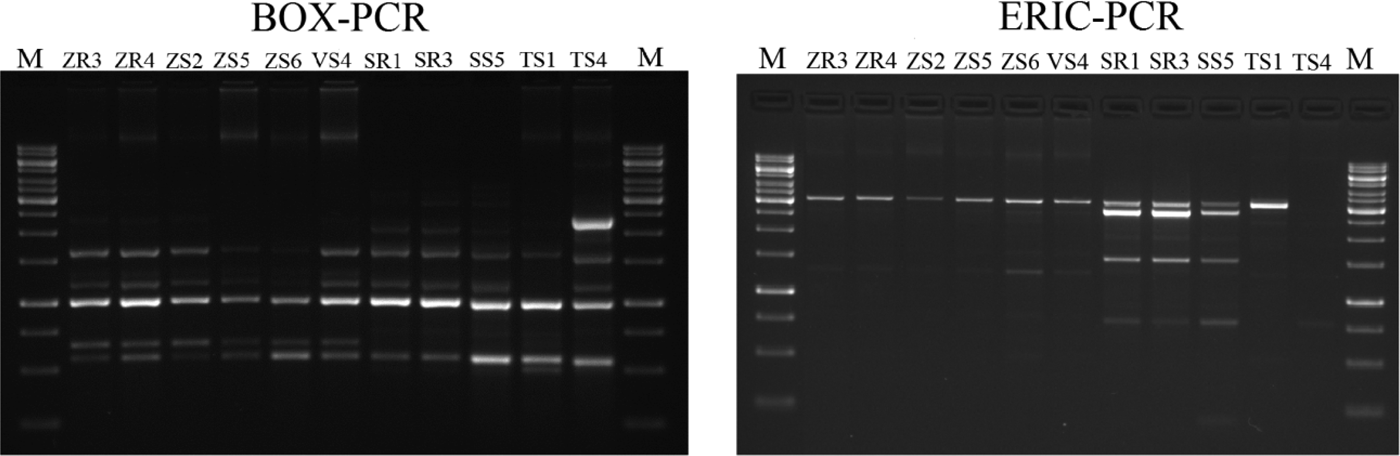
Dendrogram generated by UPGMA clustering of BOX-PCR fingerprinting of 11 Delftia sp. isolates. The scale at the top of the dendrogram presents the bacterial genome similarity rate (%).
Enterobacterial repetitive intergenic consensus-polymerase chain reaction fingerprinting
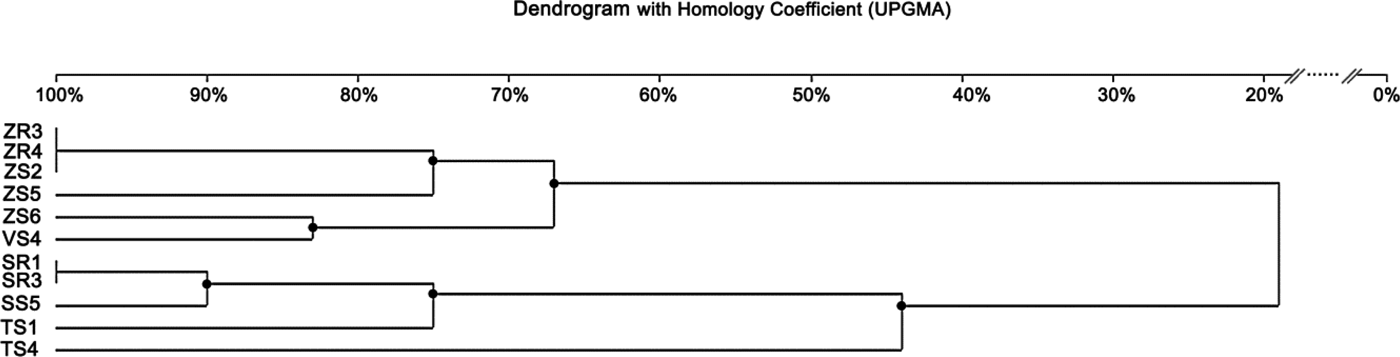
The ERIC-PCR fingerprinting, performed on 11 isolates of Delftia sp., generated a total of 49 bands. On average, three to seven bands were generated per isolate, and the size ranged from 232 bp to 12.222 kb (Fig. 3). The isolate ZS3 was characterized by the highest number of bands (seven), along with isolates ZR3, ZR4, ZS2. The isolate SS4 revealed the lowest number of bands (three). Similar to BOX-PCR, the generated dendrogram based on ERIC-PCR fingerprinting also showed two major groups (coefficient level of 65%) and one independent lineage. The first group included six isolates from maize and broad bean, with the ERIC-PCR similarity between them ranging from 67 to100%. It was also found that isolates ZR3, ZR4 and ZS2 were identical. On the other hand, four isolates obtained from rye and wheat were classified as belonging to the second group, with the similarity coefficient level ranging from 90 to 100%. Furthermore, isolates SR1 and SR3 were identical. One independent lineage was created by the wheat isolate. Overall, eight genotypes were distinguished from 11 tested isolates (Fig. 5).
Dendrogram generated by UPGMA clustering of ERIC-PCR fingerprinting of 11 Delftia sp. isolates. The scale at the top of the dendrogram presents the bacterial genome similarity rate (%).
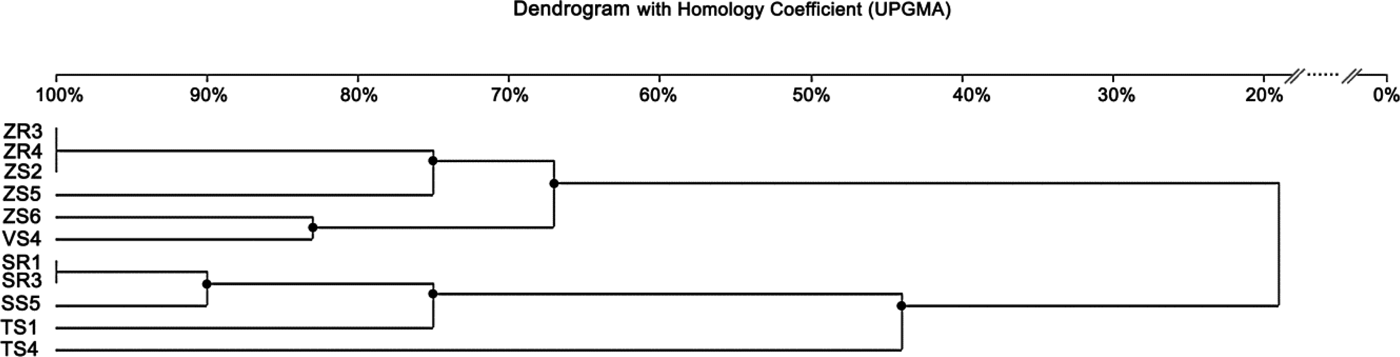
The dendrogram generated from the DNA patterns obtained by ERIC-PCR revealed the presence of two main groups, similar to BOX-PCR. However, a higher number of genomotypes, with a lower level of similarity coefficient, was generated using the ERIC-PCR method. Therefore, it can be suggested that this technique was more efficient in the differentiation of Delftia sp. isolates. In the case of bacteria groups isolated from rye, both methods showed the same results. Based on the analysis of band patterns using the PCR-DGGE method, isolates belonging to the genus Delftia were also divided into two groups. Similar to two previous methods, PCR-DGGE assigned bacteria from maize, broad bean and wheat to one group. The second main group was created by isolates obtained from rye, as in previous methods. In all three methods, isolates classified into the second group (II) were slightly different. However, PCR-DGGE and BOX-PCR methods revealed that SR3 and SS5 isolated from rye were identical. These results confirmed that they represent the same strain.
Discussion
Molecular characterization of bacteria is the first step in the development of the bio-stimulators. Most microorganisms are identified using the 16S rRNA gene sequencing technique. Next, in order to screen and select the most efficient strains that reveal plant growth promoting activities, a wide range of in vitro biochemical analyses are used (Szilagyi-Zecchin et al., Reference Szilagyi-Zecchin, Ikeda, Hungria, Adamoski, Kava-Cordeiro, Glienke and Galli-Terasawa2014). Finally, before commercialization, any bio-product developed should be tested directly on target plants in greenhouse experiments and under field conditions. In the current research, the identification and differentiation of endophytic bacteria from crops and wild plants were performed: the results obtained will contribute to the selection process. The bacteria isolated can potentially be used to develop a suitable inoculant that can offer an alternative to commonly used agrochemicals.
A detailed analysis of endophytic bacteria composition, using reference sequences from the 16S rRNA gene, revealed that the majority of bacteria identified in the current study belonged to the phylum Proteobacteria. These findings are consistent with those reported by Niu et al. (Reference Niu, Paulson and Zheng2017) and Robinson et al. (Reference Robinson, Fraaije, Clark, Jackson, Hirsch and Mauchline2016), who demonstrated that Proteobacteria was the dominant group found in maize roots and leaves and roots of wheat. The results of the current study also confirmed that the dominant species within Proteobacteria group were Delftia acidovorans, Variovorax paradoxus, Achromobacter xylosoxidans, Brevundimonas sp., Rhizobium sp. and Stenotrophomonas maltophilia. Previous research has shown that these bacteria can affect plant growth and development positively by production of indole-3-acetic acid, synthesis of 1-ACC-deaminase, nitrogen fixation, HCN production and phosphate solubilization (Deshwal et al., Reference Deshwal, Pandey, Kang and Maheshwari2003; Jha and Kumar, Reference Jha and Kumar2009; Han et al., Reference Han, Choi, Lee, Orwin, Kim, LaRoe, Kim, O'Neil, Leadbetter, Lee, Hur, Spain, Ovchinnikova, Goodwin and Han2011; Kumar and Gera, Reference Kumar and Gera2014; Ambawade and Pathade, Reference Ambawade and Pathade2015). However, these bacteria were previously isolated from different plants. For example, Otsu et al. (Reference Otsu, Matsuda, Shimizu, Ueki, Mori, Fujiwara, Nakajima, Miwa, Nonomura, Sakuratani, Tosa, Mayama and Toyoda2003) isolated V. paradoxus from tomato leaves and Jha and Kumar (Reference Jha and Kumar2009) isolated A. xylosoxidans from surface-sterilized roots and culms of wheat. The bacteria of the genus Brevundimonas were previously isolated from leaves of the common bean (De Oliveira Costa et al., Reference De Oliveira Costa, de Queiroz, Borges, de Moraes and de Araújo2012). Gupta et al. (Reference Gupta, Kale, Rathi and Jadhav2015) found Stenotrophomonas sp. in root and leaf tissues of Prosopis cineraria.
Although in the current study the wild plants were collected from the same field as the crops, a distinct bacterial composition was revealed. In the tissues of wild plants, Collimonas pratensis, Achromobacter xylosoxidans, Comamonas koreensis and Brevundimonas sp. were found. However, these species were not found in the crops. From the existing literature, it is known that these species might also have the potential to promote plant growth (Jha and Kumar, Reference Jha and Kumar2009; Liaqat and Eltem, Reference Liaqat and Eltem2016). The structure of plant microorganisms was dependent on environmental conditions (biotic and abiotic factors). Results suggest that the plant's genotype was a major factor influencing the composition of the endophytic microbial community of the plant. Plant roots secrete various compounds that are a great source of carbon, nitrogen and energy for bacteria (James et al., Reference James, Suslow and Steinback1985). It might be expected that some of these plant-specific secretions attract certain groups of bacteria that eventually enter the plant's tissues. Therefore, the composition of the endophytic community inhabiting a plant might be determined by its physiology, which confirms the current study (James et al., Reference James, Suslow and Steinback1985). In conclusion, the host plant had a significant influence on the type of bacteria that inhabited its tissue. Rhizobium and Delftia bacteria were found in all the crops assessed in the current study. However, most of the Rhizobium isolates were classified as pathogenic species Rhizobium nepotum, which causes root nodule disease (Puławska et al., Reference Puławska, Willems, De Meyer and Süle2012).
On the other hand, bacteria of the genus Delftia have been isolated frequently from the soil, contaminated environments or activated sludge (Müller et al., Reference Müller, Jorks, Kleinsteuber and Babel1999; Hollender et al., Reference Hollender, Dreyer, Kornberger, Kämpfer and Dott2002). Also, D. acidovorans could occur inside rice roots (Sun et al., Reference Sun, Qiu, Zhang, Dai, Dong and Song2008) or in the rhizosphere of sugarcane plants (Senthilkumar et al., Reference Senthilkumar, Anandham, Madhaiyan, Venkateswaran, Sa and Maheshwari2011). De Oliveira Costa et al. (Reference De Oliveira Costa, de Queiroz, Borges, de Moraes and de Araújo2012) reported that bacteria of the genus Delftia could reside in leaves as an endophyte of common bean. The ubiquitous occurrence of these bacteria suggests that they might be promising organisms with potential plant growth promoting capacities. It is known that bacteria from the genus Delftia might have a number of features potentially applicable in agriculture.
Most studies on endophytic bacteria and their community structure have been performed using culture-dependent approaches. Isolation of culturable bacteria is appropriate for functional analysis for plant growth promoting properties in the future. In the current study, the cultivation-based method using TSA medium was applied in the isolation of bacteria. This method has some limitations as it enables the isolation and identification of culturable bacteria only and a high percentage of naturally occurring bacteria remain in a non-culturable state. However, when supplemented with molecular techniques, such as next-generation sequencing, it allows determination of the abundance and diversity of all bacterial populations in plant tissue (Handelsman, Reference Handelsman2004).
Kumar et al. (Reference Kumar, Kumar and Pratush2014) suggested that 16S rRNA gene sequencing was not always capable of differentiating isolates at the strain level. However, in the current study PCR-DGGE, BOX-PCR and ERIC-PCR were reliable tools for characterization of isolates at the genomic level. In the current study, PCR-DGGE fingerprints revealed differences in the structure of the evaluated bacteria. The results obtained by this method allowed the selection of differentiated genomotypes from isolated groups of microorganisms. Among these were isolates with complete similarity, which were classified to the same genomotype. In the case of Rhizobium, isolates belonging to groups V and VI exhibited a relatively low level of genomic similarity. This was probably due to the fact that these isolates were obtained from two different host plants, with the indication that one was a crop and the other a weed. The plant genotype had a decisive influence on the differentiation of bacteria of the genus Rhizobium.
The BOX and ERIC sequences have been presented for the genome of variant Delftia isolates, confirming and extending the conclusion of Versalovic et al. (Reference Versalovic, Schneider, De Bruijn and Lupski1994) and De Bruijn (Reference De Bruijn1992). The Delftia isolates used in the current study were isolated from different cultivated crops in the same geographical location. Repetitive fingerprint analysis employing ERIC and BOX probes yielded informative amplicons about individual isolates, showing genetic variability at intrageneric levels. The data from the current study suggests that BOX-PCR and ERIC-PCR were useful tools for assessment of the correlation between host-plant and BOX-PCR and ERIC-PCR patterns. Isolates from the same plant showed similar patterns.
Gao et al. (Reference Gao, Terefework, Chen and Lindström2001) found that in the case of rhizobia, almost every isolate had its unique BOX-PCR patterns when the bacteria were isolated from the same site. Therefore, they were genetically distinct from each other. On the contrary, Li et al. (Reference Li, Wang, Chen and Chen2008) demonstrated that many endophytic bacteria isolated from the same place had identical BOX-PCR patterns. The results of the current study are consistent with the results of both authors. Some Delftia sp. isolates obtained from maize were genetically identical, while others were different to the level of 7%. Li et al. (Reference Li, Wang, Chen and Chen2008) concluded that endophytic bacteria communities might be determined by both geographic origins and the host plant. The above-mentioned results showed that similar to the BOX-PCR, isolates from the same host plant and site were differentiated by the ERIC-PCR method to different degrees. Some of them revealed 100% similarity, others were as low as 67%.
Katara et al. (Reference Katara, Deshmukh, Singh and Kaur2012) demonstrated that the majority of Bacillus thuringiensis isolated from the same site in India showed a high level of genetic diversity. Only a small proportion of the isolates were characterized by the same ERIC-PCR patterns. Katara et al. (Reference Katara, Deshmukh, Singh and Kaur2012) also demonstrated that bacteria isolated from different sites were also highly genetically diverse. In the current study, the ERIC-PCR method was the most efficient for Delftia sp. isolate differentiation. Similar results were obtained by Ogutcu et al. (Reference Ogutcu, Adiguzel, Gulluce, Karadayi and Sahin2009), who demonstrated that ERIC-PCR was more successful in the differentiation of Rhizobium leguminosarum isolated from root nodules of wild chickpea in several regions of Turkey. Also, Gnat et al. (Reference Gnat, Małek, Oleńska, Trościańczyk, Wdowiak-Wróbel, Kalita and Wójcik2015) reported that the ERIC-PCR method was a more powerful tool to diversify microsymbionts, such as Astragalus glycyphyllos, compared with other methods (such as random amplification of polymorphic DNA or amplified fragment length polymorphism). The same results were observed by Kumar et al. (Reference Kumar, Kumar and Pratush2014) in the differentiation of Bacillus sp. from the rhizosphere of an apple tree.
In general, based on the dendrograms constructed from DNA patterns obtained with PCR-DGGE, BOX-PCR and ERIC-PCR methods, composition of the isolates in the two main groups of Delftia sp. was very similar. For BOX-PCR, ERIC-PCR and PCR-DGGE, the isolates formed similar groups, correlated with the type of the host-plant from which they were isolated. Among the isolates of Delftia sp., which were differentiated by all three methods, the so-called ‘maize and broad bean group’ and ‘rye group’ were distinguishable. It is important to use PGPB isolated from a specific environment where they will be used as bio-inoculants. It can be expected that these bacteria will better adapt and be able to compete with other native strains. In addition, the current analysis has clearly shown the effect of the plant on the diversity and structure of the microbiome, which depends on the plant species and its developmental stage.
Conclusion
Sequencing of 16S rRNA allowed accurate identification of bacterial genera endophytes from various plant species. The present study showed that the type of plant (crop and wild plants) had a decisive influence on the grouping of the bacterial isolates, their diversity and community composition. In addition, a larger number of bacteria potentially promoting plant growth was isolated from the roots than from the stems. These results are in line with the knowledge that the most bacteria promoting plant growth can be found on/in the root. In conclusion, plant organ and genotype affect the endophytic bacterial community composition. The ERIC-PCR and BOX-PCR seemed a good approach for molecular typing of Delftia strains isolated from different plant crops. The results of the current study proved the usefulness of BOX-PCR and ERIC-PCR genomic fingerprinting as complementary techniques to PCR-DGGE analysis for studying the phylogenetic relationships of endophytic bacteria. This investigation extends knowledge about the diversity of endophytic bacteria in maize, broad bean, wheat and rye, providing new insights into the complexity of the microbiome of these economically important crops. Molecular differentiation of the endophytic bacteria was the first step in the selection of bacteria that could potentially promote plant growth and development. The purpose of future research will be to focus on the biotechnological potential of the selected isolates by characterizing plant growth promotion properties, such as the production of siderophores and phytohormones, as well as nitrogen fixation. In the future, the selected bacteria will be used in agriculture as commercial bioproducts.
Financial support
This research was supported by the project nr 1.21 (2017–2019) the statutory activity of IUNG-PIB in Pulawy ‘Molecular and biochemical identification of endophytic bacteria and their use in plant growth promotion’ and partly by Task 1.4. Multi—Annual Programme IUNG—PIB (2016–2020).
Conflicts of interest
None.
Ethical standards
Not applicable.